Qualcomm stock forecast: Modular acquisition talks
Qualcomm’s shares came into focus after the company issued Q3 2026 revenue and EPS guidance below prior consensus estimates, alongside reports of talks to acquire Modular Inc. Explore third-party QCOM price targets and technical analysis.
Qualcomm Incorporated (QCOM) last traded at $173.34, having moved within an intraday range of $169.15–$177.64 as of 2:51pm UTC on 23 July 2026. Past performance is not a reliable indicator of future results.
Sentiment has been shaped by Qualcomm's fiscal third-quarter 2026 guidance, which set a non-GAAP earnings per share (EPS) outlook of $2.10–$2.30 and revenue guidance of $9.2bn–$10.0bn (Qualcomm, 29 April 2026). Both figures came in below previous consensus estimates when analysts reviewed the company's Q2 results (Reuters, 30 April 2026). The shares also drew attention earlier in the month amid reports that Qualcomm was in advanced talks to acquire artificial intelligence (AI) infrastructure company Modular Inc (Bloomberg, 22 June 2026), a deal Qualcomm subsequently confirmed in an all-stock transaction valued at nearly $4 billion (Reuters, 24 June 2026). Separate commentary highlighted uncertainty around smartphone demand over the following 30 days (TradingKey, 6 July 2026).
Third-party Qualcomm outlook: Q3 guidance misses estimates
As of 23 July 2026, third-party Qualcomm stock predictions point to a 12-month average target broadly in the $210–$225 range. The projections reflect differing assumptions about handset demand, AI data-centre expansion and licensing revenue. The following mini-briefs summarise leading third-party forecasts published during this period, ordered from lower to higher.
Public.com consensus
Public.com projects a 12-month price target of $212.74 for Qualcomm, based on a consensus 'hold' rating from 23 analysts as of 21 July 2026. This target suggests limited movement from the reference price and reflects a mixed distribution of analyst ratings (Public.com, 21 July 2026).
Investing.com consensus estimates
Investing.com forecasts an average 12-month share price target of $221.90 for Qualcomm as of 12 July 2026, drawing on projections from 30 analysts. The forecast implies potential upside of around 20.6% from prevailing levels, with individual estimates ranging from $100 to $314 (Investing.com, 12 July 2026).
TD Cowen house view
TD Cowen projects a 12-month price target of $225 for Qualcomm, up from $200, while maintaining a 'buy' rating as of 12 July 2026. The firm's view follows a broader analyst-polled average target of $228.13 reported by FactSet at the time, with expectations linked partly to growth in Qualcomm's AI and automotive businesses (MarketScreener, 13 July 2026).
MarketBeat brokerage consensus
MarketBeat forecasts an average 12-month price target of $219.76 for Qualcomm as of 21 July 2026, based on projections from 38 Wall Street equity research analysts. The estimates span $120–$300, implying upside of roughly 25.1% from the reference price used in the report (MarketBeat, 21 July 2026).
Predictions and third-party forecasts are inherently uncertain, as they cannot fully account for unexpected market developments. Past performance is not a reliable indicator of future results.
Qualcomm's latest earnings
Qualcomm's most recent reported results cover its fiscal second quarter of 2026, which ended on 29 March 2026 and were published on 29 April 2026 (Qualcomm, 29 April 2026). Revenue reached $10.6bn, down 3.5% year on year, while non-GAAP EPS came in at $2.65, ahead of the analyst consensus estimate of $2.56 (MarketBeat, 21 July 2026).
GAAP EPS was $6.88, reflecting a $5.7bn income tax benefit tied to the release of a valuation allowance established in fiscal Q4 2025. This contributed to a 162% year-on-year increase in net income (StockTitan, 28 April 2026). The results included record quarterly Qualcomm CDMA Technologies (QCT) automotive revenue, while combined automotive and Internet of Things (IoT) revenue grew 20% year on year (Qualcomm, 29 April 2026). By contrast, memory supply constraints affected QCT handset revenue (StockTitan, 28 April 2026).
Qualcomm completed $5.4bn of share repurchases in the first half of fiscal 2026 and announced a new $20bn repurchase authorisation (Qualcomm, 17 March 2026). It also returned $3.7bn to shareholders during the quarter, including $945m in cash dividends (Qualcomm, 29 April 2026).
For the next reporting period, Qualcomm's fiscal third-quarter 2026 guidance pointed to revenue of $9.2bn–$10.0bn and non-GAAP EPS of $2.10–$2.30 (Reuters, 29 April 2026). Management indicated that Q3 could represent the low point for China Android shipments before a potential quarter-on-quarter improvement (MarketBeat, 21 July 2026).
QCOM stock price: technical overview
As of 2:51pm UTC on 23 July 2026, The QCOM stock price last traded at $173.34, below part of its short- and medium-term moving-average cluster. According to data referenced on TradingView, the 20-, 50-, 100- and 200-day simple moving averages (SMAs) stand at approximately $182, $204, $174 and $169, respectively. The 20-day SMA sits below the 50-day SMA, so the pair does not currently form a bullish alignment.
Momentum readings are mixed but generally subdued. The 14-day relative strength index (RSI) sits near 40, in lower-neutral territory, while the 14-day average directional index (ADX) reads around 13. Under commonly used technical thresholds, this suggests that the prevailing trend lacks strength. The moving average convergence divergence (MACD) level and Awesome Oscillator are also in negative territory, indicating weaker near-term momentum at the time of the reading. However, technical indicators can change quickly and do not determine future price movements.
Above the current price, the nearest classic pivot resistance sits at the R1 level near $232, according to TradingView’s pivot data. A daily close above that zone could bring the R2 area near $279 back into view, although pivot levels alone cannot indicate whether this will occur.
Below the current price, the 200-day SMA near $169 provides the closest longer-term moving-average reference in the cited data. The 100-day SMA near $174 sits slightly above it and may also influence price action. A sustained move below this area could shift attention towards lower support levels, although this remains one of several possible scenarios (TradingView, 23 July 2026).
This technical analysis is for informational purposes only and does not constitute financial advice or a recommendation to buy or sell any instrument.
Qualcomm share price history (2024–2026)
QCOM’s stock price reached what was then an all-time closing high of $220.95 on 18 June 2024 before entering a more volatile period in late 2024 and early 2025. During this time, the shares traded broadly within the $130–$180 range amid changing expectations for handset demand and AI-related growth. (Macrotrends)
One of the stock’s largest recent movements began after shares fell to $122.31 on 8 April 2025 amid tariff-related uncertainty affecting the semiconductor sector. By 11 May 2026, QCOM had risen to a new all-time intraday high of $247.90. The five-session move leading into the peak amounted to around 42% and followed a data-centre announcement during the Q2 earnings call, developments in US–China tariff negotiations and several analyst rating changes. (TIKR)
The stock subsequently declined through June and July, moving from above $240 on 4 June 2026 to around $171.40 on 23 July 2026, the last recorded close in this dataset. That places QCOM roughly 30.8% below its May 2026 peak, while remaining above its April 2025 low. The two-year period therefore included substantial movements in both directions.
Past performance is not a reliable indicator of future results. Share prices are indicative and may differ from live market prices.
Qualcomm (QCOM): Capital.com analyst view
QCOM’s price action in 2026 has featured sharp movements rather than a consistent trend. The stock climbed from lows near $122 in April 2025 to an all-time intraday high of $247.90 in May 2026, before retreating to around $171 by late July. This volatility reflects several competing factors, including developments in data-centre and automotive revenue, alongside continued uncertainty around handset demand and memory costs.
Some analysts interpret the decline from May’s peak as a correction following a rapid, catalyst-led rise. Others consider it a possible sign of more cautious expectations for near-term earnings momentum. Neither interpretation establishes a likely future direction.
Some market participants cite diversification into AI infrastructure and automotive chips as a potential longer-term growth driver. However, this expansion carries execution risk and depends partly on continued demand from a relatively concentrated group of large customers. Licensing revenue and cost controls have also supported margins, while weaker smartphone shipments or renewed trade tensions may affect future performance and market sentiment. Past performance is not a reliable indicator of future results.
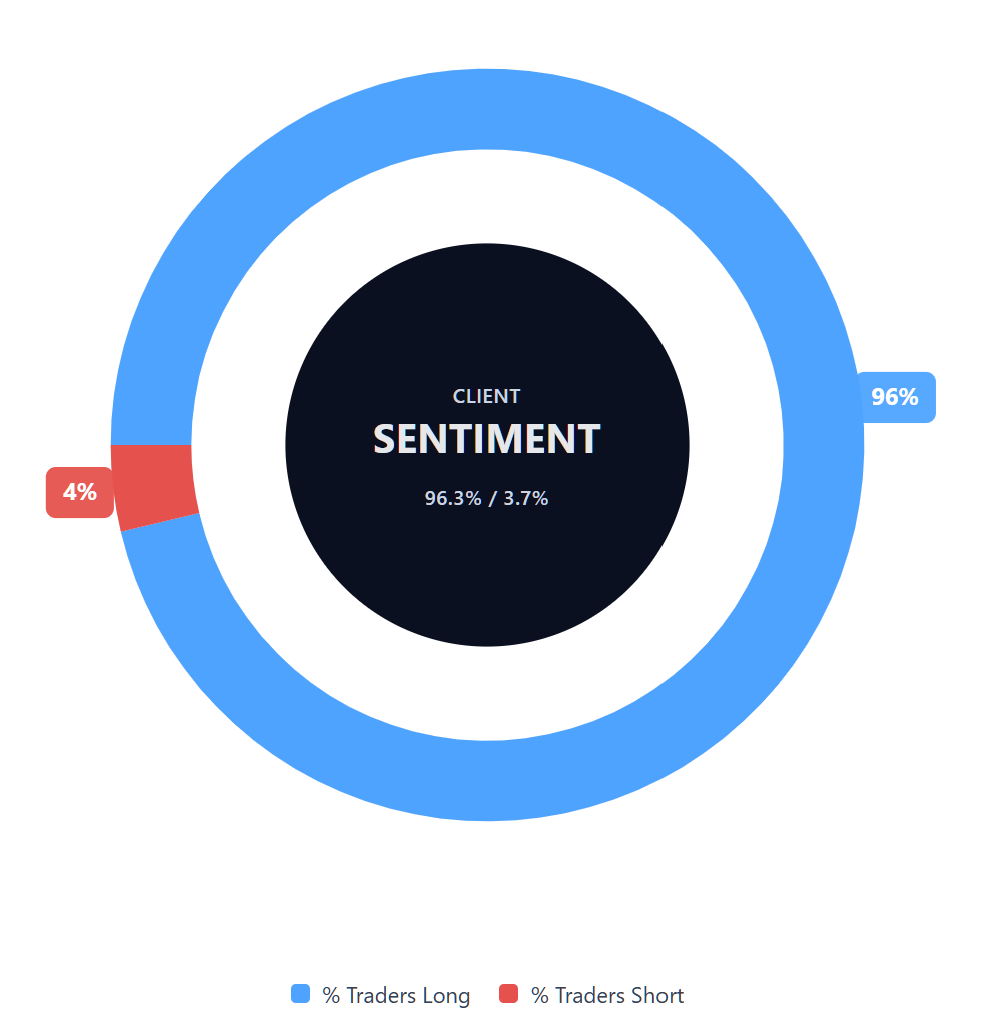
Capital.com’s client sentiment for Qualcomm CFDs
As of 23 July 2026, Capital.com client positioning in Qualcomm CFDs is weighted towards long positions, with 96.3% buyers and 3.7% sellers. This represents a difference of 92.6 percentage points. The figures show open positions held by Capital.com clients at the time of publication and can change. They do not indicate how QCOM’s price will move.
Summary – Qualcomm 2026
- QCOM traded at $173.34 as of 2:51pm UTC on 23 July 2026, below May’s all-time intraday high of $247.90 but above the recorded low of $122.31 from April 2025.
- Technical indicators place the price below several key moving averages, with the RSI near 40 and the ADX near 13. At the time of the reading, these figures indicated subdued momentum and limited trend strength under commonly used technical thresholds.
- Key factors include developments in AI data-centre and automotive chips, licensing revenue, memory costs and mixed handset demand across major markets.
- Recent developments include fiscal Q3 2026 guidance of $9.2bn–$10.0bn in revenue, a new $20bn share repurchase plan and reports of talks concerning a potential acquisition in the AI infrastructure sector.
Past performance is not a reliable indicator of future results.
FAQ
Who owns the most QUALCOMM stock?
What is the five-year QUALCOMM share price forecast?
Is QUALCOMM a good stock to buy?
Could QUALCOMM stock go up or down?
Should I invest in QUALCOMM stock?
Can I trade QUALCOMM CFDs on Capital.com?
Yes, you can trade Qualcomm CFDs on Capital.com. Trading share CFDs lets you speculate on price movements without owning the underlying asset and to take long or short positions. However, contracts for difference (CFDs) are traded on margin, and leverage amplifies both profits and losses. You should ensure you understand how CFD trading works, assess your risk tolerance, and recognise that losses can occur quickly.