Trading the Nasdaq 100 amidst the ‘AI Scare Trade’
Valuation, disruption and rotation have been short-term themes testing short-term technicals, though in sentiment traders remain majority buy.
U.S. equity index futures are higher following a losing week where the S&P 500 (w/w -1.2% to 6,836), Nasdaq 100 (w/w -0.9% to 24,732), Dow 30 (w/w -1.1% to 49,500), and Russell 2000 (w/w -0.8% to 2,646) all finished lower amid continued AI-disruption and valuation concerns causing rotation with most sectors finishing Friday’s session higher but where tech, communication and consumer discretionary were in the red. The ‘AI trade’ was the hero for quite a time, but the latest tools have hurt software, and then logistics and wealth management stocks with participants wondering who might be next in the current ‘AI scare trade’.
Shares of Nvidia (-2.2%) finished Friday’s session lower but plenty of others within the semiconductor sphere closed higher including Qualcomm (+1.6%) and Arm (+2.5%), while looking at Big Tech in general and it was a tough week for Apple shares down 8% w/w undoing its gains for the year and down over 5% since the start of 2026.
Traders were focused on the latest CPI (Consumer Price Index) prints for the month of January, and they came in softer than expected for headline falling from 2.7% y/y (year-on-year) to 2.4% (vs 2.5% forecast) and 0.2% m/m (month-on-month) vs the 0.3% estimate while core (which excludes food and energy) fell a notch to 2.5% as expected with a m/m increase of 0.3%.
Treasury yields w/w were in for a slide on the mid to further end of the curve with a pullback for breakeven inflation rates, with a notable move on Friday after a softer-than-expected January CPI print. Market pricing (CME’s FedWatch) via majority sees 25bp (basis point) rate cuts out of the Fed in June and September and roughly a coin toss on a third in December. There was the FOMC’s (Federal Open Market Committee) Goolsbee speaking, saying services inflation is “pretty high”, “worrisome” and “not tame” while describing the labor market as “steady” with only “modest cooling”.
Week ahead
It’s a light start with a holiday today and a few low-impacting items tomorrow, minutes from the latest FOMC meeting releases on Wednesday, the weekly claims and trade on Thursday, and a plethora of items on Friday including advance GDP (Gross Domestic Product), PCE (Personal Consumption Expenditures), and preliminary PMIs (Purchasing Managers’ Index). In earnings, there’s Palo Alto tomorrow, DoorDash on Wednesday, Walmart on Thursday, and Warner Bros Discovery on Friday. We’re in the middle of another government shutdown albeit a partial one and in turn expected to be of lesser impact compared to before but where it can still add to the turbulence.
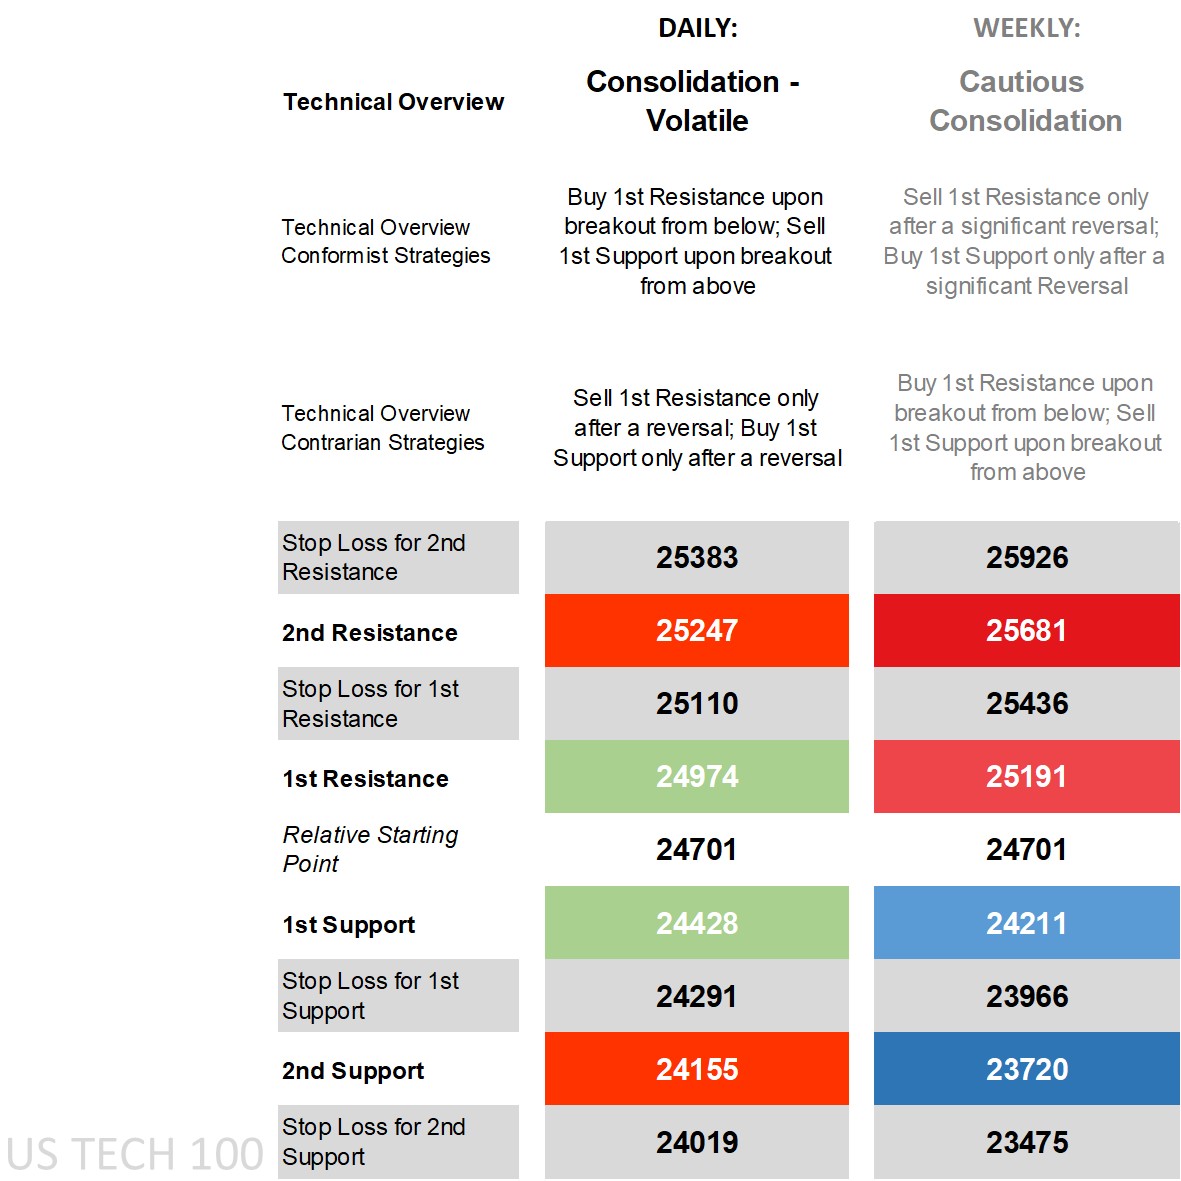
Nasdaq 100’s technical overview, strategies and levels
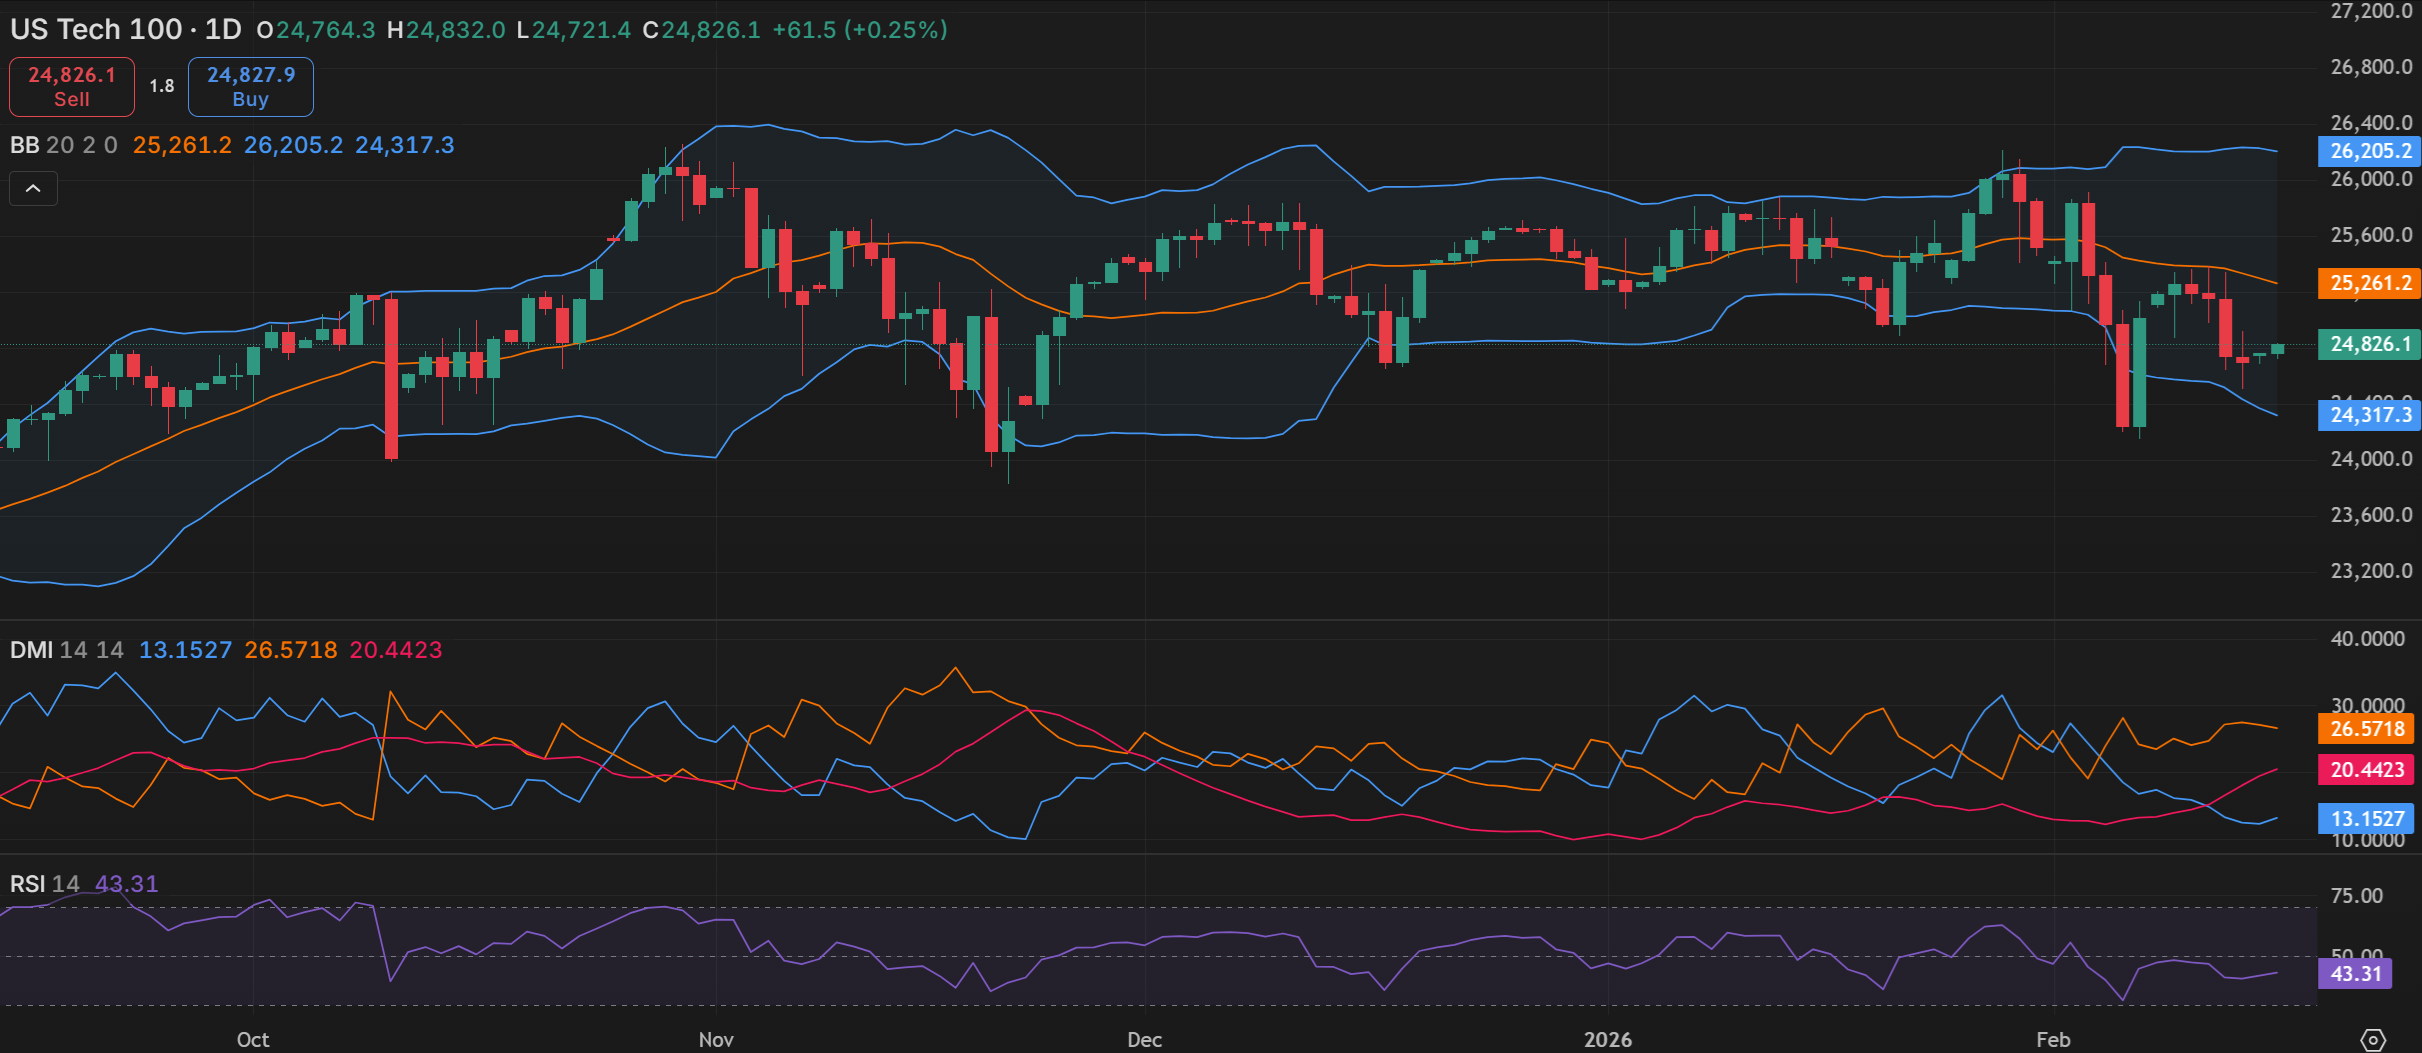
Looking at the daily time frame and price is below nearly all of its main moving averages (MA) with the 200-day MA not far off, at one point quite closer to the lower end of the Bollinger Band, on the DMI (Directional Movement Index) front the -DI over the +DI even to label it as negative, an RSI (Relative Strength Index) below 50 but yet to reach oversold territory, and an ADX (Average Directional Movement Index) in non-trending territory. The story is less clear on the longer-term weekly time frame with key indicators huddling close to each other and price due to what has been relatively rangebound action when zooming out.
The technical overview on the daily time frame better resembles ‘consolidation – volatile’, moving within larger intraday ranges but coming back to an average even if that average has been moving lower as of late. The uptick in intraday volatility has net given conformist breakout strategies (whether buying off the daily 1st Resistance or selling off the 1st Support) the edge in most sessions but at times requiring interday follow through to get enough to justify the trade, with the 2nd levels faring better in terms of seeing a bounce back towards either the 1st levels or the Relative Starting Point. Contrarians who see price settling here despite the ‘AI scare trade’ have reversal strategies to work with whether selling after a reversal off the 1st Resistance or buying off the 1st Support.
For the weekly time frame, the uptick in volatility on rotation and disruption fears have generally been contained within the longer-term intraweek levels, so while it has been formidable on the more exposed short-term daily levels, the weekly has had a better chance of holding. That doesn’t mean selling off the weekly 1st Resistance or buying off the 1st Support, rather doing so only after a significant reversal for those who expect the current overview to hold. A strong shift away from the average that has the capacity to significantly breach wider 1st levels with ease have contrarian breakout strategies (opposite the daily time frame). In other words, conformist in the current phase is going beyond intraday levels but going opposite the larger weekly levels via significant reversal, while contrarians on the daily go for a reversal but if stopped out and see a big move towards the weekly are going for breakouts on the wider weekly levels.
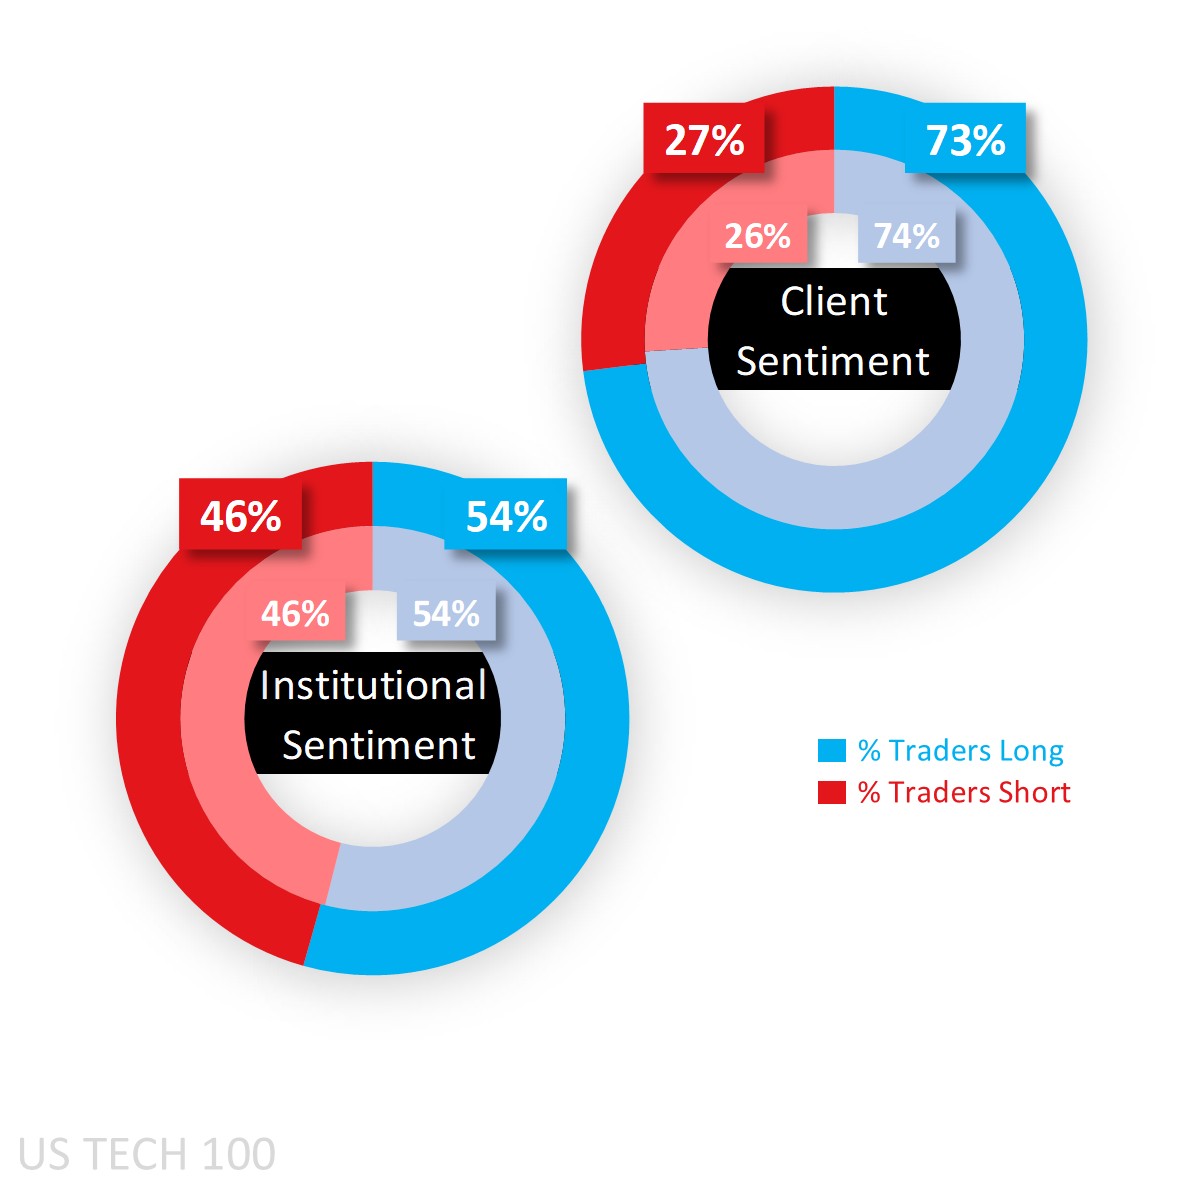
Capital.com’s client sentiment for Nasdaq 100
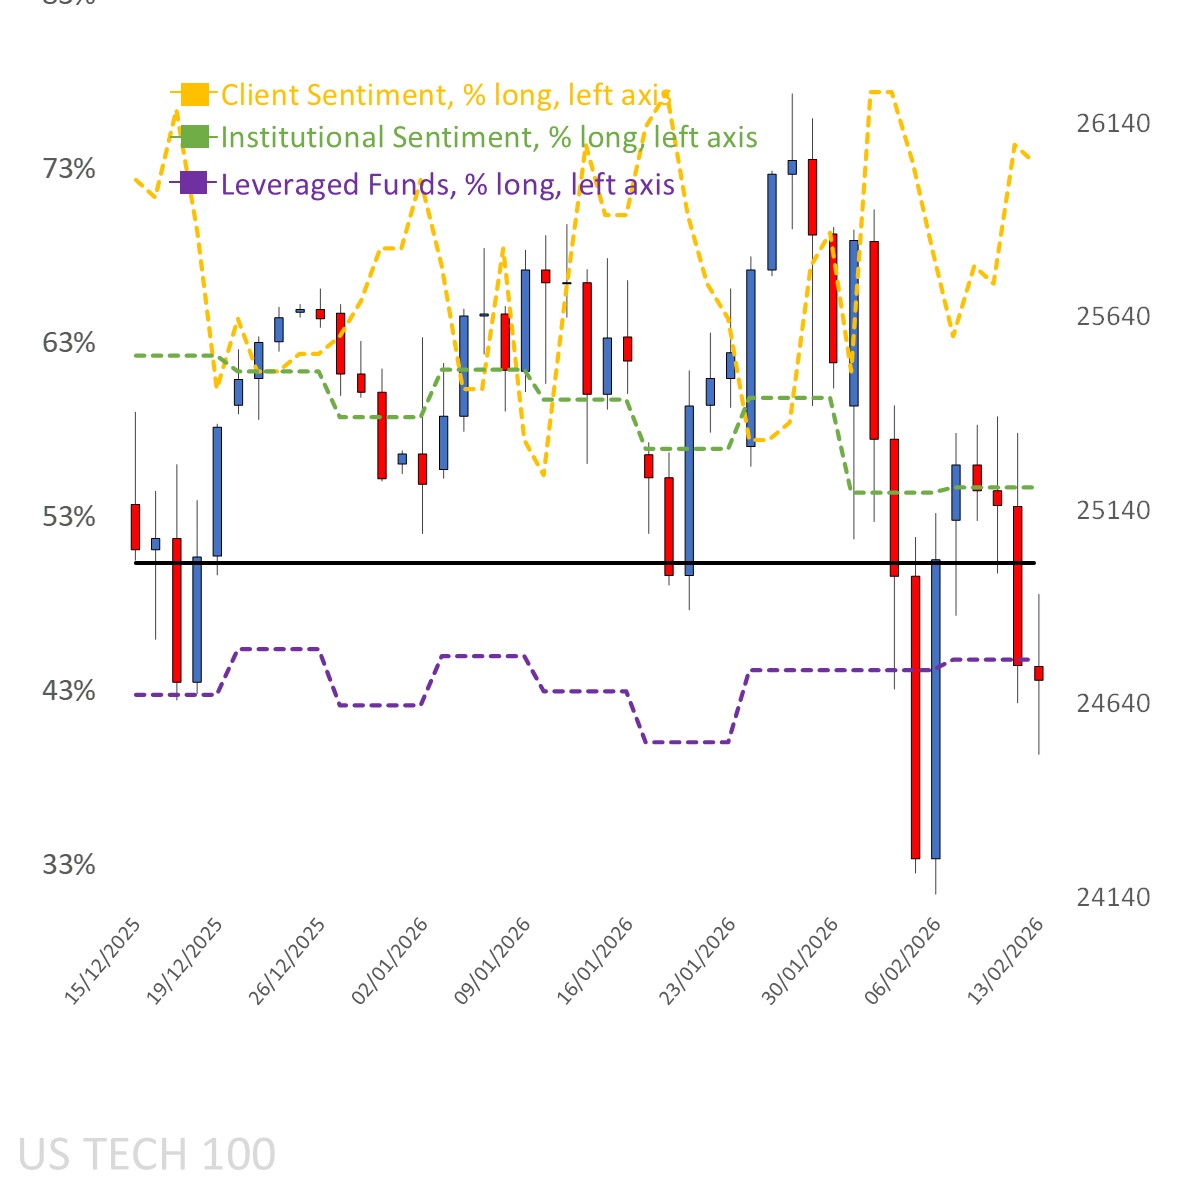
Client sentiment was and remains in heavy buy territory, with the weekly loss seeing fresh shorts close out again and some longs initiate, taking it from a heavy 68% last Monday to a heavier 73% at the start of this week (see below for client sentiment as a yellow-dotted line mapped onto the chart). And while it’s rare to see the bias reach extreme buy territory here as was the case in the S&P 500 and Russell 2000 last year, a part of it is due to a lack of a serious pullback over the past year.
When it comes to larger speculators according to the latest CoT (Commitment of Traders) report out of the CFTC, they haven’t budged from a net long 54% bias, with similar reductions (when viewed in percentage terms) in both longs (-2,796 lots) and shorts (-3,370). There wasn’t much movement in the Dow 30 and Russell 2000 both net long and moving higher to a slight buy 52%, while the S&P 500’s net sell bias was reduced a notch to 59%.
Client sentiment mapped on the daily chart
 Source: Capital.com
Period: December 2025 – February 2026
Past performance is not an indicator of future results.
Nasdaq 100’s chart on Capital.com’s platform with key technical indicators
Source: Capital.com
Period: September 2025 – February 2026
Past performance is not an indicator of future results.