
Intesa Sanpaolo stock forecast: Monte dei Paschi vote
Intesa Sanpaolo is an Italian banking group. On 10 September 2026, shareholders voted on its €35.7bn offer for Banca Monte dei Paschi di Siena. Explore third-party ISP price targets and technical analysis. Past performance is not a reliable indicator of future results.
Intesa Sanpaolo S.p.A. (ISP) traded near €6.71 as of 8:41am UTC on 10 September 2026, within an intraday range of €6.52–€6.71. Past performance is not a reliable indicator of future results.
Attention centred on Intesa's extraordinary shareholder meeting on 10 September, where investors voted by proxy on the bank's €35.7bn share-and-cash offer for Banca Monte dei Paschi di Siena (Reuters, 7 September 2026). Intesa expects the transaction to deliver 60% of its projected €2.9bn in gross financial benefits by 2028 and the full amount by 2029. The stock slipped 0.46% at Wednesday's close, while the FTSE MIB fell 0.58% (Ad-Hoc News, 9 September 2026). Intesa also bought 37.056m shares between 31 August and 4 September at an average price of €6.69 (Intesa Sanpaolo, 7 September 2026).
Third-party Intesa Sanpaolo outlook: MPS vote, takeover terms
As of 10 September 2026, third-party Intesa Sanpaolo stock predictions reflect different assumptions around the proposed Monte dei Paschi takeover, earnings and capital returns.
Oddo BHF
Oddo BHF reiterates an outperform rating and raises its target to €7.70 from €7.60. The revision reflects the analyst's view that Intesa remains well placed to progress the proposed acquisition (MarketScreener, 2 September 2026).
Santander
Santander raises its 12-month target to €7.70 from €6.60 and maintains an outperform rating. The revision comes amid political debate over a proposed Italian bank tax, which the broker weighs alongside Intesa's earnings outlook (Ad-Hoc News, 4 September 2026).
MarketScreener
MarketScreener shows an average 12-month target of €7.25 across 13 analysts, with estimates ranging from €6.07–€7.80 as of 9 September. The mean recommendation stands at buy (MarketScreener, 9 September 2026).
Yahoo Finance
Yahoo Finance shows an average 12-month target of €7.25, with estimates ranging from €6.07–€7.80. The spread reflects different assumptions around Intesa's outlook and the potential benefits and risks of the Monte dei Paschi deal (Yahoo Finance, 9 September 2026).
Investing.com
Investing.com reports an average 12-month target of €7.25, based on analyst estimates from the preceding three months. The poll comprises 10 buy, two hold and one sell recommendations (Investing.com, 9 September 2026).
Predictions and third-party forecasts are inherently uncertain, as they cannot fully account for unexpected market developments. Past performance is not a reliable indicator of future results.
Intesa Sanpaolo: latest and upcoming earnings
Intesa Sanpaolo reported second-quarter and first-half 2026 results on 29 July. H1 net income rose 6.5% year on year to €5.554bn from €5.216bn, according to the bank's consolidated results statement. Q2 net income reached €2.793bn, compared with €2.761bn in Q1, while operating income rose 3.1% quarter on quarter to €7.379bn. Quarterly net interest income reached €3.844bn, while H1 net fee and commission income rose 4.9% to €5.131bn.
Following the results, the Board of Directors said it would discuss an interim cash dividend of around €3.8bn on 30 October, when it is also scheduled to approve results for the nine months to 30 September. Management also raised full-year net income guidance to above €10bn (Intesa Sanpaolo, 30 July 2026).
Intesa's next scheduled results release is 30 October 2026. Past or simulated performance is not a reliable indicator of future results. Company guidance reflects management's assumptions and may not materialise as expected.
ISP stock price: technical overview
As of 8:41am UTC on 10 September 2026, the ISP stock price trades near €6.71, below its 20-day simple moving average near €6.77 but above its 50-, 100- and 200-day averages at approximately €6.60, €6.21 and €5.94 respectively, according to TradingView. The 20-day exponential moving average sits slightly higher at €6.73.
The 14-day relative strength index (RSI) stands near 50.2, within neutral territory, while the average directional index (ADX) at 22.2 indicates limited trend strength.
Higher technical references include the classic pivot near €6.77, R1 around €6.96 and R2 near €7.13. Below the latest price, the 50-day moving average and classic S1 both sit around €6.60. The Hull moving average (9) is near €6.68, while the Ichimoku base line sits around €6.73.
A move higher could bring €6.77 and €6.96 into focus, while a decline could shift attention towards €6.60 (TradingView, 10 September 2026).
This is technical analysis for informational purposes only and does not constitute investment advice or a recommendation to buy or sell any instrument.
Intesa Sanpaolo share price history (2024–2026)
ISP’s stock price has moved substantially over the past two years. The stock closed at €3.71 on 11 September 2024 before falling to €3.69 intraday on 7 April 2025 during a wider European banking sell-off linked to US tariff announcements.
The shares subsequently recovered, ending 2025 at €5.95 before continuing higher into 2026 during a period of rising profits and developments around the proposed Monte dei Paschi takeover.
As of 8:41am UTC on 10 September 2026, ISP traded near €6.71, around 12.6% higher year to date and approximately 23.1% higher year on year. It was also around 82% above its April 2025 intraday low, although the period included moves in both directions.
Past performance is not a reliable indicator of future results. Share prices are indicative and may differ from live market prices.
Intesa Sanpaolo (ISP): Capital.com analyst view
Intesa Sanpaolo's share price has moved broadly higher over the past two years, during a period of higher profitability, raised 2026 net income guidance and continued share buybacks. The proposed Monte dei Paschi takeover adds another variable to the outlook.
Expected financial benefits or smooth integration could support earnings expectations and sentiment, while regulatory hurdles, integration costs or weaker-than-expected benefits could weigh on the shares. Interest rates and the wider economy also remain relevant: conditions that support margins, lending or fee income could help, while weaker activity, margin pressure or additional bank taxation could work in the opposite direction.
Capital.com’s client sentiment for Intesa Sanpaolo CFDs
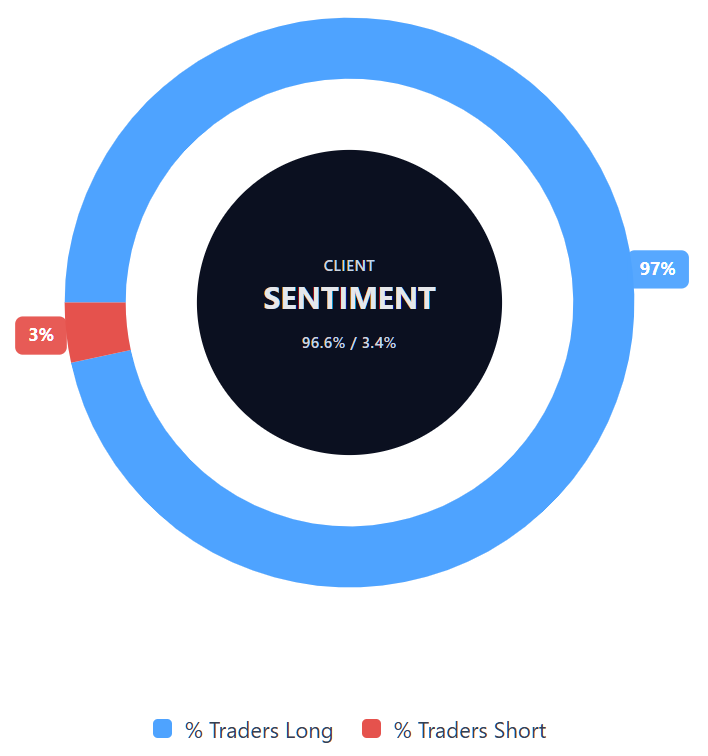
As of 10 September 2026, Capital.com client positioning in Intesa Sanpaolo CFDs is weighted towards long positions, with 96.6% long and 3.4% short. This reflects open positions on Capital.com at the time of measurement rather than future price direction and can change.
Summary – Intesa Sanpaolo 2026
- As of 8:41am UTC on 10 September 2026, Intesa Sanpaolo traded near €6.71, within an intraday range of €6.52–€6.71.
- According to TradingView data, the price was below its 20-day moving average but above its 50-, 100- and 200-day averages, while RSI stood near 50 and ADX below 25.
- Key factors include the proposed Monte dei Paschi takeover, H1 earnings, the ongoing share buyback and debate over Italian bank taxation.
- Stronger earnings, capital returns or successful deal execution could support sentiment, while integration risks, weaker earnings or regulatory changes could weigh on the shares.
- Recent attention centres on the 10 September shareholder meeting, broker target revisions and continued buyback activity.
Past performance is not a reliable indicator of future results.
FAQ
Who owns the most Intesa Sanpaolo stock?
What is the five-year Intesa Sanpaolo share price forecast?
Is Intesa Sanpaolo a good stock to buy?
Could Intesa Sanpaolo stock go up or down?
Should I invest in Intesa Sanpaolo stock?
Can I trade Intesa Sanpaolo CFDs on Capital.com?
Yes, you can trade Intesa Sanpaolo CFDs on Capital.com. Trading share CFDs lets you speculate on price movements without owning the underlying asset and to take long or short positions. However, contracts for difference (CFDs) are traded on margin, and leverage amplifies both profits and losses. You should ensure you understand how CFD trading works, assess your risk tolerance, and recognise that losses can occur quickly.