
Interpump stock forecast: Third-party price targets
Interpump Group is an Italian-listed industrial manufacturer focused on hydraulics and water-jetting systems. Explore IP price action, third-party price targets, and technical analysis.
Interpump Group S.p.A. (IP) is trading around €46.19 in late-morning European dealing on 20 January 2026, moving within an intraday range of €45.93–€46.91 on Capital.com’s platform as of 11:07am (UTC). Past performance is not a reliable indicator of future results.
Trading in Interpump Group is taking place amid a weaker session for Italy’s equity market, with the country’s main stock index contract for difference falling by more than 1% on 19 January 2026, as losses in industrial and utility constituents weighed on the benchmark (Reuters, 20 January 2026). The shares are trading against a backdrop of ongoing analysis of the group’s balance sheet and cash-flow profile, with third-party research highlighting its mix of liabilities and free cash-flow generation in early January 2026 (Simply Wall St, 10 January 2026).
Interpump stock forecast 2026–2030: Third-party price targets
As of 20 January 2026, third-party Interpump stock predictions suggest a 12-month range broadly spanning the low-€40s to low-€50s per share for IP.MI, based on multi-source consensus and broker snapshots captured between December 2025 and January 2026. These targets are indicative forward-looking estimates rather than guaranteed outcomes, and are revised as analysts update assumptions on earnings, sector conditions and macro-economic indicators.
Across providers, the common thread is a focus on earnings visibility, valuation multiples and broader industrial-cycle dynamics, rather than short-term price movements.
MarketScreener (multi-broker consensus)
MarketScreener’s consensus page for Interpump Group shows an average 12-month target price of about €44.63, with individual broker estimates ranging roughly from €39.50 to €49 and a mean ‘outperform’ stance based on seven analysts. The service notes this range as analysts weigh Interpump’s industrial-machinery exposure and earnings track record against shifts in European capital-goods valuations and Italian equity-market conditions (MarketScreener, 16 January 2026).
Investing.com (analyst projections)
Investing.com’s IP stock forecast consensus section reports an average 12-month target around €43.51, with a high estimate near €50 and a low close to €40, derived from projections by eight analysts over the preceding three months. The platform indicates that this spread reflects differing views on revenue growth and margin resilience as industrial demand, funding costs and broader equity-market risk appetite evolve (Investing.com, 15 January 2026).
ValueInvesting.io (consensus model)
ValueInvesting.io’s estimates page for IP presents an average 12-month price target of €44.89, with a low forecast of €40.40 and a high of €52.50, based on ratings from 17 analysts. The service highlights that these targets sit alongside a ‘buy’ consensus recommendation, while also flagging that upside and downside paths depend on assumptions around Interpump’s revenue trajectory, profitability and valuation relative to peers (ValueInvesting.io, 10 January 2026).
Predictions and third-party forecasts are inherently uncertain, as they cannot fully account for unexpected market developments. Past performance is not a reliable indicator of future results.
IP stock price: Technical overview
The IP stock price is trading around €46.19 as of 11:07am (UTC) on 20 January 2026, sitting just below a short-term moving-average cluster, with the 20-, 50-, 100- and 200-day simple moving averages near approximately €47, €45, €43 and €39 respectively. The 14-day RSI is around 48, indicating mid-range momentum, while an ADX near 14 points to a weak, non-directional trend backdrop.
On the topside, the nearest classic pivot above the market sits at R1 around €48.25, and a daily close above that area could bring R2 near €49.71 into focus. On pullbacks, initial support is defined by the classic pivot around €45.73, with the 100-day SMA near €42.88 acting as a deeper moving-average reference; a sustained move below this zone could increase the risk of a move towards S1 around €44.27 (TradingView, 20 January 2026).
This technical overview is provided for informational purposes only and does not constitute financial advice or a recommendation to buy or sell any instrument.
Interpump share price history (2024–2026)
IP’s stock price has spent the past two years moving through distinct phases, with the tone shifting from a steady mid-€40s range in early 2024 to a stronger profile through parts of 2025 and into January 2026. The stock was trading around €45–€46 in the first quarter of 2024, then dipped into the high-€20s by mid-April 2025 before recovering, closing at €35.50 on 30 June 2025 and pushing back above €40 by late September 2025. By the end of 2025, IP was changing hands near €46–€47, and as of 20 January 2026 it closed at €46.19 – roughly 4.4% above its €44.25 finish on 20 January 2025 and well above the April 2025 lows, reflecting a notable rebound over the period.
Past performance is not a reliable indicator of future results. Share prices are indicative and may differ from live market prices.
Interpump (IP): Capital.com analyst view
Interpump Group’s share price has climbed over the past two years, moving from the low-€40s in early 2024 to trade around €46 in January 2026, following a brief but sharp dip into the high-€20s in April 2025 and a recovery through the second half of last year. That recovery has coincided with continued revenue generation and a focus on cash flow highlighted in the group’s reporting, although periods of volatility in Italian and broader European equities mean the price has not moved in a straight line and has experienced phases of consolidation and pullbacks as conditions shifted.
From a thematic perspective, Interpump’s mix of hydraulics and water-jetting businesses provides exposure to industrial demand across multiple end-markets, which can support interest when capital expenditure and infrastructure activity are firm. At the same time, this exposure leaves the shares sensitive to potential slowdowns in manufacturing, tighter financing conditions or project delays.
Capital.com’s client sentiment for Interpump CFDs
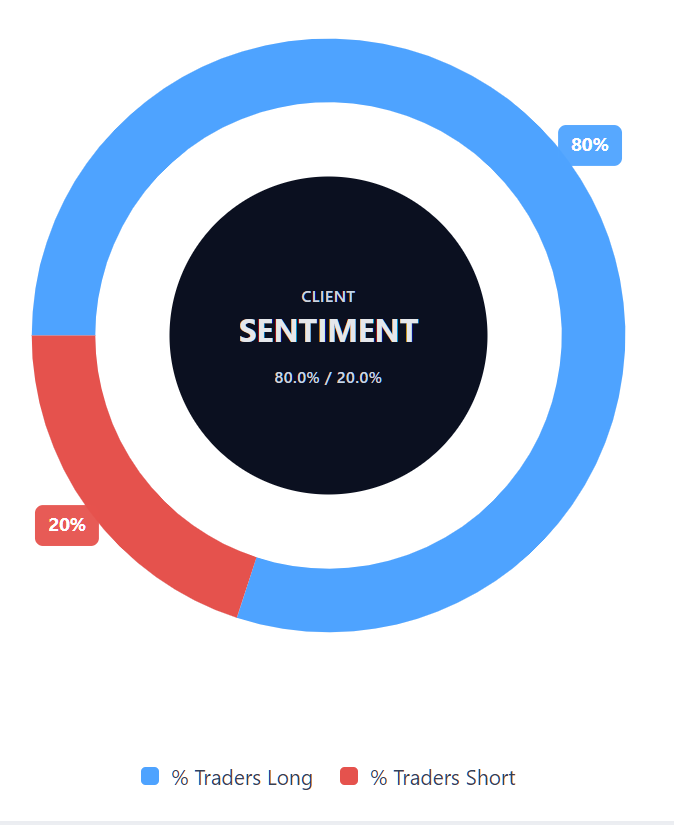
As of 20 January 2026, Capital.com client positioning in Interpump Group CFDs is skewed to the upside, with 80% buyers versus 20% sellers, placing it in heavy-buy territory and leaving buyers ahead by 60 percentage points. This snapshot reflects open positions on Capital.com at the time of observation and can change as traders adjust their exposure.
Summary – Interpump 2026
- Interpump Group’s share price moved from the low-€40s in early 2024 to recover from an April 2025 dip into the high-€20s, closing June 2025 around €35.50 before pushing back above €40 by late September 2025.
- By December 2025, the stock was trading near €46–€47, and as of 20 January 2026 it closed at €46.19, modestly above its €44.25 level on 20 January 2025 over the same calendar window.
- Technical indicators show the price sitting just under short-term moving averages clustered around €47, with a 14-day RSI near 48 and ADX around 14, suggesting mid-range momentum alongside a weak directional trend.
- Interpump’s hydraulics and water-jetting operations provide diversified industrial exposure and have supported revenue and cash-flow generation, while also leaving the share price responsive to changes in manufacturing cycles, capital-expenditure trends and broader equity-market volatility.
Past performance is not a reliable indicator of future results.