Trading Gold as it Breaches $5,000
Technical overview remains very much volatile for the precious metal as it seemingly goes parabolic, and traders both large (CoT) and small (retail) remain majority buy.
It’s a gold morning as the precious metal breaks through the historic and noteworthy $5,000 level for the very first time, gapping higher and intraday wasn’t too far off $5.1K at one point. Investors have been flocking to safety, price targets for the end of this year have been raised from a few key financial institutions, trust is in doubt on the geopolitical scene even between allies, tensions are failing to subside, and on the trade front a fresh tariff threat was revealed, this time against Canada at 100% for its imports into the U.S. over a possible deal with China. Add to it the potential intervention on the FX front to aid the yen sending the U.S. Dollar Index into the 96s for the first time since September, and those priced against the dollar are generally having a strong start to the week.
Safe haven is also in demand given the risk-off moves in the financial markets, with U.S. equity index futures in retreat as investors position for a pivotal week that include the anticipated FOMC (Federal Open Market Committee) hold and a heavy slate of corporate earnings (see Week ahead below). It follows a second consecutive losing week for stocks where the S&P 500 (w/w -0.7% to 6,915), Nasdaq 100 (w/w -0.4% to 25,605), and Dow 30 (w/w -0.7% to 49,098) all posted modest weekly declines. Treasury yields edged lower across most of the curve last Friday, and market pricing (CME’s FedWatch) remains near fully pricing a hold in this week’s FOMC meeting and holding until July before starting what could be three rate cuts this year.
Economic data was mostly about improvement with preliminary manufacturing PMI (Purchasing Managers’ Index) for January up a notch to 51.9 while the more important services print held at 52.5 missing forecasts, and University of Michigan’s revised figures for consumer sentiment rising to 56.4 from 54 and inflation expectations easing (to 4% from 4.2% for the 1Y, and to 3.3% for the 5Y) with the latter a plus for the central bank.
Week ahead
We’ll get durables today, both housing price data and CB’s (Conference Board) consumer confidence tomorrow, the FOMC policy announcement (where a hold is expected) on Wednesday, the weekly unemployment claims on Thursday, and PPI (Producer Price Index) prints on Friday. In earnings, there will be plenty on offer and from some heavyweights with UnitedHealth, Boeing and a couple defensive giants tomorrow, Microsoft, Meta and Tesla on Wednesday, Apple and both Visa and Mastercard on Thursday, and energy giants in focus on Friday with both Exxon Mobil and Chevron releasing their quarterly figures. Those trading FX and gold priced in dollars will note any further updates on President Trump’s pick for the next Fed chair, and let’s not forget the government shutdown deadline nearing with likelihoods rising a deal won’t be reached.
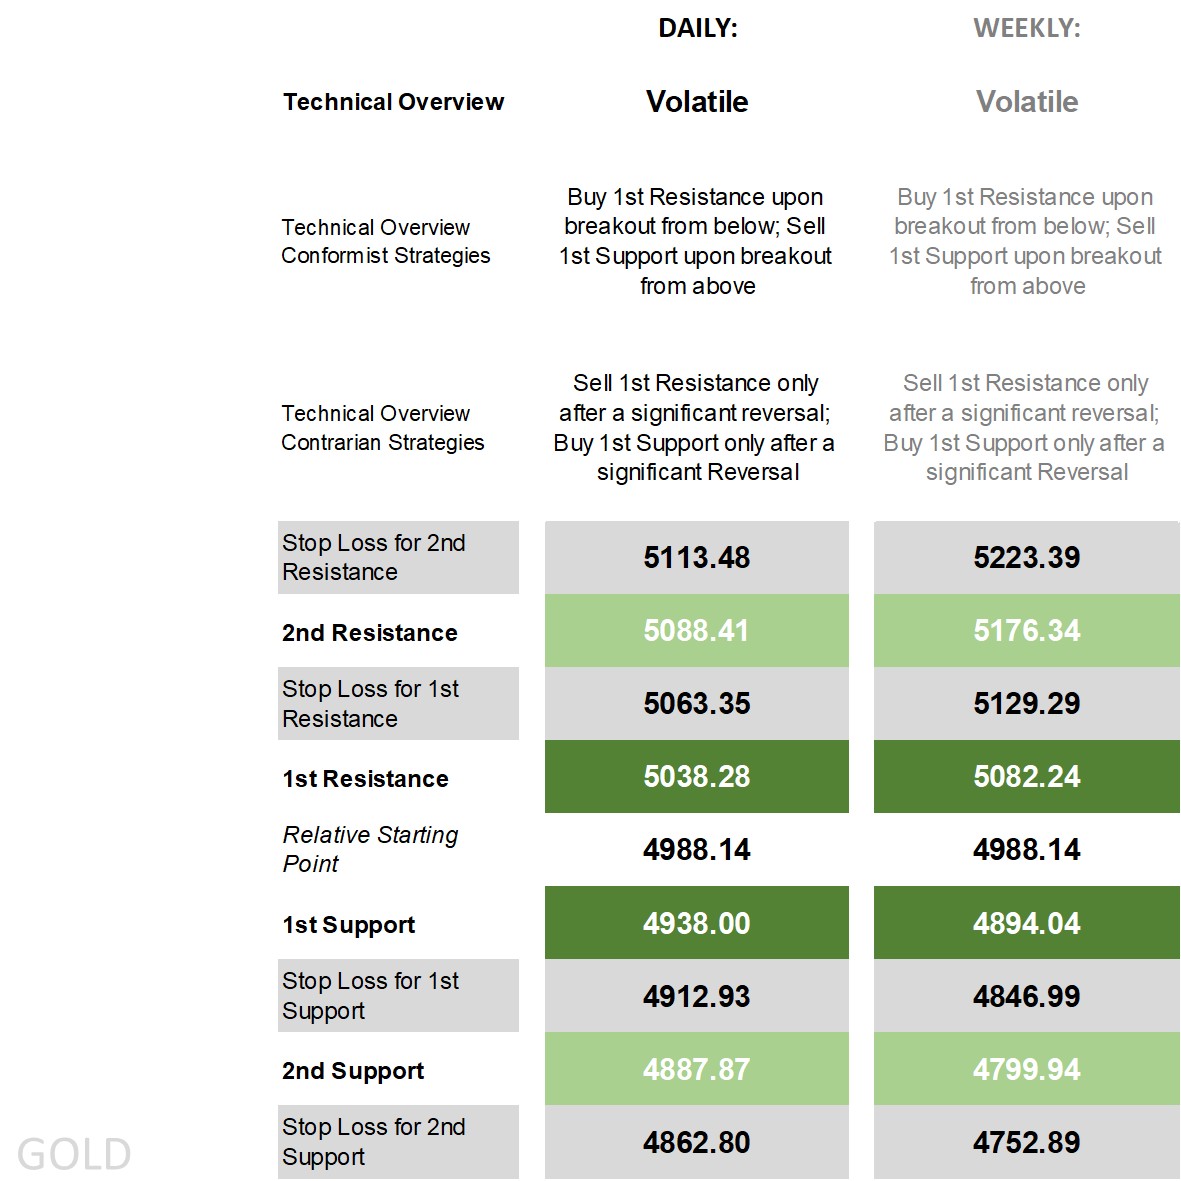
Gold’s technical overview, strategies and levels
Looking at the daily time frame and a record high means price is above all its main moving averages (MA), on the DMI (Directional Movement Index) front the +DI well over the -DI easily labelling it as positive, an RSI (Relative Strength Index) at 87 screaming in overbought territory, and an ADX (Average Directional Movement Index) easily seen as ‘trending’. That usually means a bullish technical overview, but the uptick in volatility and its ascent to record highs in what has several times been a headline-driven environment means it’s more ‘volatile’ than bullish.
Those in the conformist camp who see this volatility persisting have breakout strategies be it with a buy-breakout off the 1st Resistance or a sell-breakout off the 1st Support, with price already reaching today’s 2nd Resistance level due to the gap higher and early climb. Contrarians who see volatility dying down can go opposite but only after a significant reversal to avoid getting stopped out on the first move beyond any key level (as it occurred this morning when it went beyond the 1st Resistance and its S/L level), waiting for it to move beyond it significantly and only if it returns to initiate opposite in a studied manner.
The weekly time frame’s technical overview also remains ‘volatile’ as although the early move to the weekly 1st Resistance level failed to offer much follow-through, the technicals also point to volatility and where conformist strategies thus far have net outperformed against contrarian reversals.
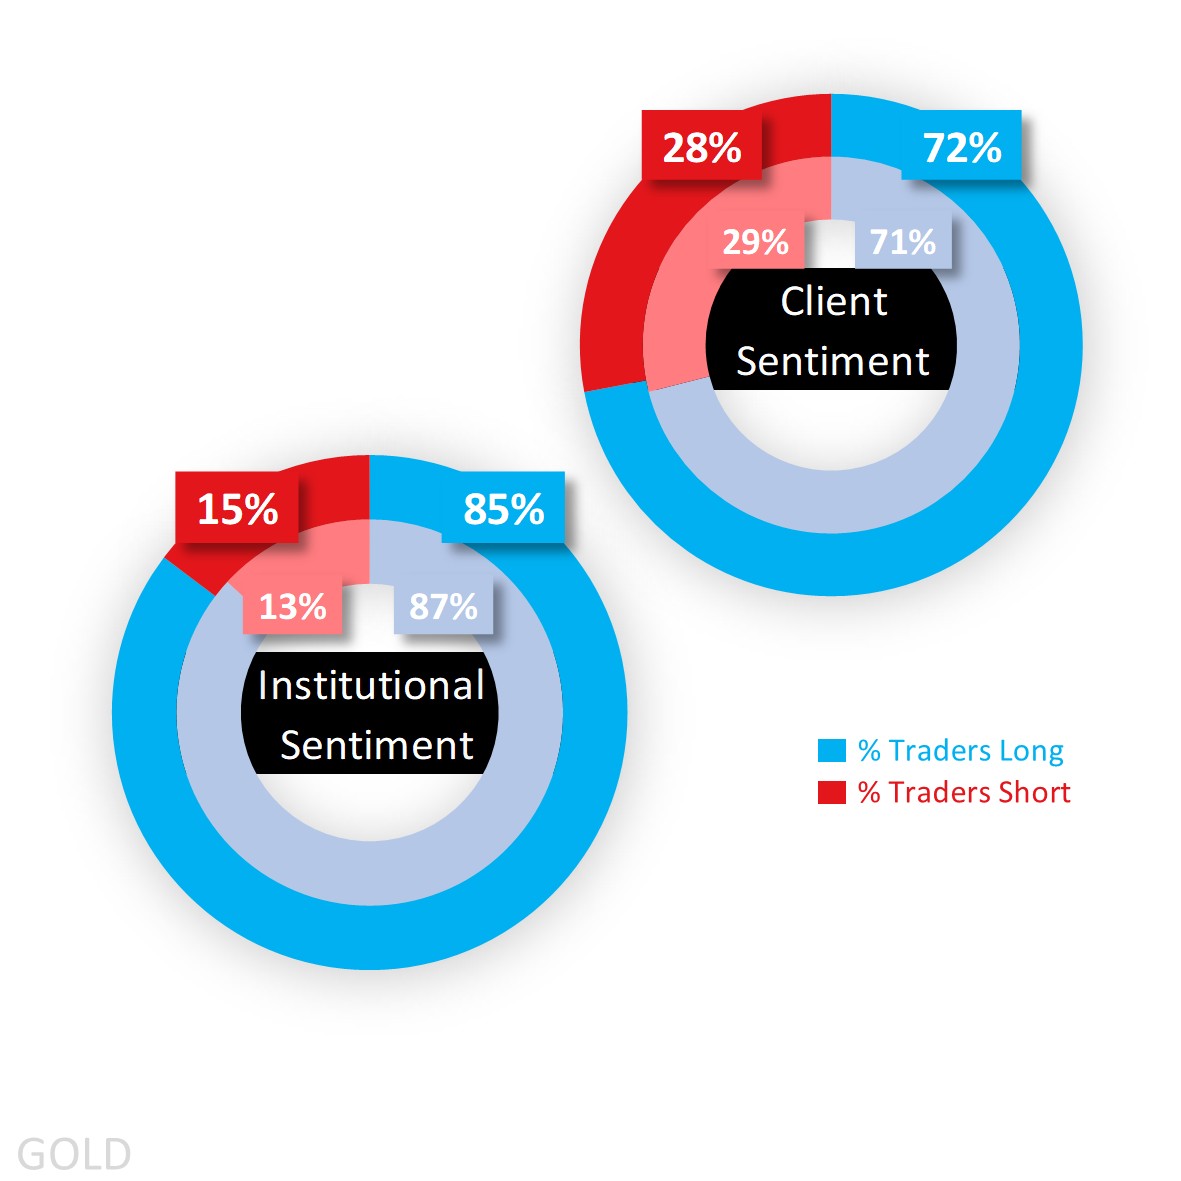
Capital.com’s client sentiment for Gold
It remains a story of majority buy sentiment among traders, and clients started off this week at a heavy long 72% before latching onto the early price gains taking it as high as 78% following the move to a fresh record high, in all a story of fresh longs entering, closing out, and then looking to re-enter again.
CoT (Commitment of Traders) speculators are still in extreme buy territory holding a bias larger than that of retail traders, but they’ve been pulling back a bit reducing it from 87% to 85% according to the latest report out of the CFTC on a reduction in longs (by 411 lots) and a simultaneous increase in shorts (by 6,057). They’re already net long silver and have reduced their exposure to 71% from 76%, there too long positions dropping (by 4,372 lots) and shorts increasing (by 2,474).
Client sentiment mapped on the daily chart
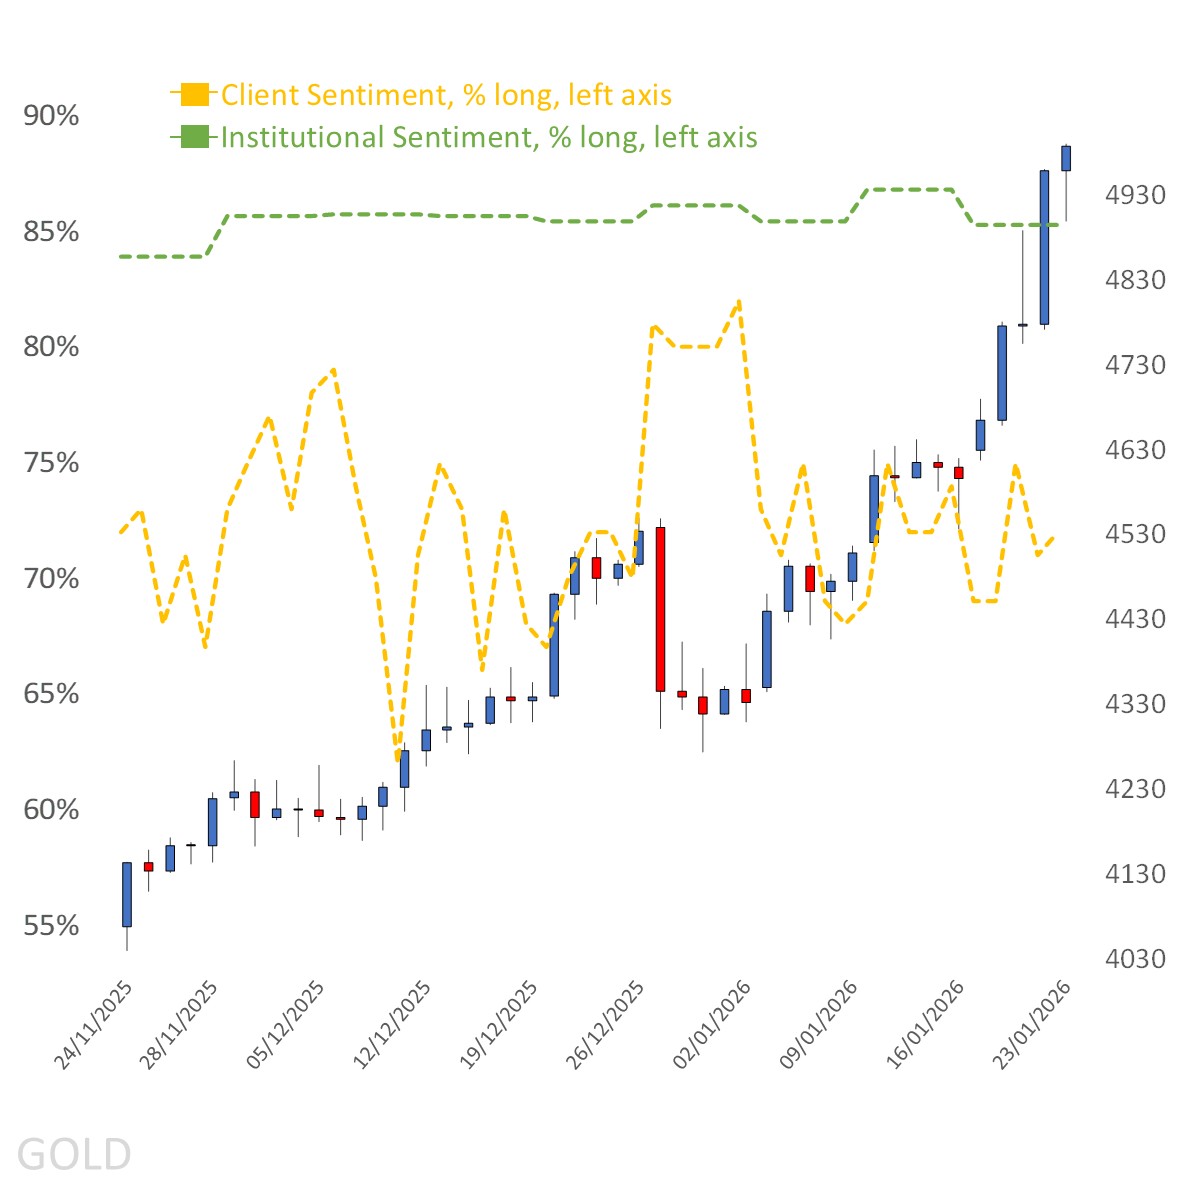 Source: Capital.com
Period: NOVEMBER 2025 – JANUARY 2026
Past performance is not an indicator of future results.
Gold’s chart on Capital.com’s platform with key technical indicators
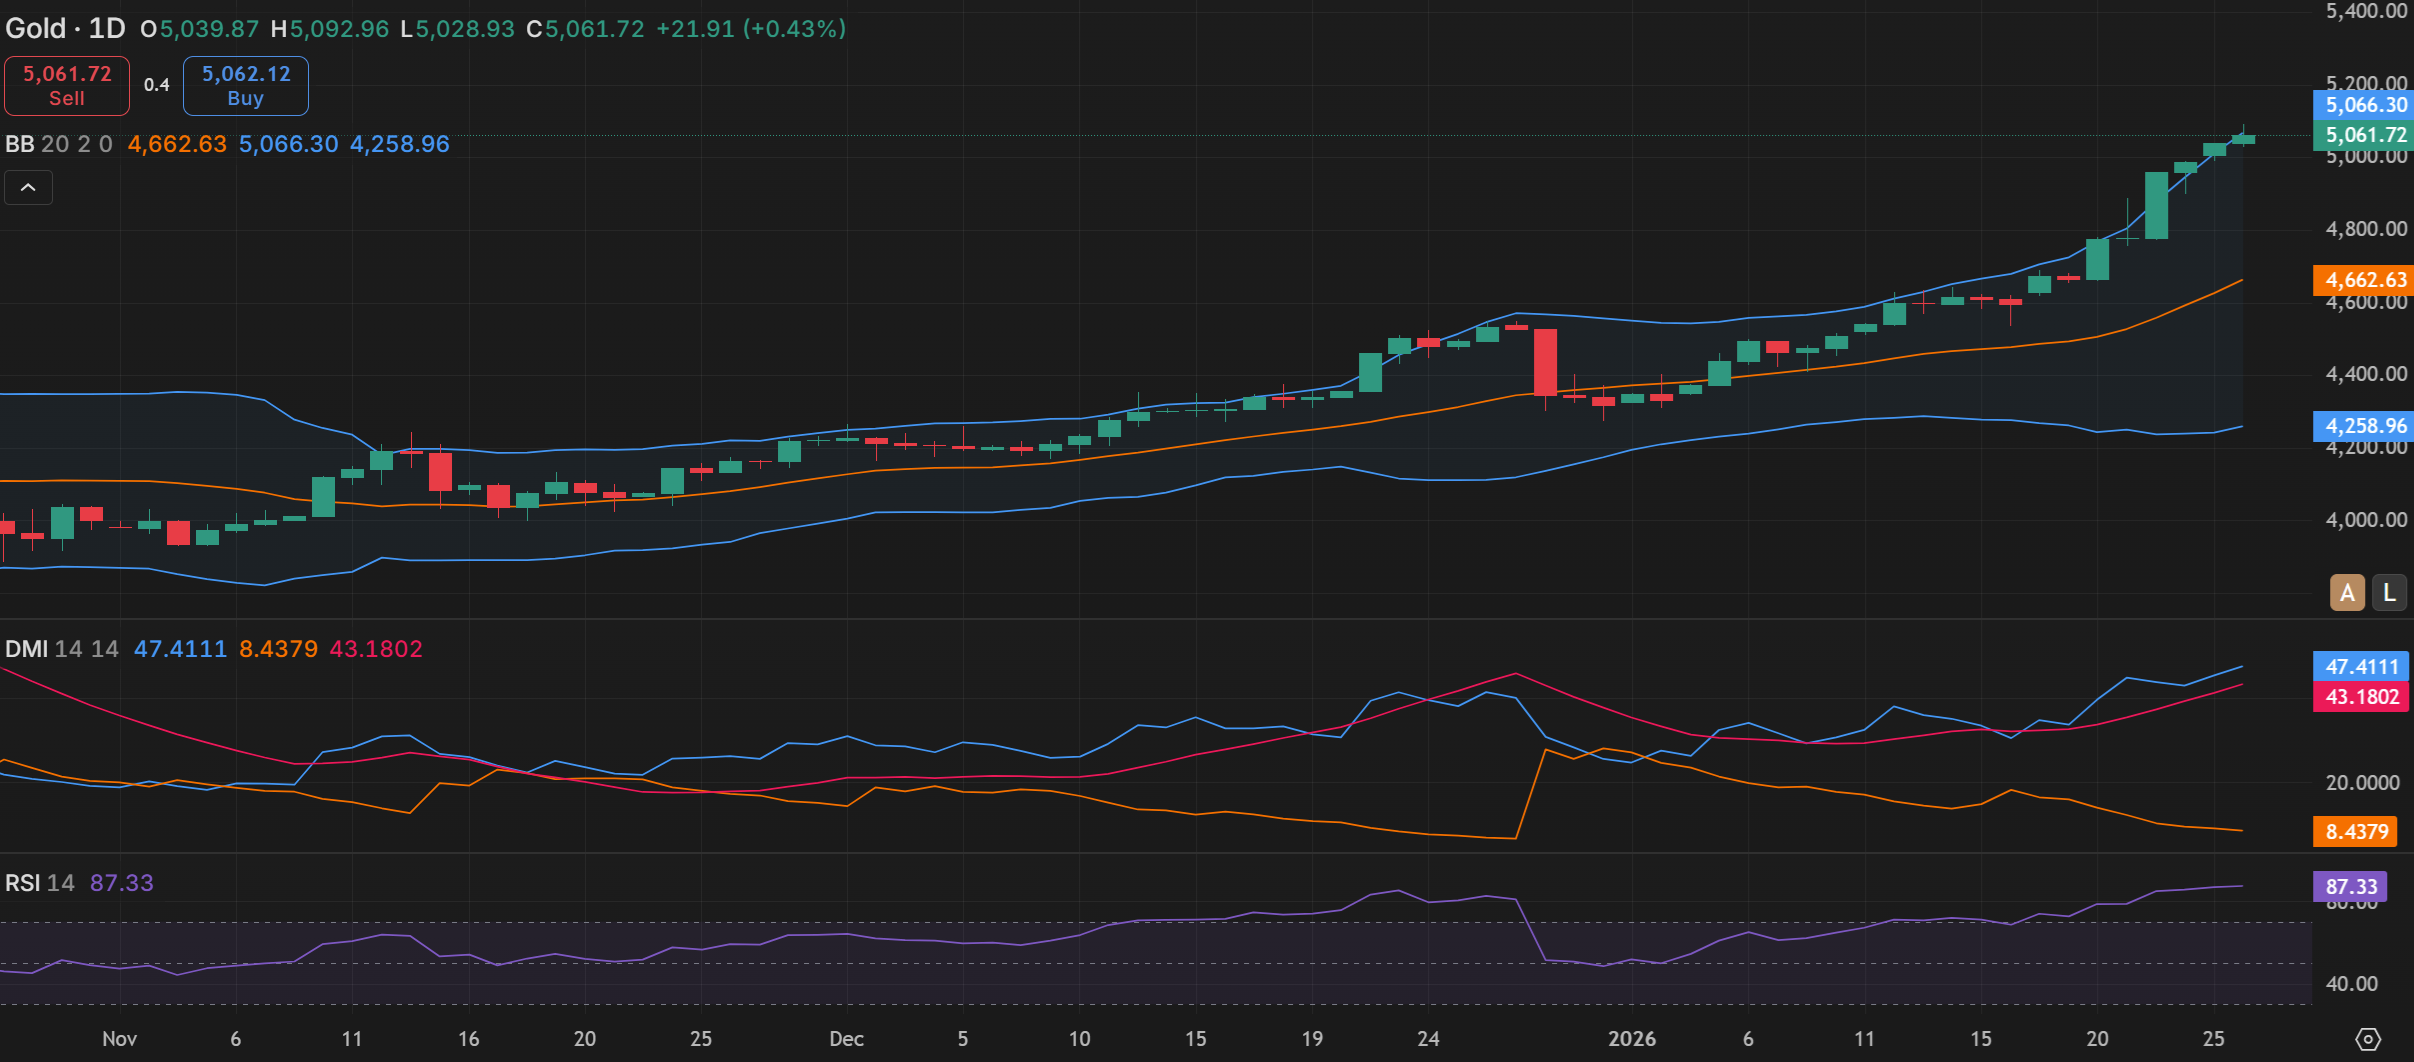
Source: Capital.com
Period: OCTOBER 2025 – JANUARY 2026
Past performance is not an indicator of future results.