Crude oil price forecast: Strait of Hormuz closure
WTI and Brent are trading higher as the Strait of Hormuz remains closed, a route for ~20% of global oil demand, even as OPEC+ plans to add 206,000 bpd from April 2026. Past performance is not a reliable indicator of future results. Explore third-party crude oil price targets and technical analysis.
As of 1.34pm UTC on 5 March 2026, US Crude Oil (US Crude) is trading at $76.29 per barrel, within an intraday range of $73.33–$76.95. Brent Crude Oil (Brent Crude) is at $82.31 per barrel, having traded between $80.07 and $83.69 during the session. Past performance is not a reliable indicator of future results.
Prices are being supported by the ongoing closure of the Strait of Hormuz, through which approximately 20% of global oil demand typically transits (Reuters, 2 March 2026). This follows US-Israeli military strikes on Iran and Iran’s subsequent threat to target any vessel attempting to use the waterway. CNBC reported that WTI reached around $76.31 and Brent approximately $83.39 on 3 March, broadly in line with current session levels (CNBC, 3 March 2026). A countervailing supply factor emerged on 1 March 2026, when eight OPEC+ members, led by Saudi Arabia and Russia, agreed to add 206,000 barrels per day to output from April 2026, exceeding earlier estimates of 137,000 bpd (World Oil, 1 March 2026). Goldman Sachs estimated an $18-per-barrel real-time geopolitical risk premium embedded in current prices (Longbridge, 1 March 2026). The US Energy Information Administration (EIA) had separately noted a larger-than-expected build in crude inventories to a nine-month high in its most recent weekly report, which may have provided some offset to the supply-disruption premium (EIA, 10 February 2026).
Crude oil price forecast 2026-2030: Analyst price target view
As of 5 March 2026, third-party crude oil predictions have been revised upward on Strait of Hormuz disruptions, while longer-horizon full-year outlooks remain anchored to a structural supply-surplus view. The six targets below are drawn from forecasts published in late February and early March 2026, ordered from lowest to highest near-term target, split between the two benchmarks.
EIA (STEO – full-year Brent baseline)
The US Energy Information Administration projects Brent crude spot prices to average $57.69 per barrel in 2026, with a quarterly breakdown placing Q1 at $64.44, Q2 at $57.32, Q3 at $55.35, and Q4 at $54. The agency attributes the year-on-year decline from a 2025 average of $69.04 to global liquid-fuel supply outpacing demand, with markets also reflecting elevated uncertainty around US policy action toward Iran (EIA, 10 February 2026).
Goldman Sachs (revision – Q4 WTI and Brent targets)
Goldman Sachs lifts its Q4 2026 Brent forecast by $6 to $60 per barrel and raises its Q4 WTI estimate by $6 to $56 per barrel, citing lower-than-expected OECD inventory levels as the primary driver of the upward revision. The bank maintains its full-year 2026 surplus projection of 2.3 million barrels per day, assuming no major supply disruption and no Russia-Ukraine peace deal (OilPrice.com, 23 February 2026).
Reuters analyst poll (February 2026 – Brent consensus average)
Reuters’ February 2026 survey of 34 economists and analysts places the full-year 2026 Brent average at $63.85 per barrel, up from $62.02 in January’s poll of 31 respondents, with the corresponding WTI consensus at $60.38 per barrel. Analysts cite a geopolitical risk premium of $4–$10 per barrel already embedded in prices amid uncertainty over how the US-Iran standoff will resolve (OilPrice.com, 27 February 2026).
J.P. Morgan (revision – full-year Brent view)
J.P. Morgan Global Research maintains that Brent crude will average roughly $60 per barrel in 2026, keeping its long-term Brent deck at approximately $63. It also notes that without aggressive OPEC+ action, Brent could spend stretches below $60 as a surplus approaching 3 million barrels per day builds through 2026–27. The bank had trimmed its 2025 Brent estimate to approximately $66 per barrel earlier this year, consistent with a 'lower for longer, but jumpy' framework for 2026 (TheStreet, 2 March 2026).
Standard Chartered (revision – quarterly Brent targets)
Standard Chartered raises its Q1 2026 Brent forecast to $74 per barrel from $62, lifts its Q2 estimate to $67 from $63, and increases its full-year 2026 Brent average to $70 from $63.50. It flags asymmetric upside risk if the Middle East conflict escalates and impairs Iranian or other regional production. The bank cites spare capacity constraints and the concentration of key transit routes as the central factors driving the revision above the broader bank consensus (Global Banking & Finance, 3 March 2026).
Goldman Sachs (revision – Q2 WTI and Brent targets)
Goldman Sachs raises its Q2 2026 Brent forecast by $10 to $76 per barrel and its Q2 WTI estimate by $9 to $71 per barrel, based on the expectation that reduced Hormuz shipments will produce significant OECD inventory draws and a contraction in Middle Eastern production during March. The bank revises its Q4 2026 Brent and WTI forecasts to $66 and $62 per barrel respectively, noting that a faster-than-expected normalisation of Hormuz flows represents the primary downside risk to the near-term upgrade (Reuters, 4 March 2026).
Predictions and third-party forecasts are inherently uncertain, as they cannot fully account for unexpected market developments. Past performance is not a reliable indicator of future results.
Crude oil prices: Technical overview
US Crude Oil (WTI)
US Crude’s price trades at $76.29 as of 1.34pm UTC on 5 March 2026, holding well above its key moving-average cluster, with the 20/50/100/200-day SMAs stacked at roughly $67 / $63 / $61 / $63. The 20-over-50 alignment remains intact across both SMA and EMA families, keeping the near-term trend positive. The 14-day RSI sits at 80.01, firmly in stretched territory, while the ADX at 36.18 confirms an established trend with meaningful directional conviction behind the recent advance.
The first topside reference is the classic R1 pivot at $69.53, already cleared given current price, placing R2 at $72.03 in view. Above there, R3 at $78.74 represents the next material level, and a daily close above the intraday high of $76.95 would leave it in range. On pullbacks, the classic pivot at $65.32 offers initial support, with the 100-day SMA near $60.80 and the 200-day SMA near $62.79 forming a broader MA shelf below that. A slip beneath the $62–$63 zone would risk a deeper fade toward S1 at $62.82 (TradingView, 5 March 2026).
Brent Crude Oil
Brent Crude’s price trades at $82.31 as of 1.34pm UTC on 5 March 2026, positioned above a tightly aligned moving-average cluster with the 20/50/100/200-day SMAs at approximately $72 / $67 / $65 / $66. The 20-over-50 alignment holds across both MA families, consistent with a positive near-term trend structure. The 14-day RSI reads 81.14, in stretched territory, while the ADX at 40.48 signals a firmly established trend with strong directional momentum underpinning the move.
With R1 and R2 at $75.88 and $78.88 both cleared, R3 at $87.23 is the next material classic pivot reference above current price. A sustained hold above the $82 figure keeps that level in scope, while a daily close below the intraday session low of $80.07 would re-expose the R1–R2 area as near-term support. To the downside, the classic pivot at $70.53 offers the first meaningful floor, backed by the 100-day SMA near $65.12 and the 200-day SMA near $66.48 as the broader MA shelf. Losing that cluster would risk a move toward S1 at $67.53.
This is technical analysis for informational purposes only and does not constitute financial advice or a recommendation to buy or sell any instrument (TradingView, 5 March 2026).
Crude oil price history (2024–2026)
US Crude Oil (WTI)
US Crude opened 2024 in the mid-$70s and climbed to an intraday peak of $78.04 on 7 October 2024, briefly lifted by escalating Middle East tensions, before fading through year-end to close 2024 at $71.69. The benchmark then rallied again in January 2025, reaching $79.61 on 15 January, but sentiment shifted quickly as concerns about global oversupply took hold. By early April 2025, WTI printed an intraday low of $54.86 on 9 April – its weakest level in the two-year window – as OPEC+ output concerns and macro headwinds weighed. A brief recovery in late June 2025 pushed prices back toward $77.74 on 22 June, but that move faded and WTI drifted steadily lower through the second half, closing 2025 at $57.35 – down roughly 20% on the year.
The picture changed in early March 2026. US-Israeli military strikes on Iran and Iran’s subsequent order to close the Strait of Hormuz sent WTI surging from $57.42 at the 2026 open. US Crude closed at $76.31 on 5 March 2026, which is approximately 32.9% up year to date and 15.2% up year on year.
Brent Crude Oil
The Brent Crude price tracked a similar arc, touching a two-year intraday high of $87.24 on 5 April 2024 amid a spike in regional risk premium, then retreating as supply-side pressures mounted. The benchmark closed 2024 at $74.82, entered 2025 just above $75.87, and – much like WTI – turned sharply lower through the spring, sliding below $65 by September 2025 as a persistent global surplus capped recoveries. Brent ended 2025 at $60.92, a decline of approximately 18.6% over the year.
The Hormuz crisis reversed course dramatically in early March 2026, with Brent touching an intraday high of $84.57 on 3 March – a 19-month high. Brent Crude closed at $82.38 on 5 March 2026, approximately 35.6% up year to date and 4.7% up year on year.
Past performance is not a reliable indicator of future results. Share prices are indicative and may differ from live market prices.
US Crude vs Brent Crude: Capital.com analyst outlook
Crude oil’s price performance over the past two years illustrates how quickly the market can shift. Both WTI and Brent spent much of 2025 under pressure from a persistent global supply surplus, with WTI shedding around 20% across the year and Brent not far behind. The reversal in early March 2026, driven by the closure of the Strait of Hormuz following US-Israeli strikes on Iran, has pushed both benchmarks back toward levels last seen in mid-2025. The speed of the move reflects the market’s sensitivity to supply-route disruptions: roughly 20% of global oil demand transits the Strait, so any sustained closure can have meaningful implications for available supply.
That said, the outlook is far from straightforward. OPEC+ has already agreed to add output from April 2026, and a faster-than-expected resolution of the Hormuz situation could reduce the risk premium embedded in current prices. On the other hand, if the conflict broadens or Iranian production is directly impaired, the supply shock could prove more durable than markets currently anticipate. Traders are weighing two credible and opposing scenarios simultaneously, which is reflected in elevated volatility across both benchmarks.
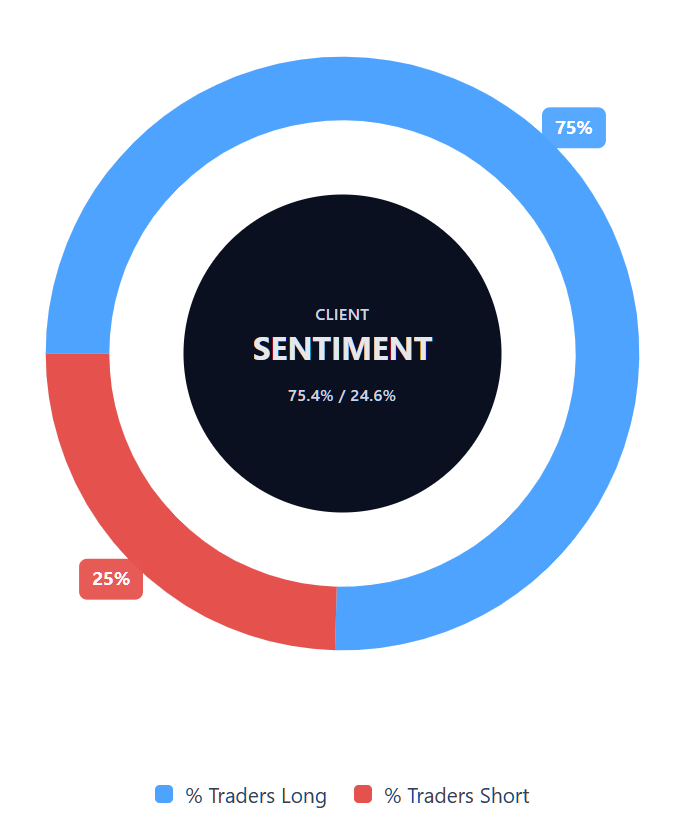
Capital.com’s client sentiment for US Crude CFDs
As of 5 March 2026, Capital.com client positioning in US Crude CFDs stands at 75.4% long vs 24.6% short, which puts buyers ahead by 50.8 percentage points and leaves sentiment heavily skewed toward longs. This snapshot reflects open positions on Capital.com and can change.
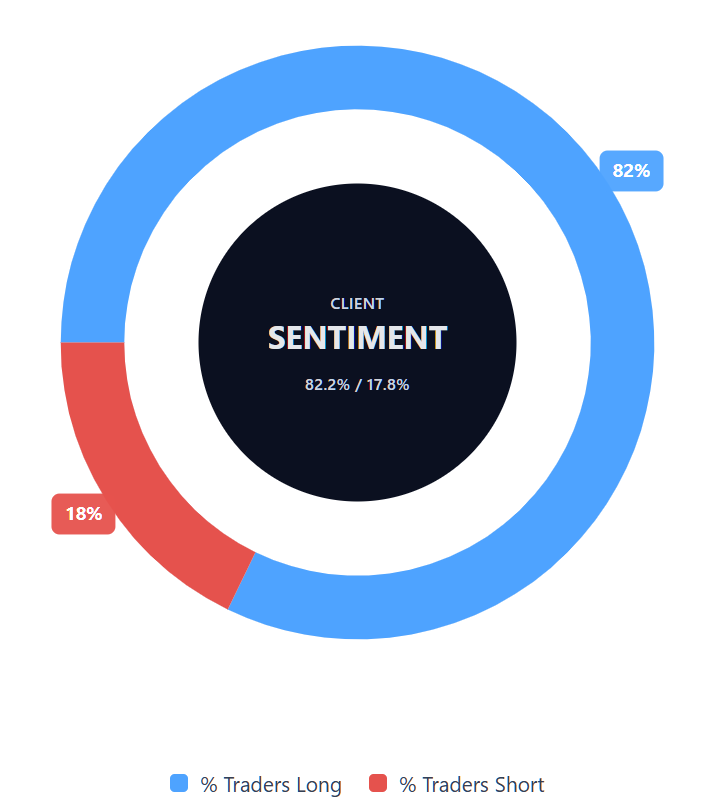
Capital.com’s client sentiment for Brent Crude CFDs
As of 5 March 2026, Capital.com client positioning in Brent Crude CFDs stands at 82.2% long vs 17.8% short, which puts buyers ahead by 64.4 percentage points and leaves sentiment heavily skewed toward longs. This snapshot reflects open positions on Capital.com and can change.
Summary – US Crude and Brent Crude (2026)
- WTI trades at $76.29 and Brent at $82.31 as of 1.34pm UTC on 5 March 2026, up roughly 32.9% and 35.6% year to date after both benchmarks shed approximately 20% across 2025.
- All key moving averages are in positive alignment on both benchmarks; RSI readings above 80 and ADX values above 36 confirm a firmly established, if stretched, uptrend.
- The dominant driver is the closure of the Strait of Hormuz following US-Israeli strikes on Iran, through which approximately 20% of global oil demand typically transits.
- Goldman Sachs raised its Q2 2026 Brent and WTI forecasts to $76 and $71 per barrel on 4 March 2026; Standard Chartered lifted its Q1 2026 Brent target to $74 on 3 March.
- OPEC+’s planned 206,000 barrels per day output increase from April 2026 and a potential Hormuz normalisation remain the key downside risks to current price levels.
- WTI resistance sits at R3 $78.74 with support near $61–$63; Brent resistance is at R3 $87.23 with support near $65–$67.
Past performance is not a reliable indicator of future results.
FAQ
What is the crude oil price forecast?
A crude oil price forecast is an estimate of where benchmarks such as US Crude (WTI) and Brent could trade over a stated period, based on assumptions about supply, demand and market conditions. In this article, published forecasts for 2026 vary widely, with some analysts focusing on near-term disruption risk linked to the Strait of Hormuz, while others keep full-year expectations closer to levels implied by a potential supply surplus. Forecasts can change quickly as new information emerges.
Could crude oil’s price go up or down?
Yes. Crude oil prices can move in either direction, sometimes rapidly, because the market reacts to multiple drivers at once. In the current context, disruption to shipping through the Strait of Hormuz can support prices by tightening available supply, while factors such as rising output from OPEC+ or higher inventories can have the opposite effect. Technical indicators may highlight momentum or key levels, but they do not predict outcomes and can reverse as conditions shift.
Should I invest in crude oil?
This depends on your objectives, risk tolerance and time horizon, and it is not a decision this article can make for you. Crude oil can be volatile, and price moves may reflect geopolitical developments, policy decisions and changes in supply and demand expectations. If you are considering exposure via CFDs, remember that leverage can amplify both gains and losses. You may want to use risk controls and ensure you understand costs, margin requirements and the risks involved in trading.
Can I trade crude oil CFDs on Capital.com?
Yes, you can trade US Crude CFDs and Brent Crude CFDs on Capital.com. Trading commodity CFDs lets you speculate on price movements without owning the underlying asset and to take long or short positions. However, contracts for difference (CFDs) are traded on margin, and leverage amplifies both profits and losses. You should ensure you understand how CFD trading works, assess your risk tolerance, and recognise that losses can occur quickly.