Volatility Takes Control as Markets Test Key Support Levels
Volatility appears to be in the driver’s seat for markets, with trade-related headlines unsettling investors late in the session on 14 October.
This has left the market in an overall precarious position, with everything from the S&P 500 to NVIDIA and Bitcoin sitting on key levels of support. At this stage, the only asset displaying a clear upward trend is gold — and even that may be nearing some form of conclusion.
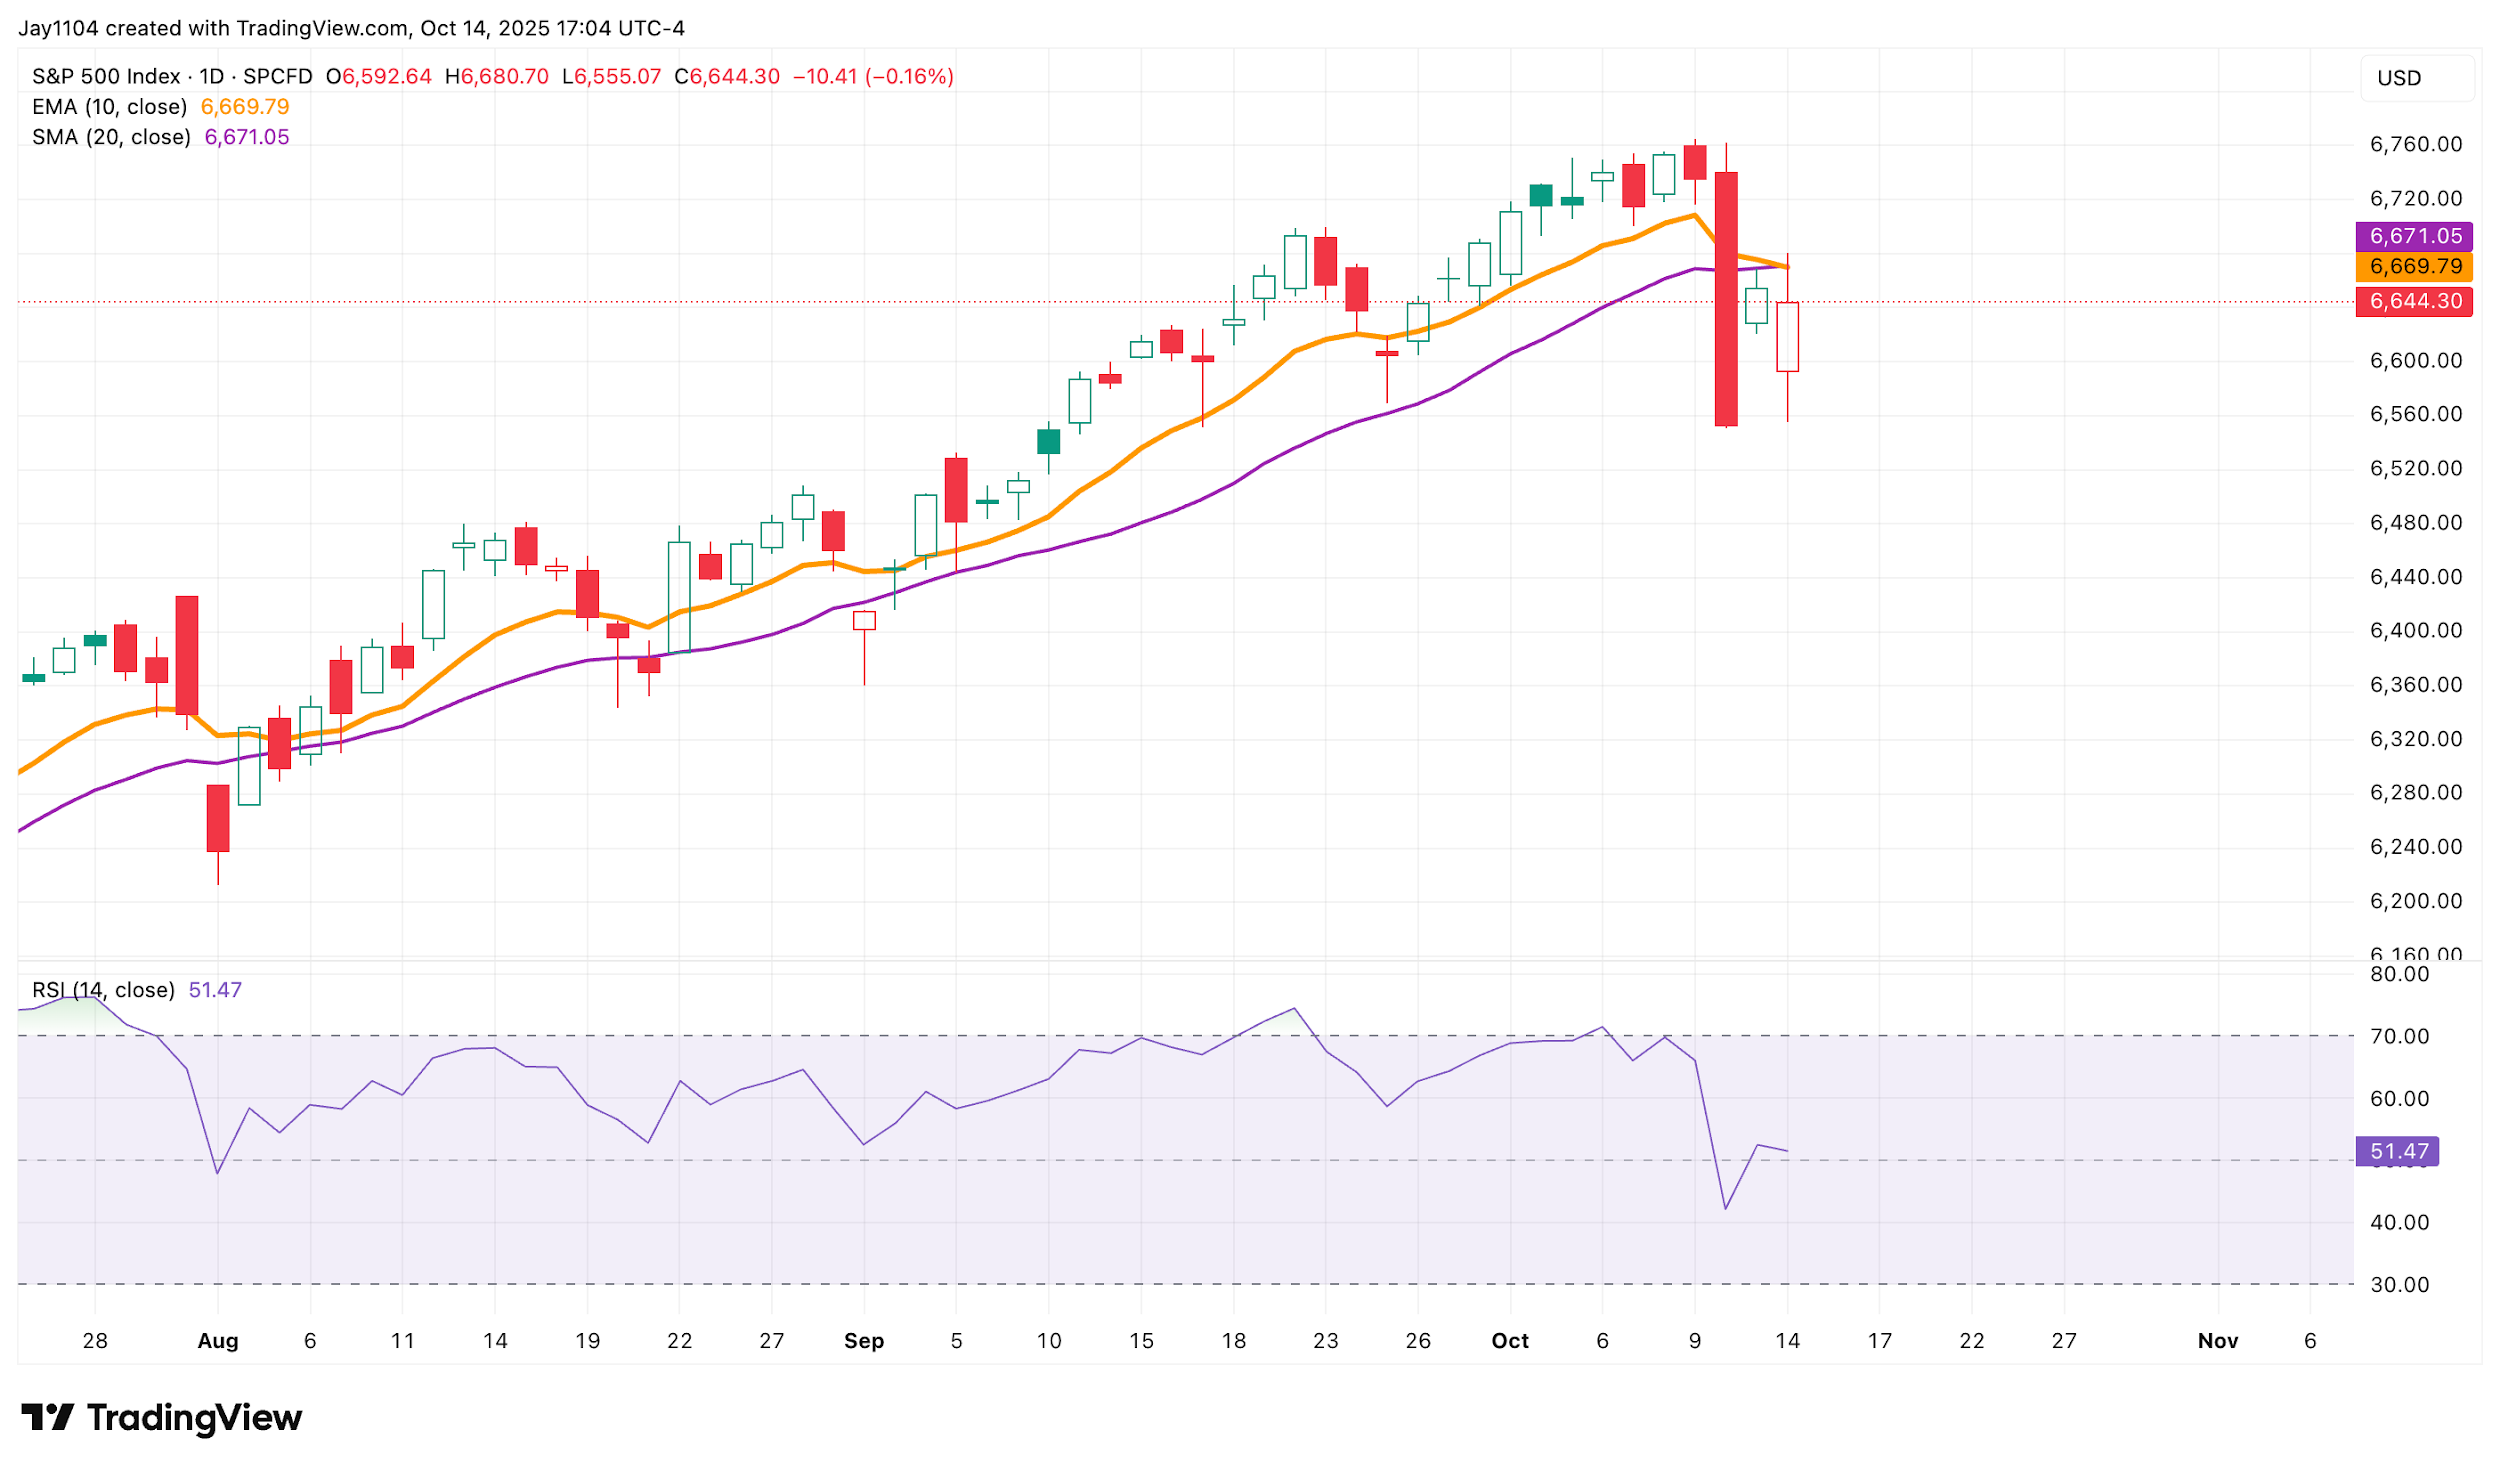
The S&P 500 Stalls Again
The S&P 500 fell by more than 1% at the start of the day, giving back all of yesterday’s gains to fill the gap left from 10 October at around 6,550. However, that decline was quickly erased as the S&P 500 managed to rally throughout the day, even turning positive by about 30 basis points to reach the 61.8% retracement level, around 6,680. Additionally, the index stalled near resistance at both the 20-day moving average and the 10-day exponential moving average, before finishing the day lower by 16 bps, or more trade-related headlines.
(Source: TradingView)
Past performance is not a reliable indicator of future results.
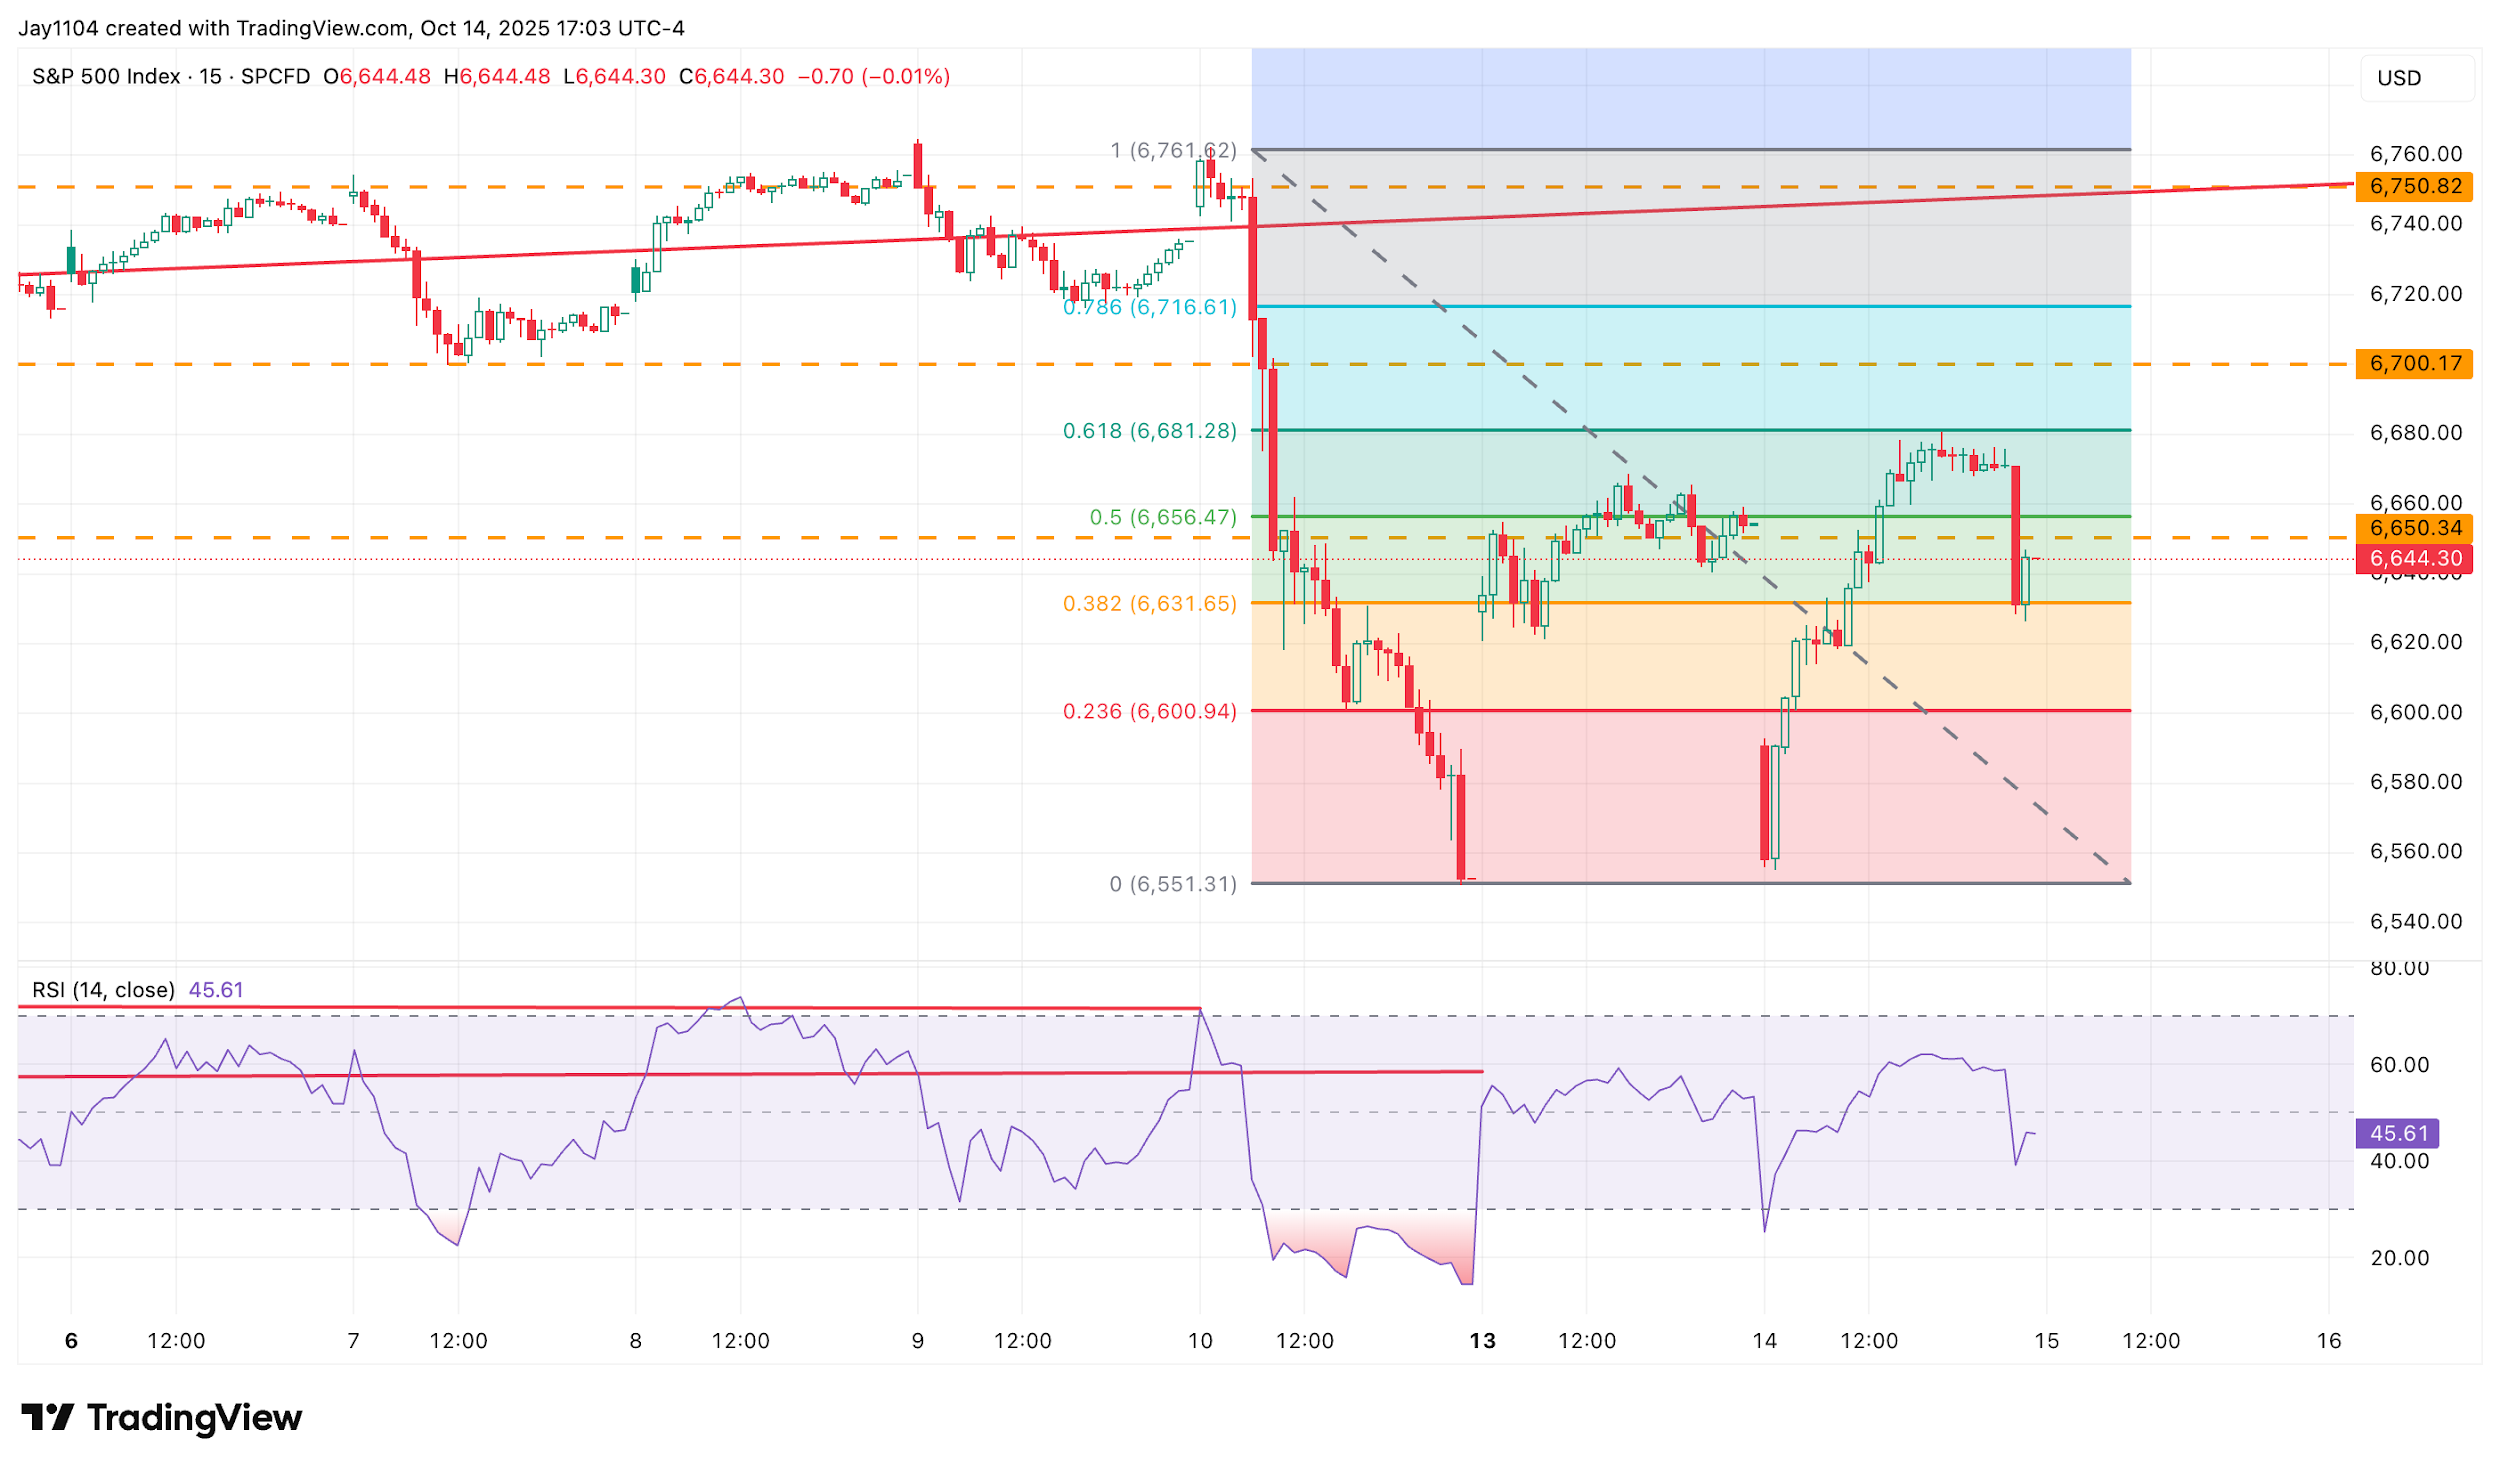
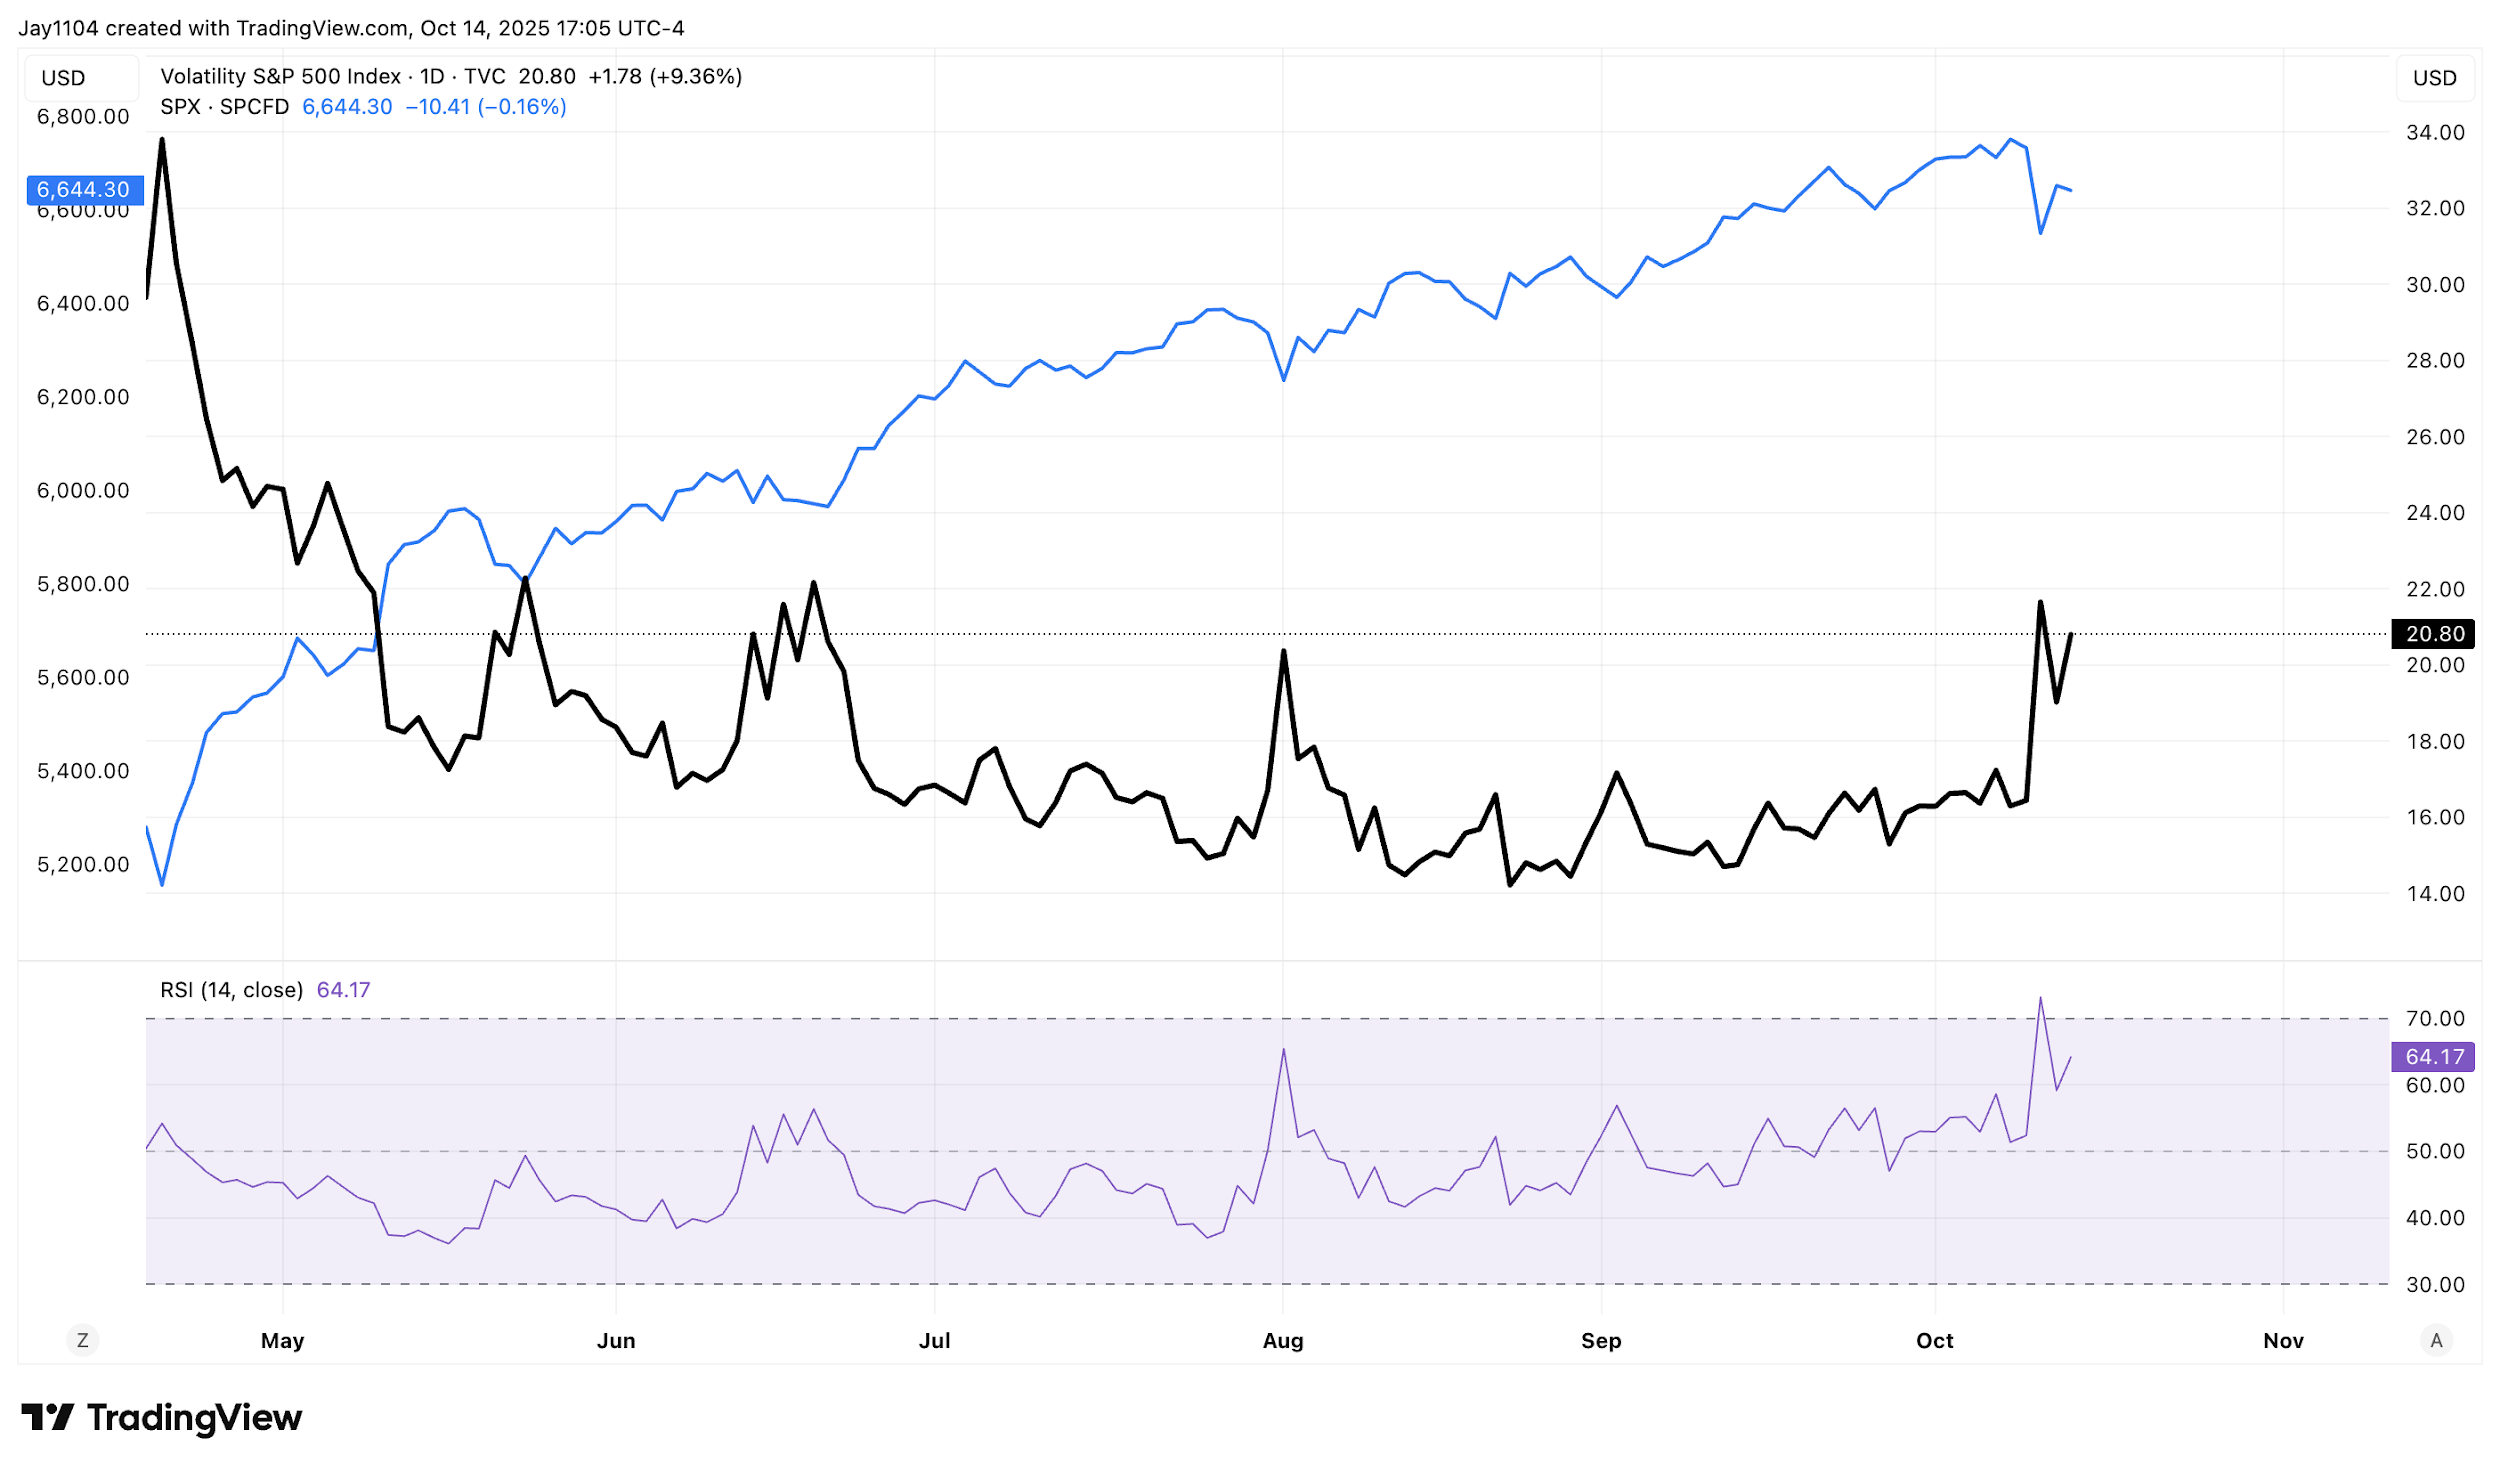
The decline on Friday was very sharp and steep, leaving the index somewhat off balance and not providing a clear sense of direction at this point. Over the past two days, trading has been more sideways, as the market appears to be waiting to establish its next directional move. However, it is worth noting that although the S&P 500 finished well off its lows, implied volatility measures also increased, with the VIX finishing higher on the day at around 20.8, after having traded as high as 23 earlier in the morning.
(Source: TradingView)
Past performance is not a reliable indicator of future results.
If the S&P 500 can rise above 6,680, it could set up a potential move towards 6,700, where a major gamma level resides — an important area as we approach option expiry at the end of the week. However, there is also room for the index to fall. The put wall sits around 6,500, suggesting that if a decline begins, it could be steep heading into the week’s end.
(Source: TradingView)
Past performance is not a reliable indicator of future results.
Nvidia Breaks Support
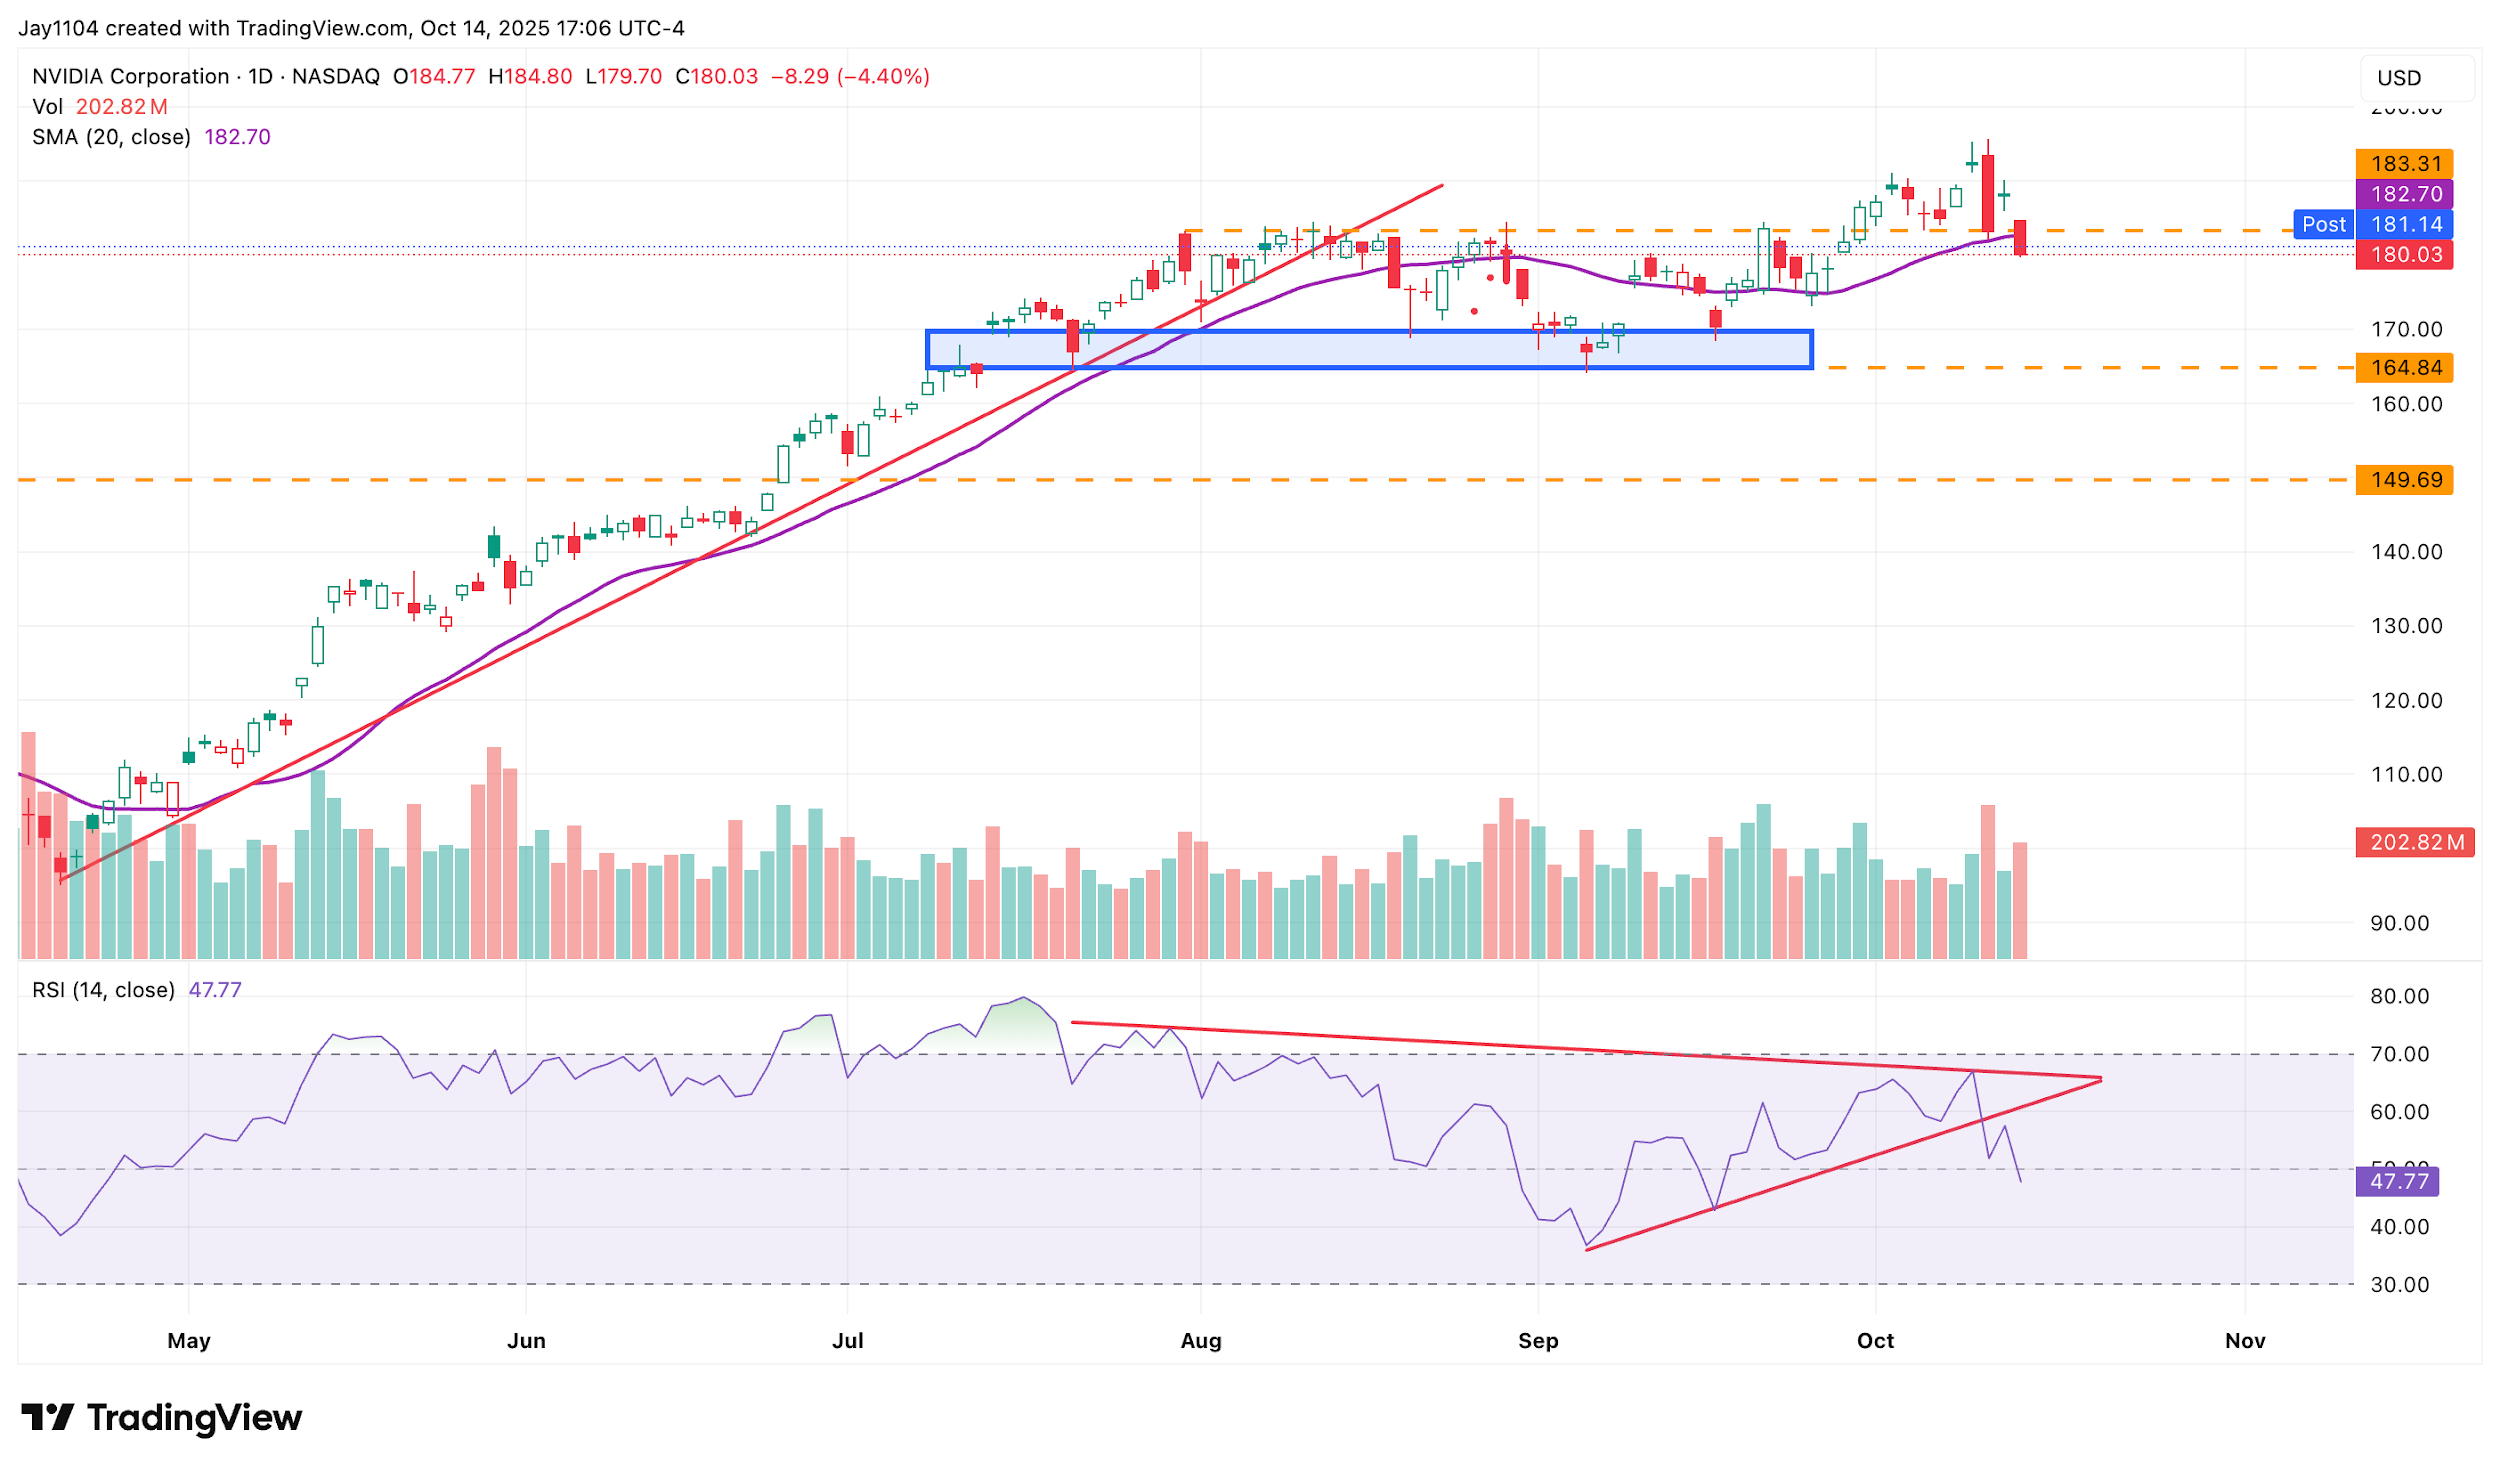
Despite the rebound in the S&P 500 Tuesday, NVIDIA shares were unable to recover, falling by more than 4% and, more importantly, breaking below support around $183. This raises the question of whether NVIDIA will be able to recover and test the $183 area, which now acts as resistance, or whether it might continue to move lower towards lower support levels around $173 or even $165.
The 20-day moving average is starting to peak and may be beginning to roll over. Volume levels have also flattened, while the RSI and momentum indicators suggest that NVIDIA could be losing strength and heading lower — a development that would likely have negative implications for the broader equity market.
(Source: TradingView)
Past performance is not a reliable indicator of future results.
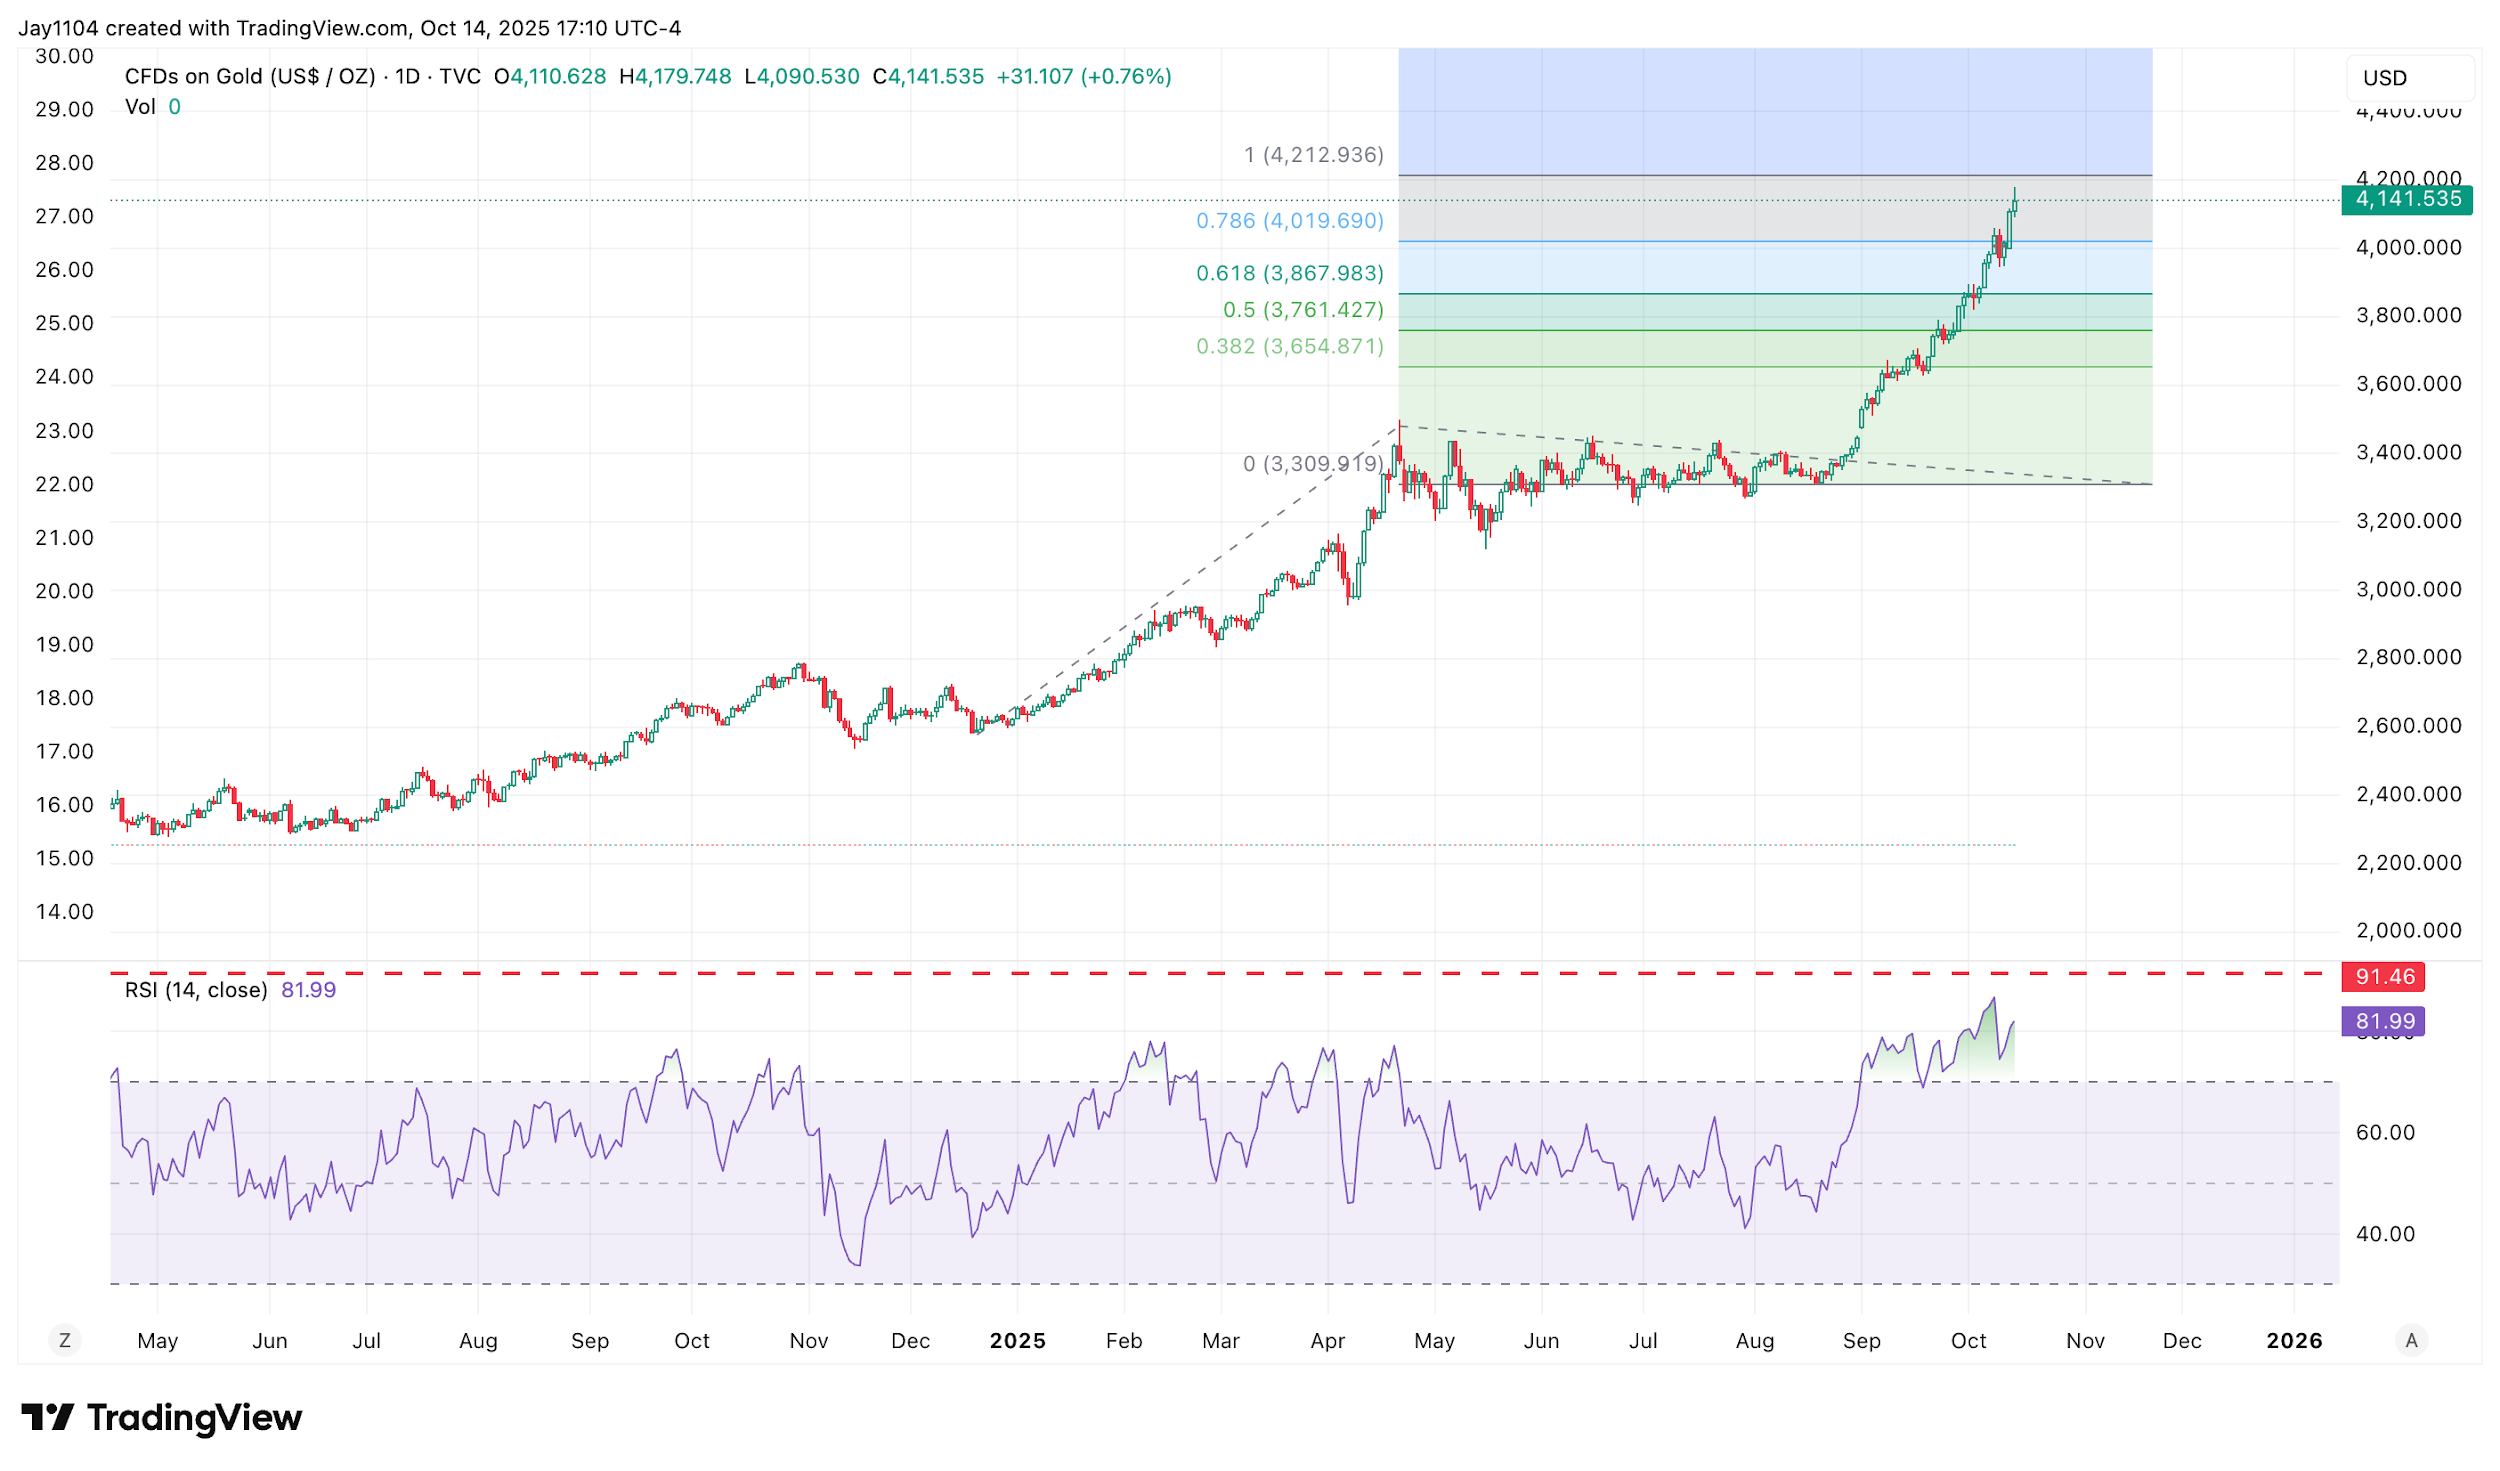
Gold May Be Near A Top
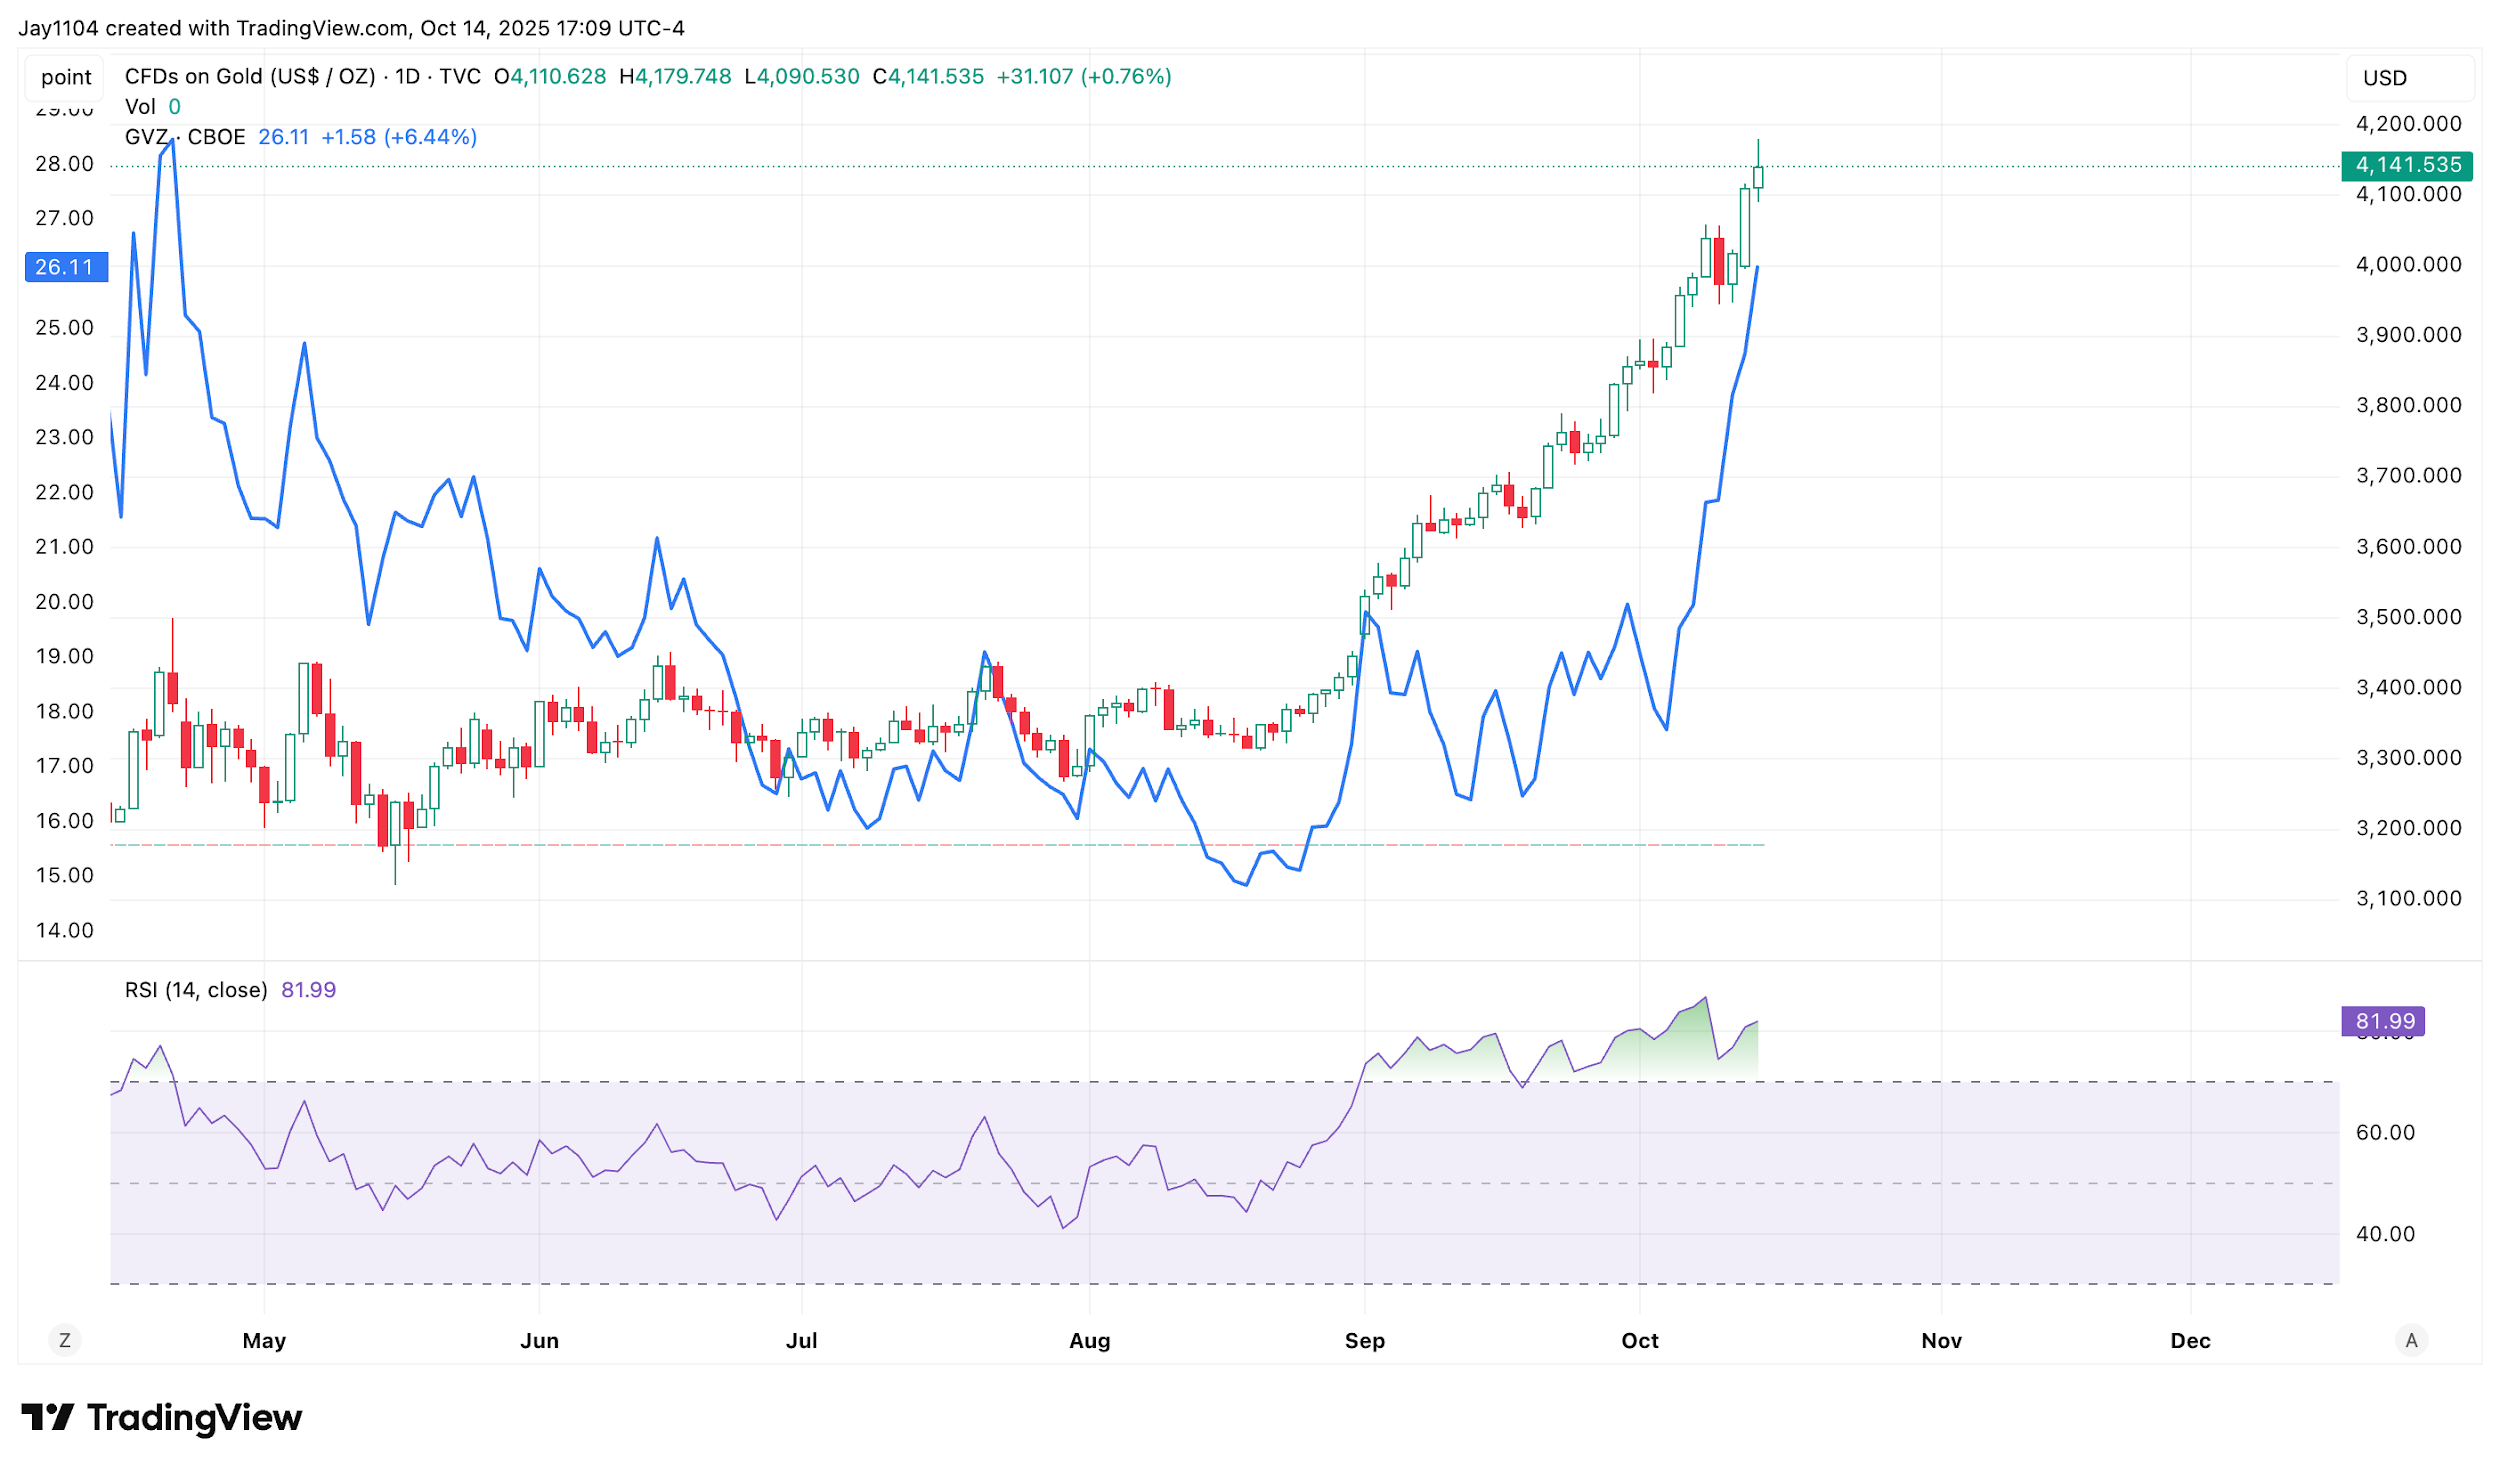
Gold prices continued to rise on Tuesday, with the precious metal climbing by about 1% to finish around $4,150. There has been a substantial increase in ETF inflows into gold over the past couple of weeks. Additionally, the GBZ — the Gold Volatility Index — also moved higher on Tuesday, rising to around 26.1.
(Source: TradingView)
Past performance is not a reliable indicator of future results.
When viewed alongside rising implied volatility and increasing ETF inflows, this suggests that gold’s recent strength may be taking on a more speculative tone. Furthermore, if one were to draw a 100% Fibonacci extension from the move that began on 17 December 2024 to the peak in April 2025, it would project a target near $4,250. This implies that gold could potentially have limited additional upside, depending on market conditions.