Texas Instruments stock forecast: Third-party price targets
Texas Instruments (TXN) traded at $173.82 as of 09:35 UTC on 15 October 2025, within an intraday range of $172.56 to $175.99. The stock fell from $181.60 on 8 October and remains well below its 12-month high of $221.69.
Texas Instruments is set to release its third-quarter 2025 results on 21 October 2025, with analysts projecting earnings per share of $1.48 and revenue of $4.65bn (MarketBeat, 14 October 2025).
Texas Instruments stock forecast: Analyst price target view
UBS (Buy)
UBS retains a Buy rating but reduces its one-year target to $245, citing lower visibility on AI-related capital expenditure and slower industrial restocking amid ongoing geopolitical headwinds (TradingView, 13 October 2025).
BofA Securities (Underperform)
BofA Securities maintains its Underperform rating and a $190 one-year price target. The bank notes limited AI exposure, tariff-related challenges, and margin pressure amid soft industrial demand (Financial Modeling Prep, 13 October 2025).
TD Cowen (Buy)
TD Cowen reiterates a Buy rating and sets a $210 target, citing steady semiconductor demand and consistent analog chip shipments supported by diversified end-market exposure (MarketScreener, 10 October 2025).
Morgan Stanley (Underweight)
Morgan Stanley continues to hold an Underweight rating with a $192 target, noting that analog chip results fell short of expectations against a high September-quarter benchmark as cyclical headwinds persist. The bank highlights uneven restocking trends and a cautious outlook for automotive markets (AInvest, 12 September 2025).
Predictions and third-party forecasts may not reflect future outcomes, as they can’t account for unforeseen market developments. Past performance isn’t a reliable indicator of future results.
TXN stock price: Technical overview
On the daily chart, TXN was trading at $173.82 as of 9:35am (UTC), remaining below its key simple moving average (SMA) cluster – 20-, 50-, 100-, and 200-day averages at roughly 180, 188, 194, and 186 – with all SMAs indicating a bearish bias. Momentum is mixed: the RSI (14) stands at 38.5, while the ADX (14) at 29.3 suggests an established trend.
The first area to watch on the upside is the Classic R1 at 197.93; a daily close above this level would bring the R2 at 212.13 into view. On pullbacks, initial support lies at the Classic S1 of 171.77; a break below that level could open the way toward the S2 near 159.81 (TradingView, 15 October 2025).
This analysis is provided for informational purposes only and does not constitute financial advice or a recommendation to buy or sell any instrument.
Texas Instruments share price history
Texas Instruments shares traded within a range of $146.74 (22 April 2025) to $214.64 (22 July 2025). The stock opened October 2023 near $154, rose steadily through 2024 to a peak above $215 in mid-2025, then retreated to the $180–$190 range by year-end. After testing resistance around $200 in early 2025, TXN moved lower into October, closing at $176.95 on 7 October 2025 – about 5.2% lower year to date and 12.1% below its level a year earlier.
As of 14 October 2025, Texas Instruments closed at $173.82.
Past performance is not a reliable indicator of future results. Share prices are indicative and may differ from live market prices.
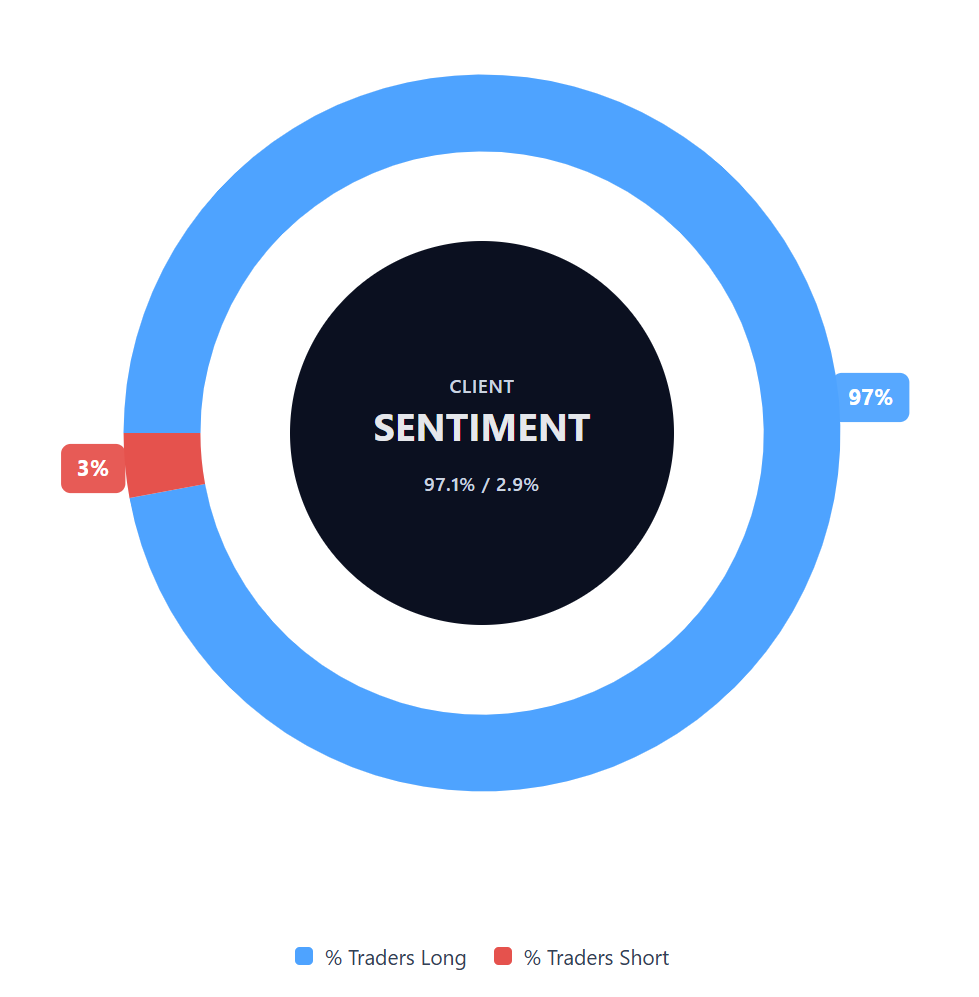
Capital.com’s client sentiment for Texas Instruments CFDs
As of 15 October 2025, client positioning in Texas Instruments CFDs is 97.1% long and 2.9% short, showing a 94.3 percentage point difference in favour of buyers. This snapshot represents open positions on Capital.com and is subject to change.
FAQ
Is Texas Instruments a good stock to buy?
Analysts’ views on Texas Instruments (TXN) differ, with a range of price targets. Some highlight the company’s industrial and automotive exposure, while others note slower growth in AI-related demand. These are third-party assessments and should not be considered investment advice. Past performance is not a reliable indicator of future results.
Could Texas Instruments stock go up or down?
Over the past year, TXN’s share price has ranged between $146.74 and $214.64, reflecting changes in semiconductor demand and overall market sentiment. Like all equities, its price may rise or fall depending on broader economic conditions and company performance.
Should I invest in Texas Instruments stock?
Whether to trade or invest in Texas Instruments depends on your financial goals, experience, and risk tolerance. Bear in mind that contracts for difference (CFDs) are traded on margin, and leverage amplifies both profits and losses. Always carry out independent research and remember that past performance is not a reliable indicator of future results.