Stellantis stock forecast: Third-party price targets
Stellantis’ share price moves within a broader context of sector performance, analyst reassessments and evolving sentiment, which together help frame how the stock is currently trading.
Stellantis (STLAM) is trading around €9.62 as of 10:53am (UTC) on 9 January 2026, towards the upper end of its intraday range between €8.99 and €9.67 on Capital.com’s feed. Past performance is not a reliable indicator of future results.
The stock is moving amid a mixed backdrop for European autos. The STOXX Europe 600 Automobiles & Parts index is down around 0.7% intraday near 525.6 (STOXX, 9 January 2026). This follows ongoing discussion around production trends in Italy (Global Energy News, 7 January 2026).
Stellantis stock forecast 2026–2030: Third-party price targets
As of 9 January 2026, third-party Stellantis stock predictions indicate a range of views on the stock’s 12-month outlook. Targets are typically framed as one-year objectives rather than specific end-period settlement levels and are expressed mainly in euro or US dollar terms, reflecting coverage across different global listings. These estimates are based on varying assumptions around strategic execution, regional demand and capital allocation.
Investing.com (single-broker revision)
Investing.com reports that TD Cowen raised its Stellantis (US-listed shares) price target to $13 from $12 while maintaining a Hold rating,. The broker cites increased confidence in the North American turnaround, referencing management commentary on product strategy, brand positioning and recovery plans following recent meetings (Investing.com, 12 December 2025).
Piper Sandler / Nasdaq (average one-year target)
Nasdaq notes that the average one-year price target for Stellantis (US-listed shares) across covering analysts stands at $11.33 per share. This average is drawn from a range starting at $6.98 on the low end. Piper Sandler’s upgrade is discussed in the context of valuation considerations and expectations around delivery on the group’s strategic and financial plans (Nasdaq, 8 January 2026).
MarketBeat (consensus across Wall Street)
MarketBeat reports that 17 Wall Street equity research analysts have an average 12-month price target of $12.04 for Stellantis (US-listed shares), with individual estimates ranging from $10 to $15. The service characterises the overall stance as broadly Hold-oriented, as analysts weigh cyclical auto demand, margin trends and capital-return policies (MarketBeat, 9 January 2026).
Investing.com (consensus) (STLAM Milan-focused poll)
For the Milan-listed Stellantis shares, Investing.com’s consensus data shows 26 analysts assigning an average 12-month STLAM stock forecast of around €9.75. Estimates span from €6 to €14. The overall view is described as Neutral, with most contributors rating the stock Hold while a smaller subset expresses Buy or Sell views amid sector-level and macroeconomic uncertainty (Investing.com, 9 January 2026).
Predictions and third-party forecasts are inherently uncertain, as they cannot fully account for unexpected market developments. Past performance is not a reliable indicator of future results.
STLAM stock price: Technical overview
STLAM’s stock price is around €9.62 as of 10:53am (UTC) on 9 January 2026, hovering around the Classic pivot at approximately €9.66 after moving between an intraday low near €8.99 and a high around €9.67. The daily simple moving-average cluster remains broadly supportive, with the 20-, 50-, 100- and 200-day SMAs located around 9.8, 9.3, 8.9 and 8.8 respectively. The 20-day average remains above the 50-day line while price holds above the 50-day band.
Momentum indicators present a neutral to subdued picture. The 14-day RSI sits near 52.5, indicating neither overbought nor oversold conditions, while the ADX around 14.4 suggests a weak or indecisive trend environment. On the upside, the Classic R1 pivot near €10.29 represents the first reference area, with a daily close above that level bringing the R2 zone around €11.13 back into focus. On the downside, the Classic pivot near €9.66 marks initial support, followed by the 100-day SMA around €8.90. A sustained move below that level would expose the S1 region near €8.83 (TradingView, 9 January 2026).
This technical analysis is provided for informational purposes only and does not constitute financial advice or a recommendation to buy or sell any instrument.
Stellantis share price history
The STLAM stock price spent much of 2024 trading in the mid-teens, reaching closes above €20 in May and peaking near the €25 area in early April. The price later slipped below €15 by late August. During the final quarter of 2024, the shares continued to trend lower, moving from around €14.60 at the end of September to approximately €12.60 by late December. This decline extended into early 2025, with prices generally ranging between €12.40 and €13.50 through February, including a brief move above €13.50 later that month.
From March 2025, the stock moved sharply lower, falling from above €12.00 to below €9.00 by late April. It then trended largely sideways to lower through the summer, with prices mostly between €8.50 and €9.50 from May to August, before dipping below €8.00 in early September. In the final months of 2025, Stellantis staged a gradual recovery, rising from around €8.00 in late September to above €10.00 by early December. The shares then eased back toward the €9.40–€9.70 range. By 8 January 2026, the price was trading around the mid-€9 level, reflecting a notable pullback from early-2024 highs but a rebound from the lows recorded in autumn 2025.
Past performance is not a reliable indicator of future results. Share prices are indicative and may differ from live market prices.
Stellantis (STLAM): Capital.com analyst view
Stellantis shares have undergone a pronounced shift over the past two years, moving from the low- to mid-€20s in early 2024 to single-digit levels by early 2026. This move coincided with a cooling in the broader automotive cycle and a shift in investor focus toward margins, pricing discipline and cost control. Company updates during 2025 pointed to a mixed fundamental backdrop. Stellantis reported first-half net revenues of €74.3bn, down 13% year on year, while management commentary referenced new model launches and commercial initiatives as part of broader recovery efforts in key regions.
Alongside these challenges, management has highlighted areas of relative resilience. These include a maintained competitive position in Europe, with more than 1.3m vehicle registrations and a 17% EU30 market share at mid-2025. At the same time, the group has emphasised ongoing exposure to cyclical demand conditions and policy-related risks, particularly as the industry continues to invest heavily in electrification and software. These factors can support the investment case if execution, cost discipline and demand trends improve, but they may also weigh on the share price if growth slows further, regulatory pressures intensify or operational delivery falls short of market expectations.
Past performance is not a reliable indicator of future results.
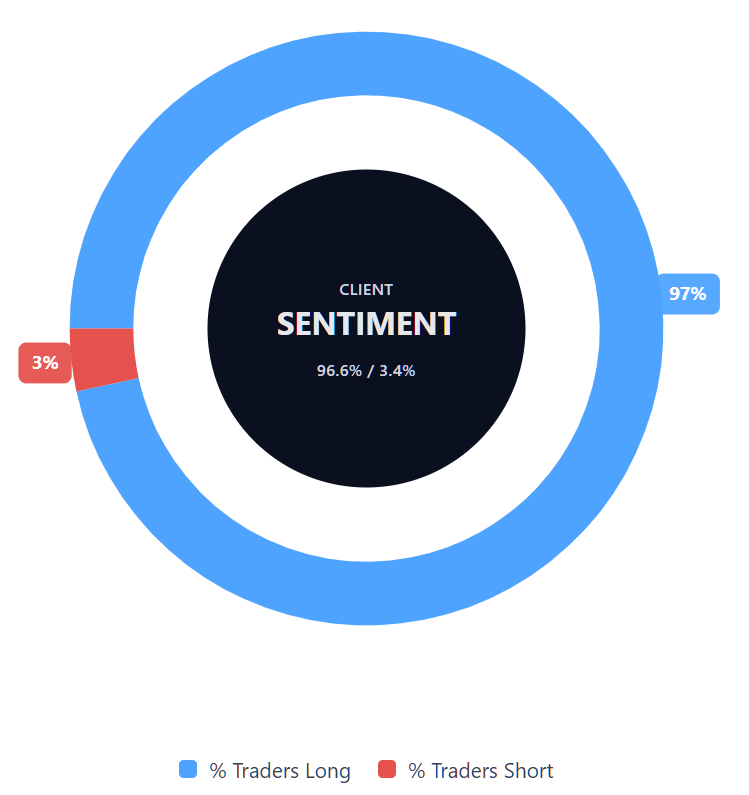
Capital.com’s client sentiment for Stellantis CFDs
As of 9 January 2026, Capital.com client positioning in Stellantis CFDs is currently heavily skewed toward long positions, with around 96.6% of open positions held by buyers versus 3.4% by sellers. This places positioning firmly in one-sided territory, with buyers outnumbering sellers by approximately 93.2 percentage points. These figures reflect open positions on Capital.com at the time of writing and can change.
Summary – Stellantis price 2026
- Stellantis traded within a wide range during 2025, declining from levels above €13 in January to below €9 by late April, before stabilising mostly between €8 and €10 toward the end of the year.
- The share price briefly moved back above €10 in early December 2025, before easing toward the mid-€9 area in the first week of January 2026.
- Technical indicators show STLAM trading above key medium-term moving averages, with the 20-, 50-, 100- and 200-day SMAs clustered below the current price.
- Corporate updates during 2025 pointed to lower first-half net revenues, alongside resilient regional positions, including a 17% EU30 market share and more than 1.3m registrations by mid-year.
Past performance is not a reliable indicator of future results. Analyst targets, sentiment data and technical signals do not guarantee future price outcomes.
FAQ
Who owns the most Stellantis stock?
Stellantis has a diverse shareholder base that includes institutional investors, retail shareholders and strategic holders. Large asset managers and pension funds feature among the biggest institutional owners, reflecting the company’s inclusion in major global indices. The Agnelli family’s investment vehicle, Exor, is a significant long-term shareholder and plays an influential role. Ownership levels can change over time as funds rebalance portfolios and market conditions evolve.
What is the five-year Stellantis share price forecast?
There is no single, agreed five-year forecast for Stellantis shares. Analyst coverage typically focuses on 12-month price targets rather than longer-term projections, reflecting uncertainty around future demand, technology investment, regulation and economic cycles. Longer-term outcomes will likely depend on factors such as execution of strategic plans, cost management, regional performance and broader industry trends, including electrification. As a result, longer-dated forecasts are inherently uncertain and should be interpreted with caution.
Is Stellantis a good stock to buy?
Whether Stellantis is considered attractive depends on individual objectives, risk tolerance and market expectations. Analysts currently present a mix of Buy, Hold and Sell-type views, reflecting both potential opportunities and ongoing risks. Common considerations include cyclical exposure to the automotive sector, margin dynamics, capital returns and regional performance. This information is not investment advice, and any decision should be based on personal circumstances and independent research.
Could Stellantis stock go up or down?
Like all publicly traded shares, Stellantis stock can move both higher and lower. Price movements may be influenced by company earnings, production data, analyst revisions, broader market conditions and sector-wide developments. External factors such as economic growth, interest rates, regulation and shifts in consumer demand can also affect performance. Share prices can be volatile, and past price movements do not indicate how the stock will perform in the future.
Should I invest in Stellantis stock?
This article does not provide investment advice or recommendations. Deciding whether to invest in Stellantis depends on your financial goals, time horizon and ability to tolerate risk. Shares can rise or fall in value, and investors may lose some or all of their capital. It may be helpful to review multiple information sources and, where appropriate, consider independent financial guidance before making any investment decisions.
How can I trade Stellantis CFDs on Capital.com?
Trading Stellantis CFDs on Capital.com lets you speculate on price movements without owning the underlying asset and to take long or short positions. However, contracts for difference (CFDs) are traded on margin, and leverage amplifies both profits and losses. You should ensure you understand how CFD trading works, assess your risk tolerance, and recognise that losses can occur quickly.