

Siemens stock forecast: VinSpeed high-speed rail contract
Siemens is a German industrial group with businesses across automation, infrastructure and mobility. On 22 September 2026, Siemens Mobility signed a high-speed rail contract with VinSpeed. Explore third-party SIE price targets. Past performance is not a reliable indicator of future results.
Siemens AG (SIE) trades around €276.35 at 10:44am UTC on 22 September 2026, near the upper end of its €269.15–€276.60 intraday range. Past performance is not a reliable indicator of future results.
Recent company developments include Siemens Mobility signing a turnkey contract with VinSpeed on 22 September 2026, expanding the companies' cooperation in high-speed rail (Siemens, 22 September 2026). Siemens also continued its share buyback programme, repurchasing 326,900 shares between 14 and 20 September as part of the scheme running since 1 July 2026 (TradingView, 21 September 2026).
In the wider German market, the DAX closed 1.07% higher at 25,575.01 points on 21 September, while oil prices and bond yields fell during the session (Saxo Bank, 22 September 2026). Company orders, contract activity and share buybacks can influence sentiment towards Siemens, although their effect on the share price may depend on execution, industrial demand and broader market conditions.
Third-party Siemens outlook: €1bn Vietnam rail deal
As of 22 September 2026, third-party Siemens stock predictions show a broad range of expectations.
Eulerpool (consensus overview)
Eulerpool's aggregated data show an average 12-month Siemens price target of €282.99 and a median of €284.07 across 32 analysts as of 20 September 2026. Of these, 23 rate the stock a buy, six a hold and three a sell (Eulerpool, 20 September 2026).
Investing.com (consensus overview)
Investing.com's analyst panel puts the average 12-month price target at €303.79, with estimates ranging from €235 to €355 across 23 analysts as of 18 September 2026. The range illustrates how far individual expectations for the stock can differ (Investing.com, 18 September 2026).
BofA Global Research (Buy)
BofA raised its Siemens price objective to €330 from €317 while maintaining a buy rating, according to an 8 September 2026 note covering the pan-European capital goods sector. The revision reflected a more positive assessment of the growth outlook for Siemens' Smart Infrastructure division (Webull, 8 September 2026).
Bernstein (Buy)
Bernstein reiterated its buy rating and €330 price target on 14 September 2026. Analyst Alasdair Leslie cited continued confidence in Siemens' earnings trajectory when maintaining the target (MarketScreener, 14 September 2026).
DZ Bank (Buy)
DZ Bank maintained its buy rating and €330 fair value estimate in a research note dated 21 September 2026. Analyst Alexander Hauenstein kept the assessment unchanged as Siemens continued to report order activity across its core divisions (Finanzen.ch, 21 September 2026).
Predictions and third-party forecasts are inherently uncertain, as they cannot fully account for unexpected market developments. Past performance is not a reliable indicator of future results.
Siemens upcoming/latest earnings
Siemens reported its third-quarter fiscal 2026 results on 6 August 2026. Orders reached a record €27.9bn, up 14% on a comparable basis, while revenue increased 8% to €20.8bn.
Its book-to-bill ratio, orders divided by revenue, was 1.34, meaning orders exceeded revenue during the period. Industrial-business profit rose 25% to €3.5bn, producing a 17.3% profit margin, while net income increased 15% to €2.6bn. Basic earnings per share were €2.93 and free cash flow reached €4.1bn.
Siemens reported that Smart Infrastructure led order growth, with Digital Industries also contributing.
For fiscal 2026, Siemens raised its pre-purchase-price-allocation earnings-per-share outlook to €11.20–€11.50 from €10.70–€11.10. It continued to expect comparable group revenue growth in the upper half of its 6%–8% range and a book-to-bill ratio above 1 (Siemens, 6 August 2026).
These figures represent Siemens' own guidance rather than an independent forecast and remain subject to business, market and currency conditions. Siemens is scheduled to report its fiscal fourth-quarter and full-year 2026 results on 12 November 2026 in Munich, according to its financial calendar (Siemens, 23 September 2026).
SIE stock price: technical overview
The SIE stock price trades at €276.35 at 10:44am UTC on 22 September 2026, above its 20-, 50-, 100- and 200-day simple moving averages (SMAs), at roughly €272, €275, €273 and €256 respectively.
The 20-day SMA remains below the 50-day SMA, so this measure alone does not provide a clear short-term directional signal. Momentum indicators are also mixed. The 14-day relative strength index (RSI) stands at 54.3, within the neutral zone, while the average directional index (ADX) at 21.3 points to a relatively weak trend. The moving average convergence divergence (MACD) level is negative at −2.6 and the Awesome Oscillator stands at −7.7.
If the price moves higher, the classic pivot at €281.60 provides the first cited resistance reference. Beyond this, technical traders may monitor R1 at €295.70, the €300 level and R2 at €305.90.
If the price moves lower, nearby reference levels include the Ichimoku base line at €274.70, the 30- and 50-day SMAs near €275, the 100-day SMA at €273 and the 20-day SMA around €272. The S1 pivot stands at €271.40. Further below, the 200-day SMA near €256 and S2 at €257.30 provide additional technical reference points (TradingView, 22 September 2026).
Technical indicators can help describe past and current price behaviour, but they cannot predict future movements. This analysis is for informational purposes only and does not constitute financial advice or a recommendation to buy or sell any instrument.
Siemens share price history (2024–2026)
SIE’s stock price traded at €167.60 on 23 September 2024, the start of this two-year window. The stock moved largely between €170–€195 through late 2024 before falling to a two-year low of €162.65 on 7 April 2025 during a period of uncertainty around global tariffs.
The price subsequently recovered above €200 by late April and moved towards €230 over the summer.
Price swings widened in early 2026. Siemens traded across a €187–€262 range in January before reaching €276.10 on 12 February and then falling below €210 in March. From €179.80 on 14 April, the stock advanced over the following months and reached a two-year high of €292.05 on 28 August, during a period that also included Siemens' Q3 results and upgraded outlook.
The share price then fell to €259.25 on 15 September before moving back into the upper €270s. Siemens traded at €276.35 on 22 September 2026, approximately 14.5% higher year to date and 21.4% higher year on year.

Past performance is not a reliable indicator of future results. Share prices are indicative and may differ from live market prices.
Siemens (SIE): Capital.com analyst view
Siemens' share price moved from below €190 early in the year to a two-year high of €292.05 in late August before returning to the €270s during September.
Over the same period, Siemens reported record orders and raised its full-year earnings outlook, with order growth across Digital Industries, Smart Infrastructure and Mobility. Continued order conversion, demand for electrification and data-centre infrastructure, and resilient industrial spending could support future earnings expectations and, in turn, sentiment towards the shares.
However, the same outlook remains sensitive to risks. Weaker industrial capital expenditure, slower order conversion, currency movements or a broader economic slowdown could put pressure on earnings expectations. Valuation may also influence how the market reacts to future results, particularly after the stock's gains earlier in 2026.
The scale of Siemens' price moves during the year shows that company-specific developments and the wider macroeconomic backdrop can affect the shares in either direction.
Capital.com’s client sentiment for Siemens CFDs
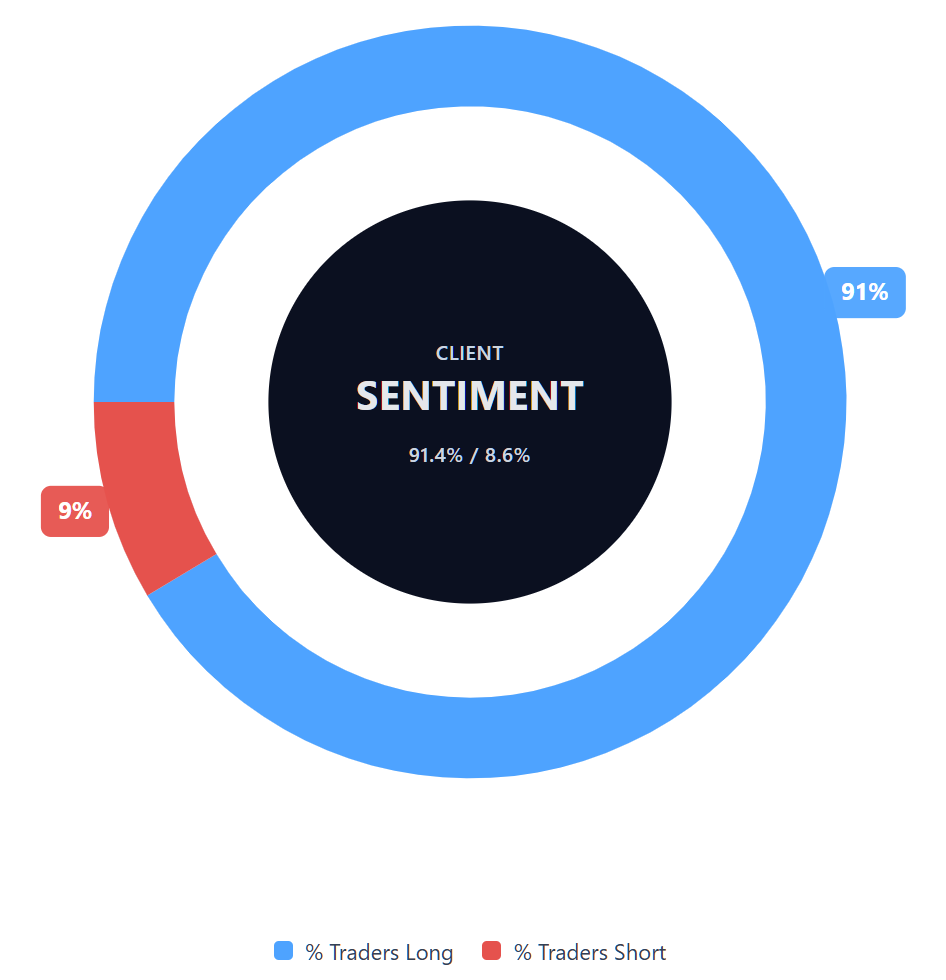
As of 22 September 2026, Capital.com client positioning in Siemens CFDs shows 91.4% buyers and 8.6% sellers, a difference of 82.8 percentage points.
These figures provide a snapshot of open Siemens positions on Capital.com at the time of writing. Client sentiment can change and does not indicate where the share price will move next.
Summary – Siemens 2026
- Siemens traded at €276.35 at 10:44am UTC on 22 September 2026, within an intraday range of €269.15–€276.60.
- On TradingView, technical indicators presented a mixed picture, with the SIE price above the cited moving averages but momentum measures providing no clear directional signal.
- Siemens reported third-quarter orders of €27.9bn and revenue of €20.8bn and raised its fiscal 2026 earnings outlook.
- Recent company developments include continued share buybacks and additional high-speed rail contract activity.
Past performance is not a reliable indicator of future results.
FAQ
Who owns the most Siemens stock?
Siemens has a widely distributed shareholder base rather than a single controlling owner. In its 2025 annual report, Siemens disclosed that BlackRock held 6.67% of voting rights as of 29 July 2025, making it the largest reportable shareholder listed there. Other institutional investors also hold significant positions. Shareholdings can change over time, so ownership figures should be checked against the latest Siemens filings and regulatory notifications.
What is the five-year Siemens share price forecast?
The article does not provide a five-year Siemens stock forecast, and such long-range estimates carry substantial uncertainty. The cited third-party analyst targets cover a much shorter 12-month horizon, with consensus averages of €282.99–€303.79 and individual estimates ranging from €235 to €355. Over five years, Siemens’ price could be influenced by earnings, order growth, industrial spending, currency movements, valuation and broader economic conditions, all of which can change materially.
Is Siemens a good stock to buy?
Whether Siemens is a good stock to buy depends on your objectives, risk tolerance and view of the company. Recent results showed record orders, higher revenue and an upgraded fiscal 2026 outlook, which may support sentiment. However, weaker industrial spending, slower order conversion, currency movements or valuation concerns could weigh on the shares. Analyst targets also vary widely, underlining the uncertainty. These factors should be considered as information rather than a recommendation.
Could Siemens stock go up or down?
Yes. Siemens shares could move higher or lower depending on company results and wider market conditions. Strong order conversion, infrastructure demand, electrification spending or better-than-expected earnings could support the price. Conversely, weaker capital expenditure, softer economic growth, currency effects, margin pressure or disappointing results could weigh on it. Technical indicators in the article are also mixed, so they do not provide a clear directional signal or reliable prediction of future price movements.
Should I invest in Siemens stock?
Whether you should invest in Siemens is a personal decision and cannot be determined from a share price forecast alone. The company has reported strong orders, revenue growth and higher guidance, but its shares remain exposed to industrial cycles, valuation changes, currency movements and the broader economy. Third-party price targets also differ considerably. Consider your own financial circumstances, time horizon and tolerance for loss, and remember that forecasts and past performance cannot determine future returns.
Can I trade Siemens CFDs on Capital.com?
Yes, you can trade Siemens CFDs on Capital.com. Trading share CFDs lets you speculate on price movements without owning the underlying asset and to take long or short positions. However, contracts for difference (CFDs) are traded on margin, and leverage amplifies both profits and losses. You should ensure you understand how CFD trading works, assess your risk tolerance, and recognise that losses can occur quickly.