PayPal stock forecast 2025-2050: Third-party PYPL price target
PayPal (PYPL) was quoted at $60.89 on Capital.com’s Share CFD market at 9:43am UTC on 4 December 2025. The price sat near the lower end of its intraday range between $60.60 and $63.61. Past performance is not a reliable indicator of future results. stock forecast: Can it reverse downtrend?")
PayPal’s share price continues to reflect the market’s reaction to PayPal’s third-quarter 2025 results, released on 28 October 2025. The update noted growth in transaction margin dollars, an increase in non-GAAP earnings per share and a rise in full-year earnings guidance (SEC). Coverage over recent weeks has also pointed to pressure on the stock following comments from PayPal’s chief financial officer about slower momentum in its branded checkout business (Barron's, 3 December 2025).
Past performance is not a reliable indicator of future results.
PayPal stock forecast 2026–2030: Analyst price target view
Third-party PayPal price forecasts published between October and early December 2025, generally sit between the mid-$60s and just above $100 per share. These are third-party projections, typically expressed as 12-month views rather than explicit year-end expectations, and use differing methods and assumptions.
BNP Paribas Exane
BNP Paribas Exane lowered its 12-month price target to about $69 and kept a neutral stance. Its update pointed to near-term uncertainty around competition and execution following a mixed reaction to recent earnings (MarketBeat, 2 December 2025).
Truist Securities
Truist Securities set a 12-month target of $66. According to analyst summaries, the firm adopted more cautious assumptions on growth and margins in light of PayPal’s guidance and the competitive digital-payments landscape (MarketScreener, 4 November 2025).
MarketBeat (consensus snapshot)
MarketBeat reported an average 12-month price target of $82 from 38 analysts as of December 2025, with individual forecasts ranging from $60 to $107. The service notes that its consensus reflects the most recent recommendation from each analyst over the prior year and spans buy, hold and sell ratings (MarketBeat, 4 December 2025).
TipRanks (consensus snapshot)
TipRanks showed an average 12-month price target of $83.10 from 30 Wall Street analysts. Estimates ranged from $66 to $105, reflecting differing expectations for PayPal’s earnings trajectory and competitive positioning within the wider technology sector (TipRanks, 4 December 2025).
Argus Research
Argus Research increased its target from $81 to $87 and maintained a positive rating. Its review cited revenue and profitability trends after PayPal’s third-quarter update, while acknowledging competition and macroeconomic conditions as ongoing risks (GuruFocus, 29 October 2025).
Predictions and third-party forecasts remain uncertain and cannot fully capture unexpected market developments. Past performance is not a reliable indicator of future results.
PYPL stock price: Technical overview
PayPal (PYPL) last traded at $60.89 at 9:43am UTC on 4 December 2025. The price sat just below the 10-day simple moving average (around 61.2) and below the 20/50/100/200-day averages at approximately 63.2, 66.9, 68.4 and 69.0. The 10-day EMA (near 62.1) runs modestly above the 10-day SMA, while the 20–200-day EMAs also sit above spot, placing PYPL under a descending moving-average band.
The 14-day RSI, around 40.5, sits in lower-neutral territory, while the ADX near 17.4 points to a modest, non-dominant trend. Classic pivots show initial topside reference at R1 near 69.4, with R2 around 76.0 becoming relevant only after a sustained daily close above the first resistance level.
On the downside, the Classic Pivot at 63.7 acts as an initial overhead reference rather than support, with the 100-day and 200-day SMAs (near 68.4 and 69.0) continuing to serve as higher-level markers above spot. Should price remain below these levels, focus stays on how it behaves around the broader moving-average cluster. The first clearer support sits near S1 at 57.0, with S2 around 51.3 coming into view only if the price extends lower. Oscillator signals are mixed: while the MACD shows an early buy signal, short-term momentum remains soft, consistent with consolidation under the long-term average band (TradingView, 4 December 2025).
This technical overview is for information only and isn’t financial advice.
PayPal share price history
Over the past two years, PYPL’s stock price has traded largely within a broad $55–95 range. It closed at $89.55 on 4 December 2024 and at $60.89 on 4 December 2025. The early-2025 rise above $95 in February and the July highs near $80 were followed by a gradual decline from August towards the low-$60s into year-end.
Earlier phases of upside – including the April–July 2024 move into the low-$70s – were interspersed with periods of steady retracement, reflecting shifts in sentiment around earnings, interest-rate expectations and broader tech-sector flows.
Past performance is not a reliable indicator of future results. Share prices are indicative and may differ from live market prices.
Capital.com analyst view
The PYPL stock price has fluctuated between roughly $55 and $95 over the past two years. In 2025, an early move into the mid-$90s was followed by a retreat towards the low-$60s by December. These movements align with changes in market sentiment across the technology and payments sector, with earnings updates and macroeconomic data often prompting periods of reassessment around growth, profitability and competition.
Several factors could continue to influence trading, including consumer-spending trends, digital-payments regulation, and moves in US equity indices and bond yields. Stronger transaction growth or tighter cost control may support earnings expectations, while softer volumes, regulatory changes or broader risk-off conditions could weigh on valuations. Past performance isn’t a reliable indicator of future results.
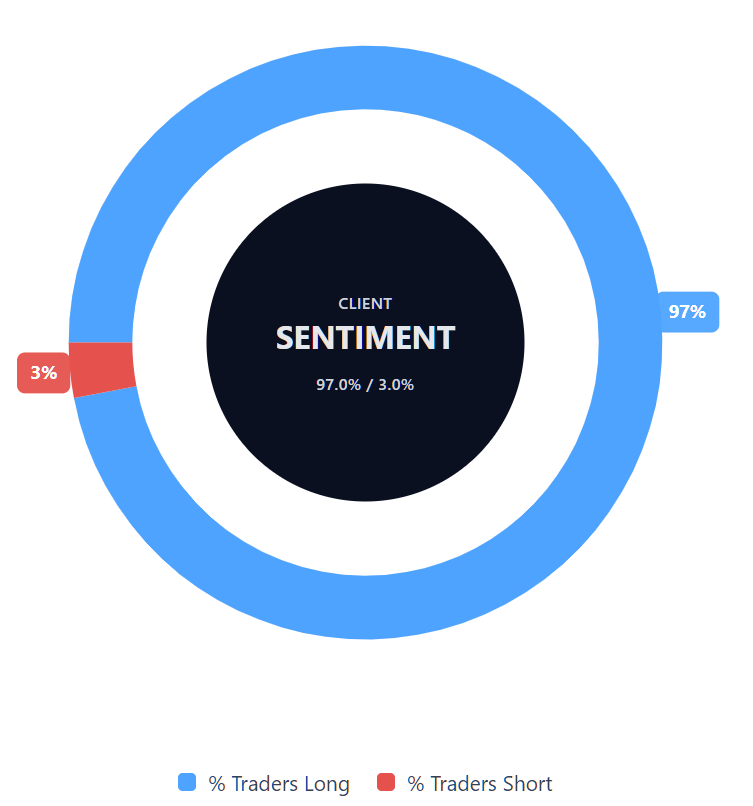
Capital.com’s client sentiment for PayPal CFDs
As of 4 December 2025, current client positioning towards PayPal CFDs on Capital.com shows around 97.0% buyers versus 3.0% sellers. This represents a one-sided tilt towards long positions. These figures reflect open positions on our platform and may shift as traders update their exposure.
Summary – PayPal price 2025
- PayPal began 2025 above $85, moved briefly above $95 in early February, then drifted lower towards the low-$60s by 4 December 2025.
- The stock experienced several swings, including a mid-year phase where it moved mostly between $70 and $80 before trending lower from August.
- Over two years, the overall pattern resembles a round trip, with 2024’s close near the high-$80s followed by a return to the $60–70 area despite periods of early-2025 strength.
- Client sentiment on Capital.com shows a strong tilt towards buyers at around 97% versus roughly 3% sellers, noting that this snapshot can change as positions update.
Past performance is not a reliable indicator of future results.
FAQ
Who owns the most PayPal stock?
PayPal’s shareholder base is largely made up of institutional investors, including asset managers, pension funds and index-tracking funds. These holdings can change as portfolios rebalance or as institutions update their positions. Individual investors and employees also hold shares. For the latest breakdown, it’s best to refer to recent regulatory disclosures, as ownership data is updated periodically.
What is the 5-year PayPal stock forecast?
This article doesn’t cover five-year forecasts, and longer-term projections aren’t published as consistently as 12-month analyst targets. As of 4 December 2025, third-party PayPal stock predictions – issued between October and December 2025 – ranged from the mid-$60s to just above $100 per share, clustering around the low-$80s. Any longer-term estimates can vary widely across analysts and methodologies. Forecasts aren’t guaranteed and can change without notice.
Is PayPal a good stock to buy?
The article doesn’t give a view on whether PayPal is a good stock to buy. It reports on price moves, analyst targets and technical indicators to provide context only. Whether PayPal is right for you depends on your personal circumstances, risk tolerance and approach to trading or investing. This information is educational and isn’t investment advice.
Could PayPal stock go up or down?
According to the article, PayPal’s share price may respond to several factors, including earnings updates, competition in digital payments, consumer-spending trends, regulatory developments and movements in major US equity indices. Analysts referenced in the piece presented a broad target range, indicating that both upside and downside outcomes are possible. Market prices can move in either direction, and past performance isn’t a reliable indicator of future results.
Should I invest in PayPal stock?
The article doesn’t recommend whether you should invest in PayPal. It summarises recent data and commentary to help you understand the context around the share price. Any decision to invest should be based on independent research and your personal approach to risk. Nothing in the article constitutes investment advice.
How can I trade PayPal CFDs with Capital.com?
You can trade PayPal CFDs on Capital.com by opening an account and accessing the Share CFDs market, where you can go long or short on the price. The platform offers real-time charts, a wide range of indicators, price alerts and risk-management tools such as stop-losses*. Contracts for difference (CFDs) let you speculate on price movements without owning the underlying shares, but they’re traded on margin – leverage amplifies both profits and losses.
*Standard stop-loss orders are not guaranteed. Guaranteed stop-loss orders (GSLOs) incur a fee if activated.