Oil forecast: Third-party price targets
Oil prices have moved through several distinct phases in recent years, shaped by shifts in supply, demand and broader market conditions. From sharp rallies to extended pullbacks, both WTI and Brent crude have reflected changing expectations across global energy markets.
WTI crude oil (US crude) is trading around $58.41 per barrel in intraday trading, after moving between a low of $56.37 and a high of $58.44 based on Capital.com pricing at 10:49am UTC on 6 January 2026. Meanwhile, UK oil (Brent crude) is trading around $61.94 per barrel, close to the top of its intraday range between $59.88 and $61.99, as of 10:49am UTC on 6 January 2026. Past performance is not a reliable indicator of future results.
Intraday price movements are unfolding amid continued market attention on geopolitical developments in Venezuela, where recent US actions involving President Nicolás Maduro have contributed to a modest risk premium across crude benchmarks (Bloomberg, 6 January 2026). Price action is also taking place against a backdrop of a slightly softer US dollar, after the Dollar Index eased from recent highs near 98.8 (Trading Economics, 6 January 2026).
Oil price forecast 2026-2030: Analyst price target view
As of 6 January 2026, third-party oil price predictions generally cluster in the low- to mid-$50s per barrel range for annual averages, with some variation across agencies and banks. The figures below primarily reflect forecast annual average spot or benchmark prices, rather than specific year-end targets, and are typically framed around expectations for supply growth, demand trends and inventory balances.
Brent and WTI crude oil price forecasts
Reuters (consensus poll)
A Reuters poll of analysts reported in early January 2026 that US crude is projected to average around $58.15 per barrel in 2026, slightly below the prior November consensus of approximately $59.00. The survey highlights expectations for ample supply and a relatively balanced market, with respondents citing rising non-OPEC output as a key factor (Reuters, 5 January 2025).
Goldman Sachs (house view)
Goldman Sachs has been cited as expecting Brent crude to average around $56 per barrel, with WTI near $52 per barrel in 2026, below prevailing forward curves as of mid-November 2025. The bank notes that higher-than-expected supply growth alongside a softer demand profile could keep prices under pressure across the 2025–2026 period (BOE Report, 17 November 2025).
J.P. Morgan (commodities research)
J.P. Morgan’s commodities research team, as referenced in industry coverage, forecasts WTI crude averaging about $65 per barrel in 2025 and around $54 per barrel in 2026. The bank points to factors such as strategic stockpiling, evolving sanctions affecting Russian exports, and a gradual moderation in demand growth as shaping a relatively contained price trajectory (Rigzone, 16 December 2025).
Macquarie / BMI–Fitch (research assumptions)
Research excerpts circulated via industry reports show Macquarie expecting WTI to average approximately $57.25 per barrel in 2026, while BMI, part of Fitch Solutions, projects a front-month WTI average closer to the low-$60s per barrel range for the same year, based on assumptions published in early December 2025. These institutions generally highlight the interaction between robust US and non-OPEC supply, slowing but still positive demand growth, and ongoing geopolitical and sanctions-related uncertainties (Investing.com, 31 December 2025).
US Energy Information Administration (Short‑Term Energy Outlook)
The US EIA’s December 2025 Short-Term Energy Outlook indicates a Brent spot price forecast averaging around $55.08 per barrel in 2026, with quarterly projections centred on the mid-$50s per barrel range. The agency’s outlook suggests prices may ease from late-2025 levels into early 2026, reflecting expectations that growing global oil production and rising inventories could outweigh demand. OPEC+ policy decisions and China’s inventory trends are cited as important variables influencing the extent of any price adjustment ( U.S. Energy Information Administration, 9 December 2025).
Past performance is not a reliable indicator of future results. Projections and third-party forecasts are not recommendations and may not reflect actual future performance, as they cannot account for unforeseen events or changing market conditions.
Crude oil: Technical view
Brent crude oil is trading near $61.94 as of 10:49am UTC on 6 January 2026, holding just above the Classic Pivot at $61.24 and below first resistance at $63.80, within a relatively tight intraday range. The 20-, 50-, 100- and 200-day simple moving averages sit between roughly $61.3 and $66.0, with shorter-dated averages positioned below longer-dated levels, suggesting a neutral-to-cautious technical structure. The 14-day RSI near 51 remains mid-range, while the ADX around 23 indicates only a modestly developed trend.
A daily close above $63.80 could bring the R2 zone near $66.60 into focus, while a break below the pivot would shift attention toward the S1 area around $58.40 (TradingView, 6 January 2026).
US crude technical analysisUS crude oil is trading around $58.41 per barrel as of 10:49am UTC on 6 January 2026, holding modestly above the Classic Pivot at $57.68 and below the R1 area near $60.39. On the daily chart, price remains supported above the short-term 10-, 20- and 30-day simple moving averages clustered around the high-$57 to low-$58 area, while the 50-, 100- and 200-day SMAs between roughly $58.8 and $62.6 continue to cap the upside. The 14-day RSI near 52.6 sits in neutral territory, while the ADX around 19.6 points to a weak trend environment rather than a strong directional move. A sustained break above R1 could bring R2 near $63.19 into view, while a move below the pivot risks exposing S1 around $54.87 (TradingView, 6 January 2026). |
Brent crude technical analysisBrent crude oil is trading near $61.94 as of 10:49am UTC on 6 January 2026, holding just above the Classic Pivot at $61.24 and below first resistance at $63.80, within a relatively tight intraday range. The 20-, 50-, 100- and 200-day simple moving averages sit between roughly $61.3 and $66.0, with shorter-dated averages positioned below longer-dated levels, suggesting a neutral-to-cautious technical structure. The 14-day RSI near 51 remains mid-range, while the ADX around 23 indicates only a modestly developed trend. A daily close above $63.80 could bring the R2 zone near $66.60 into focus, while a break below the pivot would shift attention toward the S1 area around $58.40 (TradingView, 6 January 2026). |
This is technical analysis for informational purposes only and does not constitute financial advice or a recommendation to buy or sell any instrument.
Oil price history
US crude history
US crude oil (WTI) spent much of 2024 trading within a broad $70–80 per barrel range, with several spikes above $80 around April and July before retreating towards the low-$70s into year-end. Prices then rolled over during late 2024 and early 2025, slipping from closing levels near $71–72 at the end of December 2024 into the low-$70s and upper-$60s by March, before rallying sharply towards $85 in mid-April 2025. This move was followed by a pullback, with prices easing into the low-$60s by early June.
The remainder of 2025 saw WTI gradually ease from early-summer highs around $70–75 into the mid-$60s and later the high-$50s, with the market closing the year at $57.35 on 31 December 2025 and edging slightly higher to around $58.40 by 6 January 2026.
Past performance is not a reliable indicator of future results. Share prices are indicative and may differ from live market prices.
Brent crude history
Brent crude has spent much of the past two years trading within a wide price band, ranging from the mid-$70s to $80s in early 2024, before shifting into the mid-$60s to $70s for much of 2025 and sliding towards the low-$60s around the turn of 2026. The benchmark closed 2024 at approximately $74.82 on 31 December, before rising to around $80–82 during January and February 2025. Prices then eased from the mid-$70s into the high-$60s over the spring and early summer, following a retreat from peaks above $89 in mid-April 2024.
After a brief move towards the $78 level in late June 2025, Brent continued to drift lower through the second half of the year, slipping from levels above $70 earlier in the year to around $63–69 between August and October, before settling into the low-$60s by December as volatility moderated. By 6 January 2026, Brent crude was trading at around $61.94, leaving it approximately $12–13 below levels seen in early January 2025 and marking a shift away from the higher price environment that characterised much of 2024.
Past performance is not a reliable indicator of future results.
Capital.com analyst outlook
Capital.com analysts note that Brent crude reflects similar cross-currents between geopolitics and supply expectations. Kyle Rodda points out that OPEC’s response has been measured, observing that the group 'is in no rush to recalibrate output' and has instead emphasised market stability, even as prices trend lower.
Rodda adds that despite geopolitical risk, 'OPEC isn’t rushing to put a strong floor under prices', suggesting a wait-and-see approach in the face of building global supply. From a technical perspective, he notes that crude markets remain in a broader downtrend, with key moving averages acting as resistance rather than support.
Safieddine echoes this balanced view, highlighting that broader energy benchmarks have so far avoided outsized moves, as expectations for longer-term supply growth continue to temper immediate risk premiums linked to geopolitical events.
WTI crude oil outlookCapital.com analyst Kyle Rodda notes that developments in Venezuela introduce 'two-sided risks when it comes to the energy complex', with the potential for near-term supply disruption offset by longer-term expectations of increased output. He explains that while instability may imply upside risk in the short term, 'unlocking Venezuela’s vast crude reserves… is a long process', meaning any additional supply is 'potentially years away'. From a market-structure perspective, Rodda adds that 'the most informational value could be in the shape of the futures curve', particularly how shorter-dated contracts reflect disruption risk while longer-dated prices respond to expectations of more ample supply. Meanwhile, Monte Safieddine, Head of Research at Capital.com, observes that despite the geopolitical developments, 'movement has been relatively contained', noting that this reflects a market already pricing in ample supply. |
Brent crude outlookCapital.com analysts note that Brent crude reflects similar cross-currents between geopolitics and supply expectations. Kyle Rodda points out that OPEC’s response has been measured, observing that the group 'is in no rush to recalibrate output' and has instead emphasised market stability, even as prices trend lower. Rodda adds that despite geopolitical risk, 'OPEC isn’t rushing to put a strong floor under prices', suggesting a wait-and-see approach in the face of building global supply. Safieddine echoes this balanced view, highlighting that broader energy benchmarks have so far avoided outsized moves, as expectations for longer-term supply growth continue to temper immediate risk premiums linked to geopolitical events. |
Capital.com’s client sentiment for oil CFDs
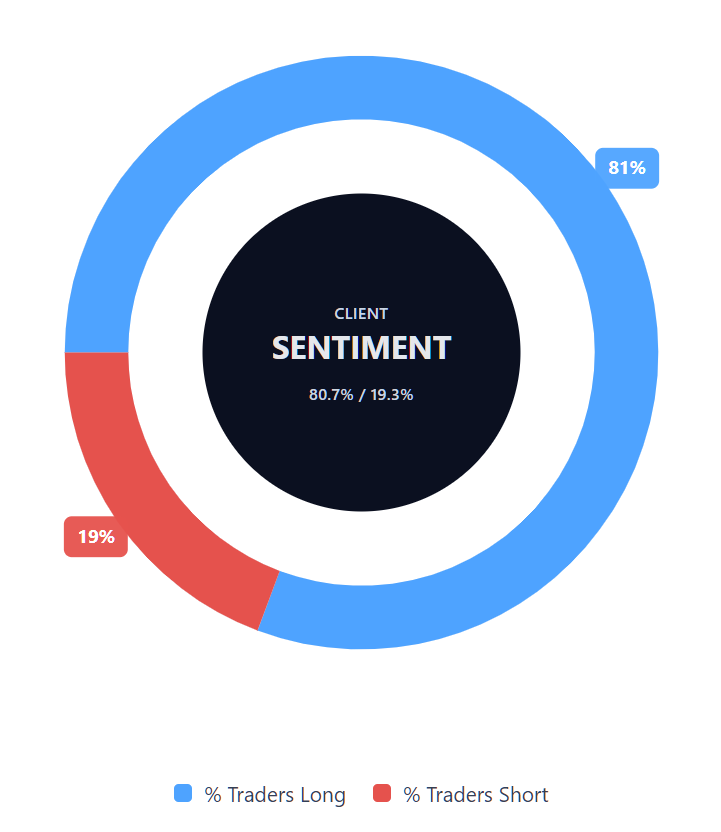
US crude sentiment
As of 6 January 2026, Capital.com client positioning in US crude oil CFDs currently stands at approximately 80.7% buyers versus 19.3% sellers, placing sentiment firmly skewed towards long positions and leaving buyers ahead by around 61 percentage points. This imbalanced positioning indicates that client exposure is currently concentrated on the upside, rather than being evenly distributed between long and short positions, with comparatively fewer clients holding short exposure at this point in time.
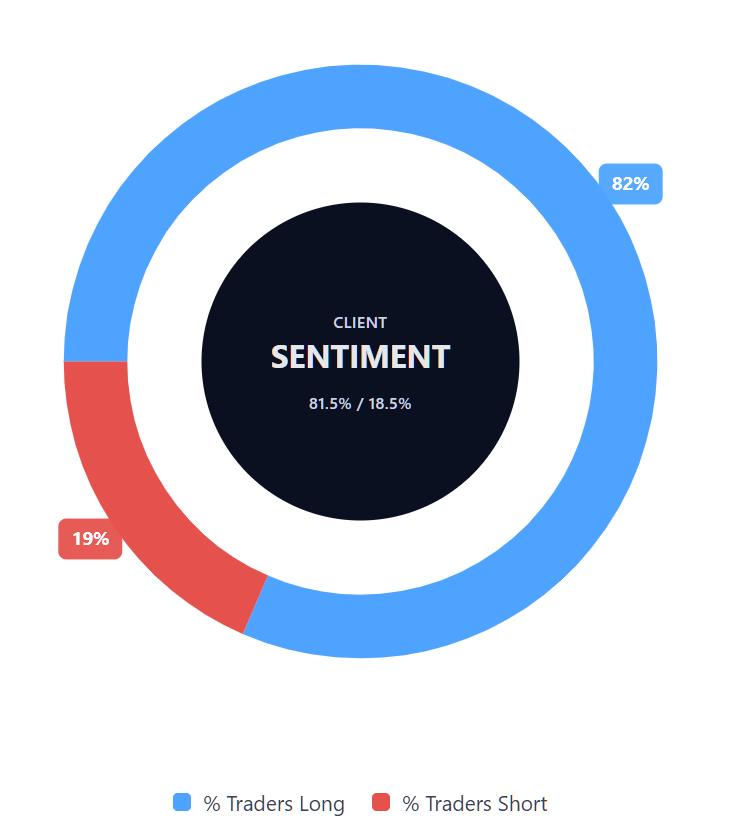
Brent crude sentiment
Capital.com client positioning in Brent crude CFDs shows 81.5% buyers versus 18.6% sellers, a heavy‑buy skew that puts buyers ahead by about 62.9 percentage points and indicates a one‑sided tilt toward longs. This snapshot reflects open positions on Capital.com and can change as traders react to fresh market news, price moves and macro data.
The data reflects open positions held by Capital.com clients and may change over time as positions are opened, adjusted or closed.
Summary – oil price 2026
US crude summary
Brent crude summary
Past performance is not a reliable indicator of future results.
FAQ
What is the oil price forecast?
Oil price forecasts typically refer to third-party analyst expectations for future average prices, based on assumptions around supply, demand, inventories and broader macroeconomic conditions. In this article, forecasts for 2026 generally cluster in the low-$50s to low-$60s per barrel range for both WTI and Brent crude, according to estimates from banks, agencies and industry surveys. These projections are most often expressed as annual averages rather than precise price targets and remain subject to change as market conditions evolve.
Could oil prices go up or down?
Oil prices can move in either direction and are influenced by a wide range of factors, including global supply levels, demand trends, geopolitical developments, currency movements and inventory data. As a result, prices may rise or fall over different time horizons, sometimes with heightened volatility. Forecasts and technical indicators can offer context on how analysts and market participants currently view these dynamics, but they cannot account for unexpected events or guarantee future price movements.
Should I invest in oil?
This article does not provide investment advice or recommendations. Whether oil exposure is appropriate depends on individual circumstances, including financial goals, risk tolerance and market understanding. Oil-related instruments can be volatile, and prices may move against expectations. Anyone considering exposure to oil markets should ensure they understand the risks involved and how different products work before making any trading decisions.
How can I trade oil CFDs on Capital.com?
With Capital.com, you can trade oil CFDs, which allow you to speculate on price movements in instruments such as WTI and Brent crude without owning the underlying asset. Contracts for difference (CFDs) let you take both long and short positions, meaning you can trade both rising and falling prices. However, CFDs are traded on margin. Leverage amplifies both potential profits and potential losses.