

Silver price forecast: Fed policy, US data
Silver spot (XAG) is trading near $64.81 after pulling back from late-August highs, as markets price in a higher probability of a September Federal Reserve rate hike. Explore third-party Silver price targets and technical analysis. Past performance is not a reliable indicator of future results.
Silver (XAG/USD) is trading around $64.809 in early afternoon trading at 12:44pm UTC on Tuesday, 1 September 2026, within an intraday range of $64.58–$67.353. Past performance is not a reliable indicator of future results.
The retreat comes as markets assign a higher probability to a Federal Reserve interest-rate increase this month. After Fed Chair Kevin Warsh said at the Jackson Hole summit that policymakers still have 'work to do' on inflation, the CME FedWatch Tool showed the implied probability of a September hike rising to roughly 60–65%, from about 36–40% beforehand (FXStreet, 31 August 2026). Silver also remained under pressure during renewed Middle East tensions, as oil prices rose after US strikes on Iranian military targets prompted threats of retaliation from Tehran (Ad-Hoc-News, 27 August 2026). Meanwhile, the US dollar index traded near 99.4 (Trading Economics, 31 August 2026).
Silver price forecast (third-party price targets): Fed rate-hike expectations rise
As of 1 September 2026, third-party Silver predictions vary considerably, as institutions weigh a persistent structural supply deficit against renewed Federal Reserve rate-hike expectations following Fed Chair Kevin Warsh's Jackson Hole remarks. The following forecasts show the range of institutional views published during this period.
Citi (six- to 12-month target)
Citi reiterates a price target of $90 per ounce over the next six to 12 months, alongside an unchanged near-term target of $75 for the following zero to three months, as of 14 August 2026. The bank cites stronger investment demand offsetting softer industrial consumption, with an eventual de-escalation of the Strait of Hormuz crisis and a less hawkish Federal Reserve among the conditions underpinning its view (TheStreet, 14 August 2026).
Goldman Sachs (2026 average forecast)
Goldman Sachs projects an average silver price of $85–$100 per ounce for 2026, alongside its end-2026 gold target range of $4,900–$5,400 per ounce. The bank also points to elevated client demand for call options targeting $90 silver within the broader precious-metals rally, as of 21 August 2026 (PrimeXBT, 21 August 2026).
J.P. Morgan Global Research (fourth-quarter and annual forecast)
J.P. Morgan sets a fourth-quarter 2026 silver target of $63 per ounce and a full-year average of $70 per ounce, after trimming the estimates from previous levels of $85 and $84, respectively. The bank attributes the reduction to an anticipated unwind of physical-market tightness and a projected decline in photovoltaic-sector silver demand (J.P. Morgan Global Research, 13 August 2026).
UBS (year-end 2026 target)
UBS maintains a year-end 2026 silver target of $80.22 per ounce, unchanged despite the metal's pullback towards $66 following Warsh's remarks, which revived expectations of a September rate hike. The bank continues to cite a narrowed but still-present 2026 supply deficit in support of its year-end projection, as of 29 August 2026 (exchangerates.org.uk, 29 August 2026).
Commerzbank (year-end 2026 forecast)
Commerzbank projects that silver could consolidate near $59 per ounce by the end of 2026, below prevailing market prices at the time of publication. The bank describes this as a moderation of the recent rally rather than a full reversal, while noting the pace of 2026's gains and maintaining that underlying fundamental factors remain supportive, as of 30 August 2026 (finanzen.net, 30 August 2026).
Predictions and third-party forecasts are inherently uncertain, as they cannot fully account for unexpected market developments. Past performance is not a reliable indicator of future results.
Latest and upcoming market context
Silver spot traded within a $64.58–$67.353 range on 1 September 2026, extending a pullback from August's advance after Federal Reserve Chair Kevin Warsh's Jackson Hole remarks raised the market-implied probability of a September rate hike to around 60%, from roughly 35% beforehand, according to Brown Brothers Harriman (FXStreet, 31 August 2026).
US economic data added further context. The ISM Manufacturing PMI for August came in at 55.2, down from 55.6 in July, while July JOLTS job openings data was also released on 1 September 2026 (Investing.com, 1 September 2026).
On the industrial-demand side, Shanghai Metals Market reported that China's silver output rose 0.5% month on month in August, with cumulative 2026 production up 4.7% year on year. At the same time, photovoltaic-sector demand had yet to show signs of recovery, while elevated silver prices had weighed on downstream purchasing, according to the report (SMM, 1 September 2026).
Attention now turns to a series of US data releases ahead of the Federal Reserve's Federal Open Market Committee meeting on 15–16 September 2026. The ADP private payrolls report is due on 2 September, followed by the ISM Services PMI on 3 September and the August Nonfarm Payrolls report on 4 September (Federal Reserve, 19 August 2026). Market participants have also highlighted the August Consumer Price Index report, due on 11 September 2026, as another indicator likely to inform interest-rate expectations (FXStreet, 31 August 2026).
Silver price: technical overview
As of 12:44pm UTC on 1 September 2026, Silver spot trades just below its 20-day moving average. The 20-, 50-, 100- and 200-day simple moving averages sit at roughly 65.9, 61.5, 68.1 and 71.9, respectively. The 20-day average remains above the 50-day average, while the spot price sits below the longer-dated averages, according to data compiled by TradingView.
Momentum indicators remain mixed. The 14-day relative strength index stands near 49.5, close to the midpoint of its 0–100 scale, while the 14-day average directional index is near 19.7, below the 25 threshold often used by technical analysts to identify a stronger trend. Taken together, the readings do not indicate a clear directional signal based on TradingView data.
The nearest topside reference is the classic pivot resistance (R1) near 72.9, with the next calculated pivot resistance (R2) near 79.3, according to TradingView's pivot calculations.
On the downside, the classic pivot point near 64.7 sits just below the last price, while the 50-day simple moving average near 61.5 provides another technical reference. The S1 pivot lies below both levels at around 58.3, according to TradingView (TradingView, 1 September 2026).
This is technical analysis for informational purposes only and does not constitute financial advice or a recommendation to buy or sell any instrument.
Silver price history (2024–2026)
The Silver spot price started September 2024 trading around $28.54, before moving gradually higher through late 2024 and 2025 during a period of persistent inflation concerns and continued interest in precious metals.
The move accelerated into the end of 2025, with silver closing the year at $71.65 before reaching an all-time high close of $117.67 on 29 January 2026. The intraday high reached $121.69. That advance was followed by a rapid reversal: prices fell to $67.27 by 5 February 2026 as positioning unwound, then extended lower to $58.02 by early April during broader risk-off market moves.
Silver recovered through May, moving back above $87 by 13 May 2026, before another pullback took prices into the low $50s by mid-June. August brought another period of gains, with silver rising from the mid-$50s to $71.21 on 28 August before easing to close at $64.90 on 1 September 2026.
As a result, silver is down around 9.4% year to date but up roughly 127.4% year on year, highlighting the scale of the price swings seen over the two-year period.

Past performance is not a reliable indicator of future results. Prices are indicative and may differ from live market prices.
Silver price outlook: Capital.com analysis
Silver spot's performance across 2025 and into 2026 has been marked by large price swings rather than a sustained move in one direction. The metal rose from around $28 to an all-time high close near $117.67 on 29 January 2026 before falling sharply in the weeks that followed. Volatility remained elevated later in the year, with prices approaching $71 in August before easing below $65 by early September. These moves occurred alongside changes in Federal Reserve rate expectations and fluctuations in the US dollar index.
Industrial demand from sectors such as solar panel manufacturing and electronics remains one factor shaping the silver market, but that exposure can work in both directions. A slowdown in photovoltaic output or broader manufacturing activity could reduce consumption, while stronger industrial demand could have the opposite effect. Currency and rate expectations can also influence pricing: periods of a softer US dollar or lower interest-rate expectations have coincided with higher silver prices, while more hawkish policy expectations have coincided with some pullbacks. These relationships vary over time and do not determine future price movements.
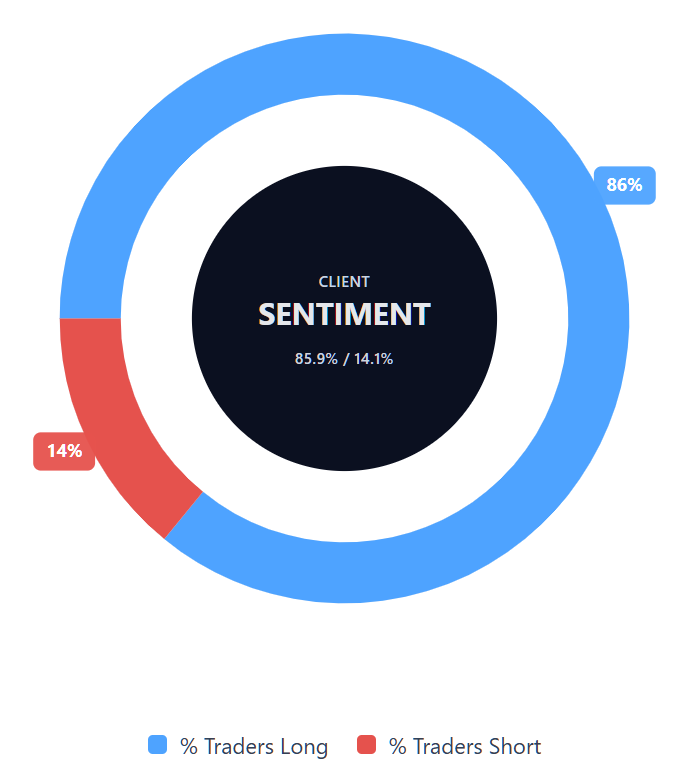
Capital.com’s client sentiment for Silver CFDs
As of 1 September 2026, Capital.com client positioning in Silver spot CFDs shows 85.9% long versus 14.1% short, meaning long positions account for the majority of open positions in this snapshot. The gap between long and short positioning is 71.8 percentage points. This snapshot reflects open positions on Capital.com and can change.
Summary – Silver price 2026
- As of 12:44pm UTC on 1 September 2026, silver spot (XAG) traded near $64.809, within an intraday range of $64.58–$67.353.
- According to TradingView data, technical indicators present a mixed picture, with the 14-day RSI near 49.5 and ADX near 19.7, neither of which indicates a clear directional trend on its own.
- Key factors cited by market sources include shifting Federal Reserve rate expectations following Kevin Warsh's Jackson Hole remarks, movements in the US dollar index and softening photovoltaic-sector industrial demand.
- Near-term market attention is focused on upcoming US labour-market and inflation data, alongside a divergent range of bank price targets of $59–$100 for 2026.
Past performance is not a reliable indicator of future results.
FAQ
What is the silver price forecast?
Third-party forecasts for silver in 2026 vary widely. The forecasts covered in this article range from around $59 per ounce at Commerzbank to $100 per ounce in Goldman Sachs' upper case, with Citi, UBS and J.P. Morgan presenting different intermediate targets. These projections reflect varying assumptions about supply, industrial demand and Federal Reserve policy. Forecasts aren't reliable indicators of future performance and may change as market conditions develop.
Could silver's price go up or down?
Yes. Silver prices can move in either direction, and recent history shows periods of both sharp gains and substantial declines. Factors discussed in this article include Federal Reserve interest-rate expectations, movements in the US dollar, industrial demand, particularly from the photovoltaic sector, and changes in physical supply. Technical indicators may provide additional context, but they don't predict future prices. Unexpected economic, geopolitical or market developments can also affect silver's price.
Should I invest in silver?
Whether silver is suitable for you depends on your individual circumstances, objectives and attitude to risk, so this article can't tell you whether to invest. Silver has experienced substantial price swings, and past performance doesn't indicate future results. If you're considering gaining exposure to silver, it's important to understand the relevant risks and how different products work. CFDs are leveraged instruments, meaning both gains and losses can be amplified, and losses can occur rapidly.
Can I trade silver CFDs on Capital.com?
Yes, you can trade Silver CFDs on Capital.com. Trading commodity CFDs lets you speculate on price movements without owning the underlying asset and to take long or short positions. However, contracts for difference (CFDs) are traded on margin, and leverage amplifies both profits and losses. You should ensure you understand how CFD trading works, assess your risk tolerance, and recognise that losses can occur quickly.