American Express stock forecast: Third-party price targets
Discover the latest third-party American Express stock forecasts, including AXP share price performance, and CFD client sentiment.
American Express (AXP) last traded at $331.89 as of 2:22pm UTC on 7 October 2025, moving within an intraday range of $326.62-$333.45.
Market sentiment remains bullish, with 93.44% of positions currently long. Elevated US 10-year Treasury yields near 4.6% have also lent support to financial sector shares, reinforcing positive momentum in AXP’s price action (MarketBeat, 5 October 2025).
American Express stock forecast: Analyst price target view
Morgan Stanley (house view)
Morgan Stanley sets a 12-month price target of $362, citing resilient premium-card spending and continued cross-selling growth supported by steady consumer confidence (TipRanks, 29 September 2025).
Truist Financial (research update)
Truist Financial raises its 12-month price target to $375. Analysts point to solid fee-income growth and stable credit performance, alongside consistent cardholder engagement (MarketBeat, 19 September 2025).
Wells Fargo & Company (equity strategy)
Wells Fargo increases its target to $375, referencing higher net-interest revenue expectations and larger average borrowing balances through the third quarter (TipRanks, 5 September 2025).
Keefe, Bruyette & Woods (equity report)
KBW lifts its target to $394, with analysts highlighting digital-platform improvements and a strengthened rewards ecosystem as key contributors to revenue growth (AInvest, 2 October 2025).
Forecasts and market projections are inherently uncertain and subject to change. They do not account for unexpected economic or geopolitical developments. Past performance is not a reliable indicator of future outcomes.
AXP stock price: Technical overview
On the daily chart, AXP continues to trade above its key moving average cluster – the 20-, 50-, 100- and 200-day moving averages (DMAs) – positioned around 334 / 331 / 312 / 299. The 20-over-50 alignment remains intact, keeping the short-term trend broadly stable. Momentum appears balanced, with the RSI (14) at 52.4, sitting in the upper-neutral range.
The first resistance area to monitor is near the 334 pivot; a daily close above this level could bring the 360 region into focus. On the downside, initial support lies around the 319 pivot, followed by the 100-DMA near 312. A decisive move below the 100-DMA may open the way toward the 299 area (TradingView, 7 October 2025).
This technical overview is provided for informational purposes only and does not constitute financial advice or a recommendation to buy or sell any instrument.
American Express share price history
American Express (AXP) closed at $331.89 on 7 October 2025, up from about $149 in early October 2023. The share price peaked near $349 in late September 2025, briefly dipped to the mid-$180s in December 2023, then recovered in a steady rally through 2024 and into 2025.
Past performance is not a reliable indicator of future results. Share prices are indicative and may differ from live market prices.
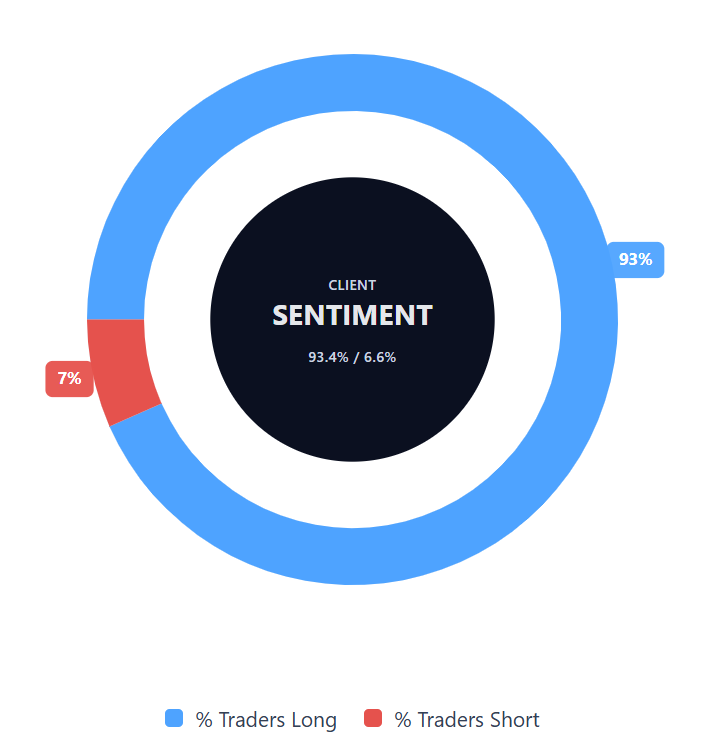
Capital.com’s client sentiment for American Express CFDs
Client positioning on Capital.com indicates a strong buying bias in American Express CFDs, with 93.4% of positions currently long and 6.6% short – a difference of 86.8 percentage points (7 October 2025). This data represents a snapshot of open positions on the Capital.com platform and is subject to change as market activity evolves.
FAQ
Is American Express a good stock to buy?
Capital.com does not provide investment advice. Analyst sentiment towards American Express ranges from neutral to positive, with references to sound fundamentals and ongoing growth in premium card usage. However, forecasts and projections are subject to change and cannot account for unforeseen market events. Past performance is not a reliable indicator of future results.
Could American Express stock go up or down?
The American Express share price could rise or decline depending on consumer spending patterns, interest rate changes and wider market sentiment. Price movements are common and should be viewed with appropriate risk management and awareness of volatility.
Should I invest in American Express stock?
Any decision to invest in American Express should be based on personal objectives, risk appetite and a full understanding of the product. Contracts for difference (CFDs) are traded on margin, and leverage can amplify both profits and losses. Ensure you fully understand how CFDs work before trading.
What does Capital.com client sentiment show for AXP CFDs?
Capital.com clients currently display a strong long bias, with 93.4% of open positions in American Express CFDs held by buyers. This represents a real-time snapshot of open positions, which may change as market conditions evolve.