What is a dead cat bounce?

Dead cat bounce meaning
A dead cat bounce is a brief price recovery after a sharp decline – typically followed by a return to the downtrend. The term comes from the idea that even a dead cat will bounce if it falls from a great height, and was popularised in financial journalism in the 1980s.
In trading, the ‘bounce’ refers to a short-lived rally within a broader bearish trend. It’s most commonly seen in share CFD markets, but can also appear in indices, forex, and commodities.
On a chart, it shows up as a quick rebound after a steep drop, often drawing in traders expecting a reversal — even though the overall trend remains negative.
What is a dead cat bounce in the stock market?
In stock trading, a dead cat bounce refers to a short-lived rally in share prices after a sharp drop – often during a prolonged downtrend. It’s common in bear markets, where a brief uptick interrupts continued declines.
This bounce is driven by trading psychology. Some traders see falling prices as a buying opportunity, while others close short positions, creating upward momentum. Optimism can attract more buyers – but without real improvement in fundamentals, the rally is usually unsustainable.
Once sentiment shifts, selling often resumes and the downtrend continues, though prices don’t always fall below the previous low straight away.
How to identify a dead cat bounce
Identifying a dead cat bounce relies on spotting three clear stages on a price chart: a sharp drop, a short-lived rally, and a subsequent continuation of the downtrend. Here’s a step-by-step:
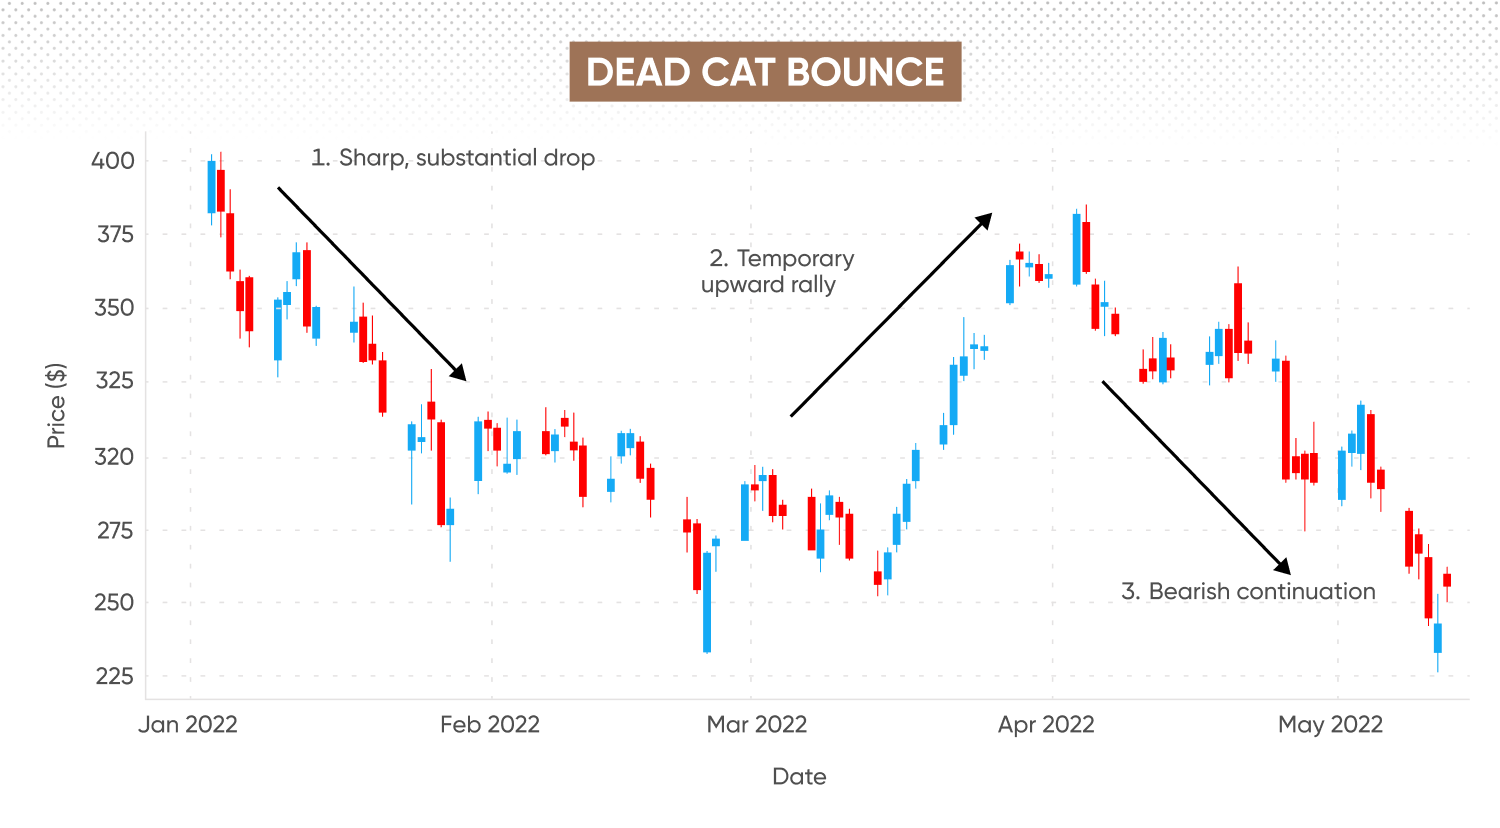
- 1. Look for a sharp initial declinePrices experience a sudden and significant drop, which can signal strong selling pressure when accompanied by increased trading volume. This phase may set the stage for subsequent lower lows if the downtrend continues after a brief recovery.
- 2. Identify a temporary upward rallyA brief, reactionary price recovery follows the sharp decline. Lower trading volume relative to the prior sell-off may indicate limited conviction behind the rebound. This rally may stall at key resistance levels, such as previous supports, moving averages, or Fibonacci retracements, but this is not always the case.
- 3. Confirm the continuation of the downtrendPrices fail to sustain the upward momentum and start falling again, sometimes marked by a break below recent lows. Increased trading volume may help to confirm renewed selling pressure, but declines can also persist with average volume, depending on broader sentiment.
Learn more with our guide to 12 chart patterns for CFD traders.
Dead cat bounce pattern vs recovery rally
Dead cat bounces and recovery rallies can look similar on a chart, but they’re distinct in these key areas:
|
Dead cat bounce |
Recovery rally |
|
|
Trend context |
Within a continuing downtrend |
Often occurs after a significant decline; may indicate a potential shift |
|
Duration |
Brief, typically days to weeks |
Longer-lasting, sometimes marking a trend reversal |
|
Volume/confirmation |
Volume can be inconsistent and may not confirm a lasting change |
May be accompanied by increasing volume and improved sentiment, though confirmation can lag |
|
Fundamental drivers |
Little change, bearish outlook |
Frequently associated with a positive shift in news or data, but can also arise from technical factors |
-
A dead cat bounce is a short-lived rebound that occurs during a broader downtrend, which can sometimes give a false signal of recovery before further declines.
-
A recovery rally may signal the start of a more sustained move higher, often supported by changes in fundamentals or sentiment, but not exclusively so.
How to tell them apart
Distinguishing between the two comes down to confirmation. After the initial rebound, look for signs the rally can sustain itself – such as prices breaking key resistance levels, rising volume, or improved macroeconomic or company‑specific news.
A dead cat bounce may stall at resistance or lose momentum as sellers return, though this is not always immediate or clear-cut. In contrast, a genuine recovery rally tends to set higher highs and is supported by broader participation.
Dead cat bounce in stocks and trading strategy
The dead cat bounce is a familiar feature of volatile equity markets. Spotting the pattern is one thing – trading around it is another. For traders using contracts for difference (CFDs), understanding how this pattern behaves in real time is essential for risk management and decision-making.
How the pattern plays out in stocks
A typical dead cat bounce in stocks starts after a sharp sell-off, when short-term buyers step in, hoping to profit from a potential recovery. This rebound can pause near previous support-turned-resistance, or stall at technical zones such as moving averages or retracement levels. What sets it apart from a genuine recovery is that the bounce fades quickly, with sellers regaining control as soon as the optimism ebbs.
Unlike sustained rallies, dead cat bounces are typically characterised by lower volume or an absence of strong positive catalysts. While the price may rise for a few sessions, momentum can stall below key resistance. The underlying bearish trend remains dominant, and the market may make new lows once the bounce is exhausted.
Strategy considerations for CFD traders
Trading a dead cat bounce requires caution. Entering long positions too early – before confirmation of a true reversal – can be risky, as the bounce may reverse abruptly and resume its decline. Cautious traders may choose to avoid buying into the rebound unless there are possible signals of trend reversal, such as a breakout above resistance and heightened volume, though these do not guarantee a sustained recovery.
Instead, some traders use the bounce as a potential short-selling opportunity, particularly if the rally struggles at known resistance zones. Common technical tools include marking out Fibonacci retracement levels (with shallow retracements, such as less than 38.2%, often indicative of a dead cat bounce), prior support and resistance, and monitoring for bearish signals on oscillators like RSI or MACD. Waiting for confirmation – such as a failed test of resistance or renewed selling pressure – can help filter out false signals.
Managing risk
As with any pattern-based approach, risk management is key. This includes using stop-loss orders above recent highs or key resistance levels if entering short, and sizing positions appropriately to account for volatility. Keep an eye on broader market sentiment and upcoming news, as unexpected events can alter the expected pattern.
Real examples of dead cat bounce events
Example 1: Tesla (TSLA) shares in 2022
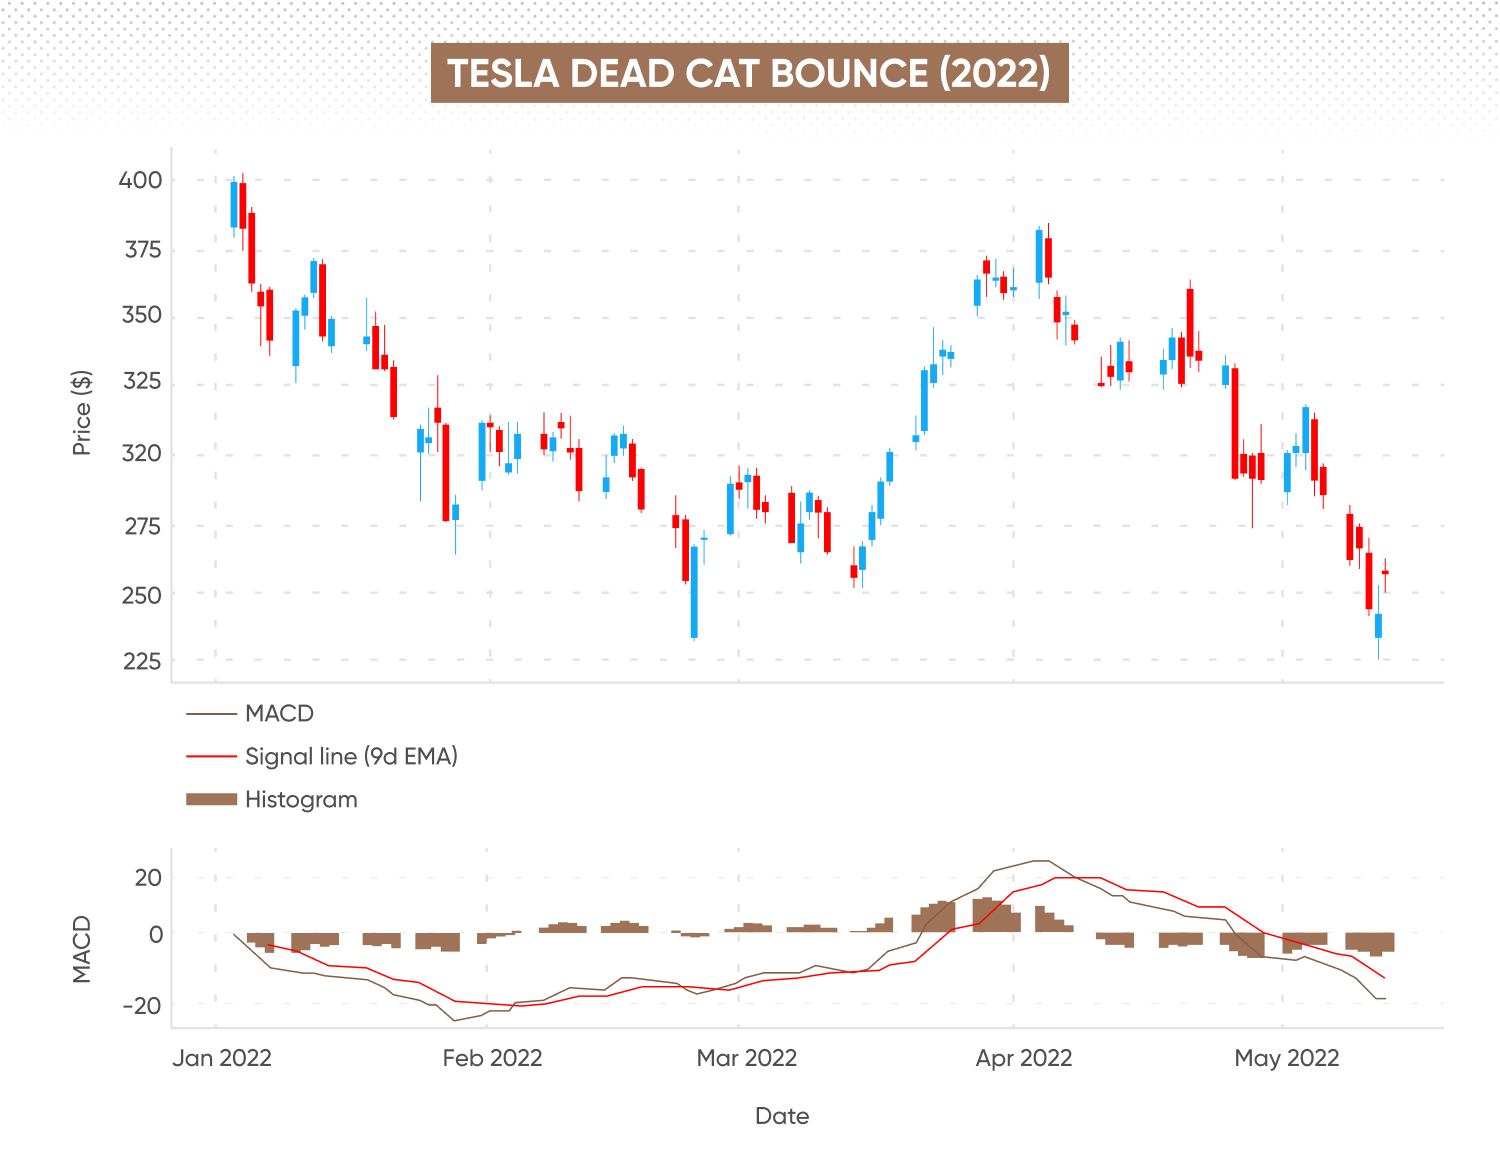
In early 2022, Tesla CFDs clearly illustrated a dead cat bounce pattern.
-
After opening near $400 per share in January, Tesla faced significant downward pressure amid concerns over slowing growth and regulatory challenges. By 14 March, shares plunged to around $255.
-
A sharp bounce then occurred, lifting prices over $380 by 4 April. Some interpreted this as a recovery sign, but the fundamentals had not significantly improved.
-
Within weeks, renewed selling drove Tesla’s shares even lower, dipping to around $219 on 25 May 2022.
Example 2: Nvidia (NVDA) stock in 2025
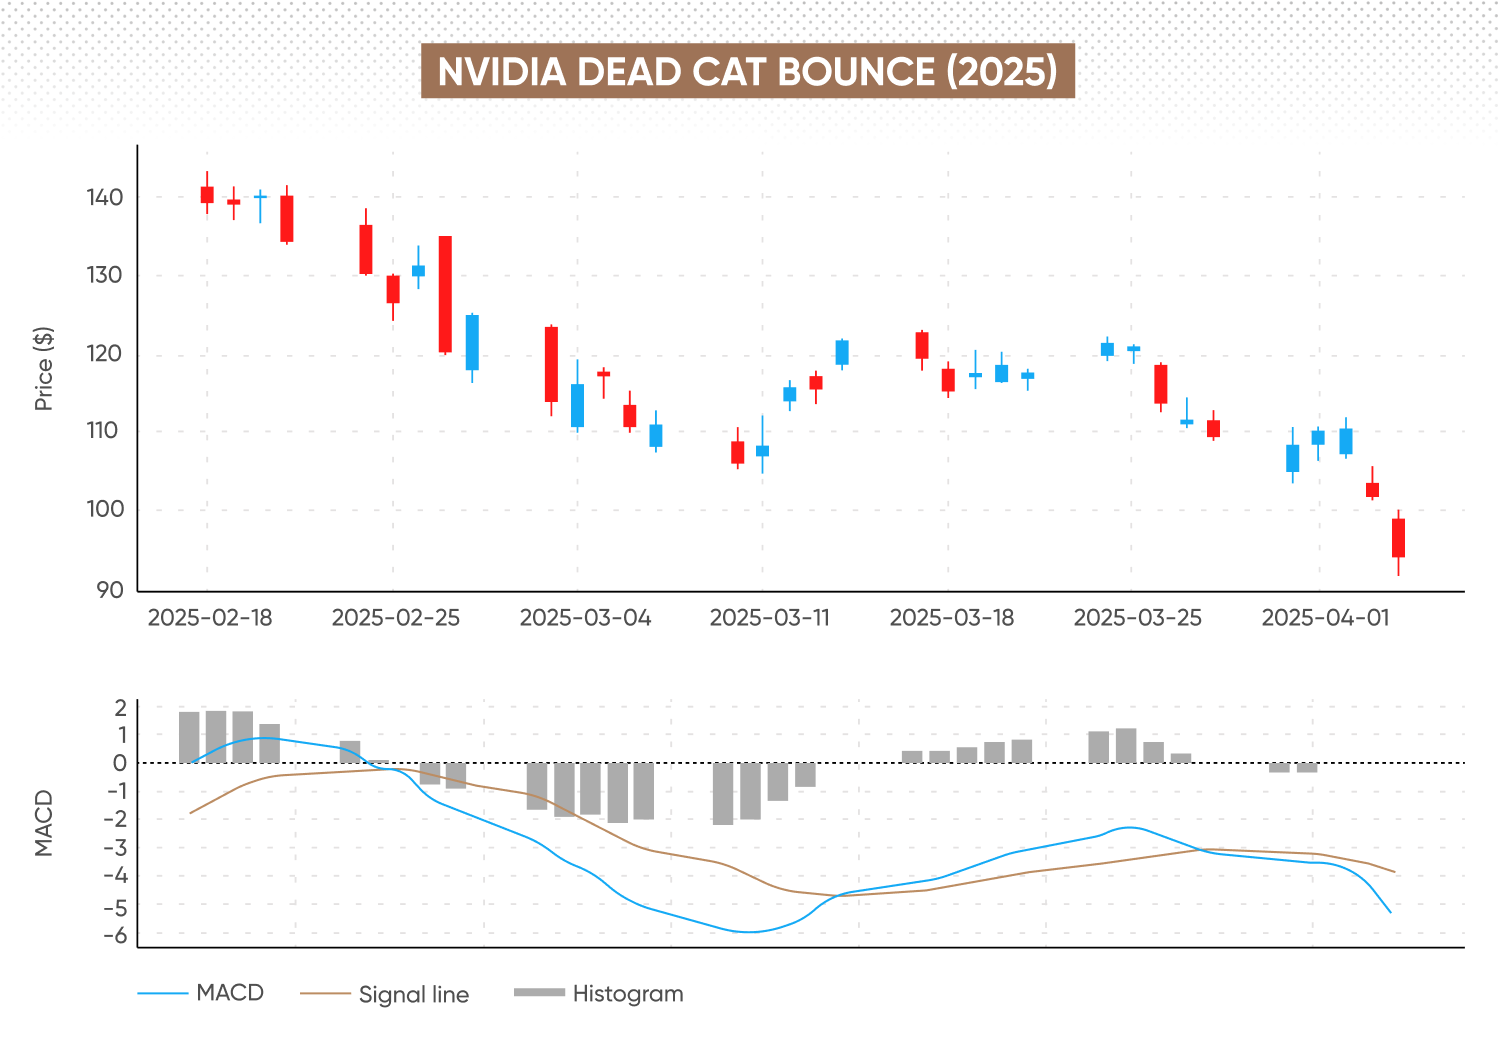
Nvidia share CFDs demonstrated a dead cat bounce pattern during periods of heightened market volatility in 2025.
-
Nvidia fell from around $139.30 in mid February, to $106.98 on 10 March 2025 – dipping below key moving averages.
-
A quick recovery then occurred, with Nvidia’s stock rising to $121.41 by 24 March 2025.
-
However, this upward move was short-lived, as by 4 April 2025, renewed selling pressure saw the price fall further to $94.31
This sequence highlighted the importance of technical confirmation and the risks of misinterpreting short-term rebounds as sustainable trend reversals.
Past performance doesn’t guarantee future results.
FAQs
What does dead cat bounce mean in trading?
A dead cat bounce is a short-lived price rebound following a steep decline in an asset’s value. In trading, it represents a temporary recovery within a broader downtrend, rather than a genuine reversal. This pattern can occur in stocks, indices, forex and other liquid markets during a prolonged downtrend and is not confined to periods of heightened volatility.
Is a dead cat bounce bullish or bearish?
While the bounce itself is a brief move higher and may appear bullish, the underlying context remains bearish. The pattern forms within a sustained downtrend, and the rebound typically fails to hold, with sellers regaining control soon after. It's considered a sign that further downside risk could remain, rather than an indication to take immediate action.
How long does a dead cat bounce last?
The duration varies, but most dead cat bounces are relatively brief – often ranging from a few days to several weeks, depending on market conditions and the asset involved. A dead cat bounce is typically confirmed once the price falls below its previous low, indicating a continuation of the downtrend.
How to avoid trading mistakes during a dead cat bounce?
To avoid missteps, focus on confirmation signals before acting. Use additional tools – such as volume analysis, resistance levels and technical indicators – to assess whether the rebound has sufficient strength or is likely to fail. However, no tool can guarantee accuracy, so risk management is essential: consider stop-loss orders and position sizing, and avoid assuming a true reversal too early.
Can a dead cat bounce back into a full recovery?
Occasionally, a bounce may evolve into a full recovery, particularly if underlying fundamentals shift or positive news emerges. However, most dead cat bounces revert to the prior downtrend. Confirmation from broader participation, improving sentiment, or a break above key resistance is needed to distinguish a genuine trend change from a temporary rally.