Best momentum indicators for traders

Learn about momentum indicators, how to read different types of momentum indicators, and stock momentum indicators for traders.
What is a momentum indicator?
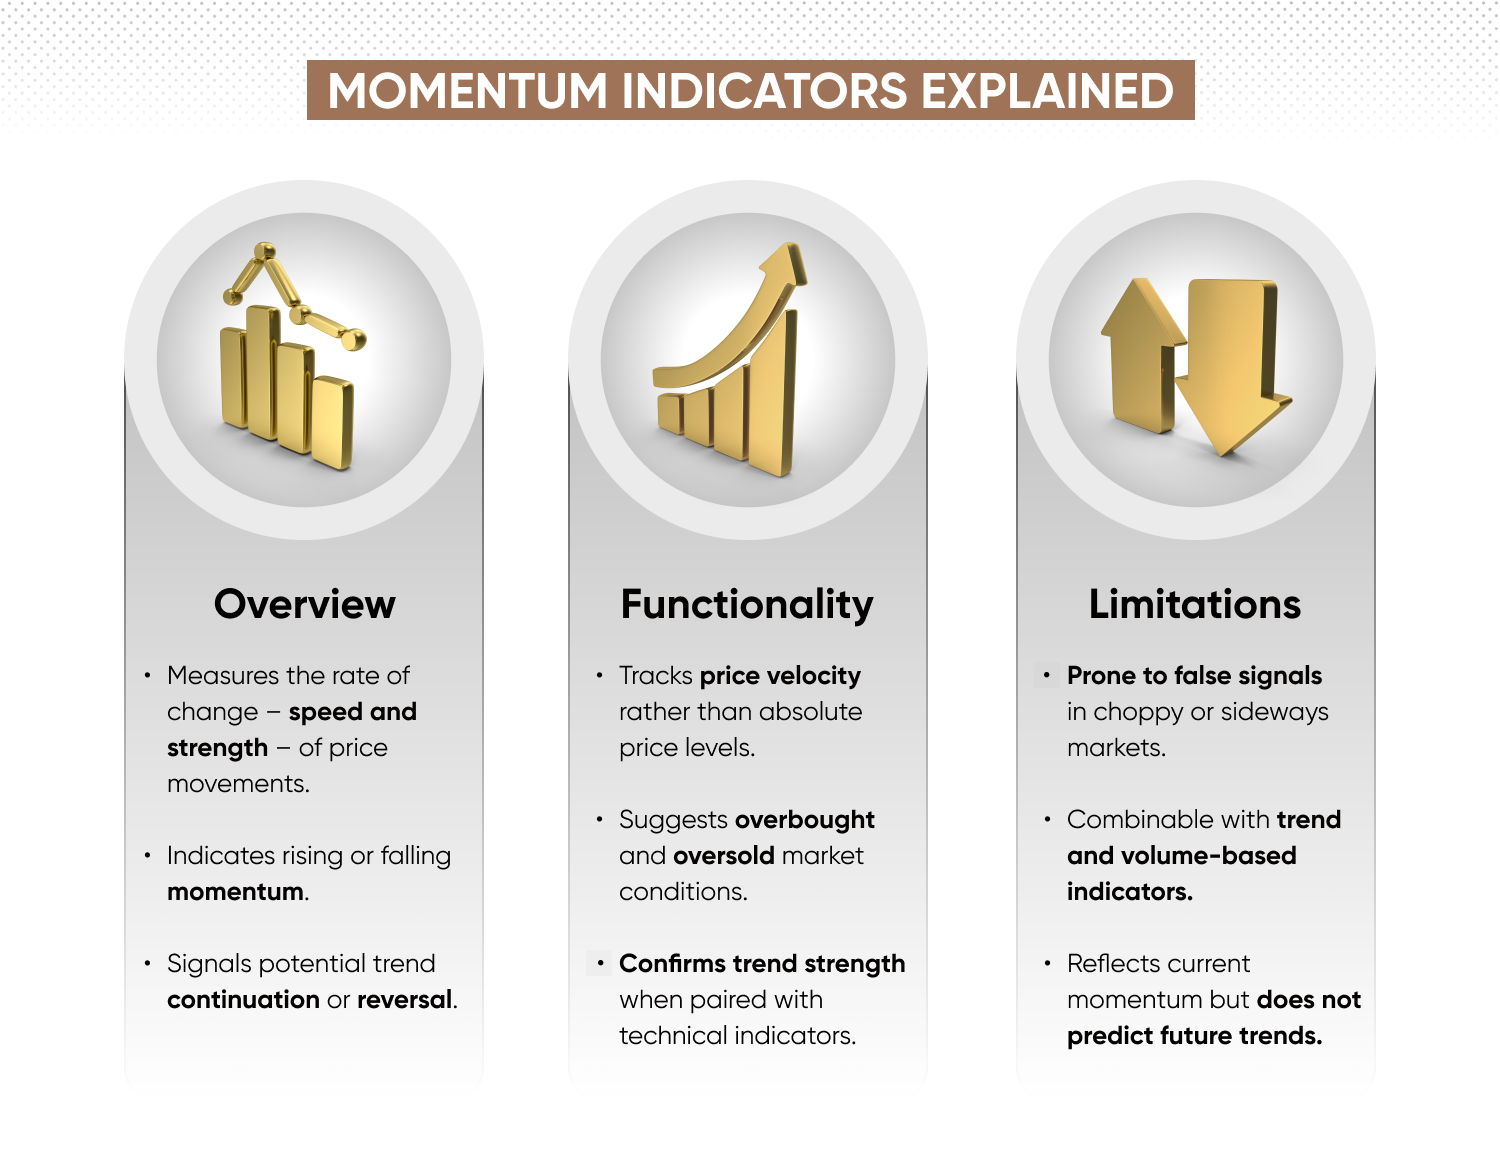
A momentum indicator measures the rate of change in an asset's price, helping traders assess whether momentum is increasing or weakening, which may indicate a trend continuation or reversal.
In technical analysis, traders use momentum indicators to help identify potential entry and exit points by analysing the speed of price movements within a trend. However, while momentum indicators can signal potential price movements, they do not guarantee future trends, and past performance is not indicative of future results.
What is momentum trading?
Momentum trading is a trading strategy based on the principle that, when an asset’s price moves strongly in one direction, either up or down, that asset is likely to continue its trajectory for a period of time.
Momentum trading involves identifying an existing trend; using momentum indicators to assess its strength, rate of change, and potential continuation. Momentum traders could enter a position when momentum indicators suggest an increasing rate of change and exit when signs of weakening appear.
Like trend traders, momentum traders seek assets with increasing price momentum, aiming to capture gains from sustained market movements, and exit the trade before its direction slows or reverses.
Discover more trading strategies in our comprehensive trading strategy guides.
What are the different types of momentum indicators?
 There are two main categories of momentum indicators: leading indicators and lagging indicators. Leading momentum indicators may help anticipate potential price reversals, while lagging momentum indicators confirm trends that have already formed. Many momentum indicators are oscillators that fluctuate within a set range to highlight overbought and oversold conditions.
Leading momentum indicators
Leading indicators attempt to suggest price movements by identifying when an asset is overbought or oversold – they help traders anticipate trend reversals before they occur.
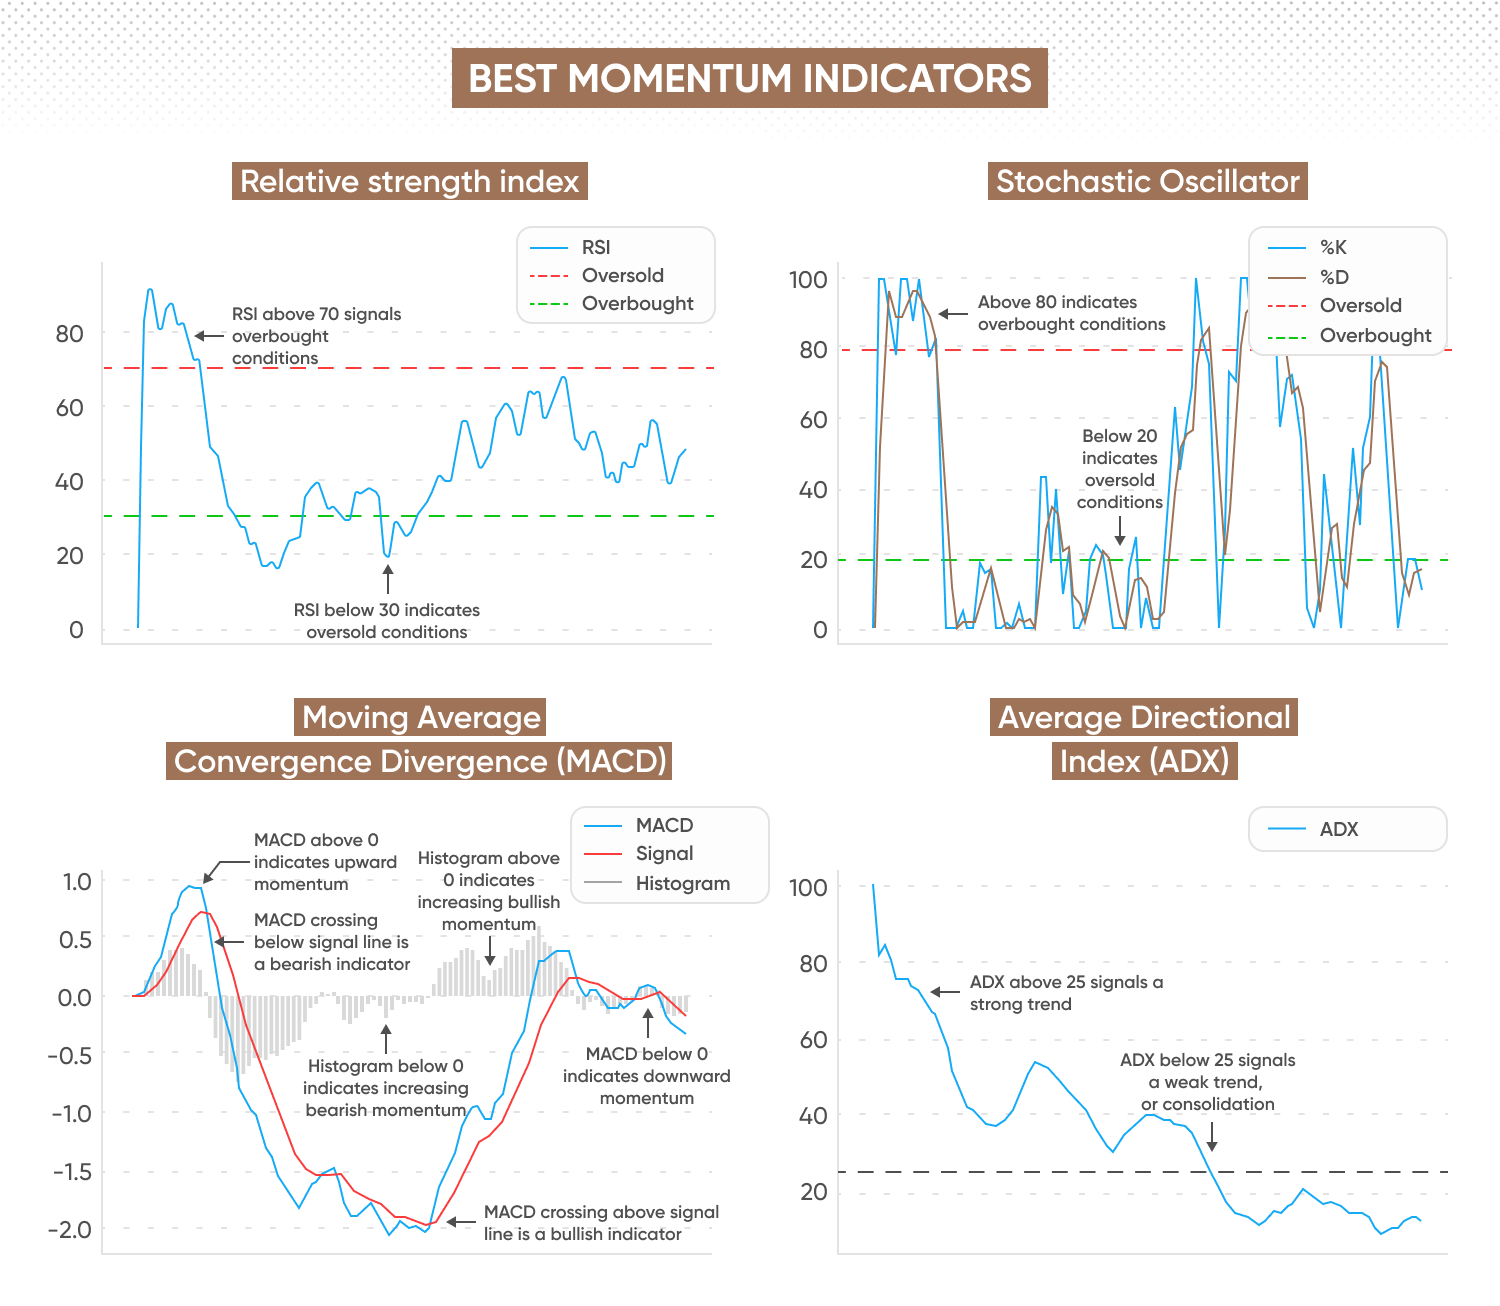
Relative strength index (RSI) measures the magnitude of recent price changes on a scale from 0 to 100. An RSI above 70 suggests an asset is overbought and could face a price pullback. A reading below 30 indicates oversold conditions, which may signal a potential price increase.
Stochastic oscillator compares the asset’s closing price to its price range over a selected period, often set to 14. The stochastic oscillator also moves between 0 and 100, with values above 80 suggesting overbought conditions and values below 20 indicating oversold conditions. It helps traders identify potential trend reversals by looking for crossovers between its %K and %D lines.
Williams %R measures how close the closing price is to the highest high of its price range over a set period. It ranges from -100 to 0. Readings above -20 indicate an asset may be overbought, while readings below -80 suggest it may be oversold.
Lagging momentum indicators
Lagging indicators confirm trends after they have already formed – they help traders confirm whether an existing trend has strong momentum or is weakening.
Moving average convergence divergence (MACD) consists of a MACD line, signal line, and histogram. When the MACD line crosses above the signal line, it suggests bullish momentum. When it crosses below, it suggests bearish momentum. Meanwhile, the MACD histogram indicates the strength of momentum by displaying the distance between these two lines.
Average directional index (ADX) measures a trend’s strength, and is often used in conjunction with the DI lines to determine trend direction. ADX ranges from 0 to 100, with values above 25 commonly suggesting a strong trend and values below 20 indicating a weak trend.
Momentum indicator (MOM) calculates the difference between the most recent closing price and a past closing price over a specified period. If the momentum value is above zero, it suggests bullish momentum. If it is below zero, it indicates bearish momentum. Traders can use MOM to confirm whether an asset is gaining or losing strength in its current trend.
Stock momentum indicators
Momentum indicators are widely used to determine whether a stock is gaining or losing momentum.
RSI and MACD are frequently used in shares trading to detect trend strength, while RSI specifically identifies overbought and oversold conditions.
Rate of change (ROC) calculates the percentage change in price by comparing the current price to a past price over a specified period. A rising ROC suggests increasing momentum, while a falling ROC indicates weakening momentum.
eBay momentum indicator
The eBay momentum indicator refers to standard technical analysis tools used to analyse eBay's share price movements. Traders use indicators such as RSI, MACD, or ADX to evaluate the momentum of eBay's shares in the same way they would assess any other stock. These are not custom models or proprietary algorithms specific to eBay, but rather widely-used technical indicators applied to eBay's stock data.
Discover more trading indicators on our technical analysis guides page.
How do I read momentum indicators?
Traders can analyse momentum indicators to identify overbought and oversold levels, crossovers, trend strength, and divergences.
Overbought and oversold conditions
Many momentum indicators, such as the relative strength index (RSI) and stochastic oscillator, move within a fixed range – and help traders identify when an asset may be overbought or oversold.
-
RSI – Values above 70 indicate an overbought condition, suggesting the asset may be due for a pullback, though strong trends can keep RSI elevated. Values below 30 indicate an oversold condition, which could precede a price rebound.
-
Stochastic oscillator – Readings above 80 suggest overbought conditions, while readings below 20 indicate an oversold market. A crossover between the %K and %D lines within these zones could signal a potential reversal.
Momentum crossovers
Some indicators use moving averages or signal lines to confirm momentum shifts. The moving average convergence divergence (MACD) is a common example.
-
Bullish signal – MACD line crosses above the signal line, indicating increasing momentum.
-
Bearish signal – MACD line crosses below the signal line, suggesting weakening momentum.
-
The MACD histogram – Visualises the difference between the MACD line and the signal line, indicating potential momentum shifts.
Trend strength confirmation
Indicators like the average directional index (ADX) measure the strength of a trend rather than its direction.
-
ADX above 25 – Indicates a stronger trend, either bullish or bearish.
-
ADX below 20 – Indicates a weaker trend, either bullish or bearish.
Divergence signals
Divergence occurs when price action and a momentum indicator move in opposite directions, potentially signalling a trend reversal, though confirmation is needed.
- Bullish divergence – Price makes lower lows while the momentum indicator forms higher lows. Bullish divergence may signal weakening selling pressure and a potential reversal to the upside.
- Bearish divergence – Price makes higher highs while the momentum indicator forms lower highs. Bearish divergence may signal weakening buying pressure and a potential reversal to the downside.
How to trade momentum indicators
Momentum indicators help traders assess trend strength and identify entry and exit points. Here’s how to use them effectively:
- 1. Build a trading strategyDecide whether to trade short-term swings or longer trends. Day traders and swing traders could use the stochastic oscillator to identify potential reversals, whereas trend traders might use MACD to confirm momentum shifts.
- 2. Choose your indicatorsDifferent indicators serve different purposes. Stochastic oscillator and RSI highlight overbought and oversold conditions, ADX confirms trend strength, while MACD identifies momentum shifts. Momentum indicator and ROC measure the rate of price change over time.
- 3. Identify and confirm trade signalsMomentum indicators generate signals that traders use to time their trades. A MACD crossover or RSI sustaining above 50 may indicate increasing bullish momentum, while bearish divergence or a declining ADX could suggest an exit before momentum fades. Overbought and oversold readings can indicate potential reversal zones, but strong trends may continue despite these conditions.
- 4. Manage riskMomentum trading can be volatile, so risk management is essential. Set stop-loss orders to limit risk and take-profit orders to lock in potential gains, while trailing stops can help secure gains as trends develop.
- 5. Test your approachBefore trading live markets, test your momentum strategy using backtesting or a demo account. Adjust indicator settings and timeframes to match your trading style and market conditions.
Bear in mind that technical indicators cannot predict future price movements. Use additional indicators to verify the potential accuracy of trading signals, and never trade more than you can afford to lose.
FAQ
What is the purpose of momentum indicators?
Momentum indicators measure the speed and strength of price movements. Traders use them to confirm trends, spot potential reversals, and identify entry and exit points. These indicators highlight overbought and oversold conditions, but they do not guarantee future price movements.
What is momentum trading?
Momentum trading is a strategy where traders buy assets showing strong upward momentum and sell or short those with weakening or negative momentum. It relies on indicators like RSI to identify overbought or oversold conditions, while MACD and ADX help assess momentum shifts and trend strength. Traders enter positions when momentum increases and exit when signs of reversal appear.
What is the eBay momentum indicator?
There is no specific ‘eBay momentum indicator’. Traders analysing eBay shares can use standard momentum indicators like RSI, MACD, or ADX to assess momentum shifts, trend strength, and potential reversals.
How do traders read momentum indicators?
Traders look for overbought and oversold levels (RSI above 70 or below 30), momentum crossovers (MACD line crossing the signal line), trend strength (ADX above 25 alongside directional movement), and divergence (price making new highs while an indicator declines).