UK inflation fails to impress, rate cut bets shift to autumn
UK inflation comes in higher than expected in May, failing to provide a reason to cut rates further
The latest UK inflation data released on Wednesday has done little to ease pressure on the Bank of England (BoE). While headline inflation dropped from 3.5% to 3.4% year-on-year in May, the figure came in slightly above economists’ expectations of a fall to 3.3%. Core inflation aligned with forecasts, easing from 3.8% to 3.5%. Monthly inflation for both headline and core categories held steady at 0.2%, in line with projections.
Although not disastrous, the data was underwhelming for those hoping for a stronger disinflationary trend. The year-on-year figure remains stubbornly elevated, largely due to the sharp uptick seen in April, when energy and water bill hikes, vehicle excise duty changes, and council tax adjustments pushed prices higher. While inflation is broadly moving in the right direction again, a sustained decline in the 12-month average will require consistently soft monthly readings—a trend that has yet to materialize decisively.
The marginal improvement in inflation fails to provide the BoE with a compelling reason to begin cutting interest rates immediately. Market pricing currently reflects a 50/50 split on whether a 25 basis point cut could occur as early as August. However, expectations lean more decisively toward a September cut, with an 80% probability that it could be as large as 50 basis points—especially if no action is taken in August. Investors will now be closely watching Thursday’s BoE meeting for further guidance on the likely path of monetary easing through the rest of the year.
As expected, the pound regained some strength as the CPI report was released, with GBP/USD bouncing back after a sharp 1.1% decline on Tuesday. In contrast, the FTSE 100 slipped slightly, retreating from its daily highs. The index has been struggling to sustain upward momentum, held back by technical resistance near its March high of 9,909.
Last week's stall and this week's decline came amid broader risk-off sentiment, driven largely by intensifying geopolitical tensions. Still, technical indicators suggest the FTSE 100 retains a bullish short-term outlook. The Relative Strength Index (RSI) remains supportive, and the 20-day simple moving average (SMA) is providing a solid floor around 8,807. A key level to watch is 8,740, which should act as a near-term support base. A sustained breakout above 8,909 would be needed to unlock further upside potential.
FTSE 100 daily chart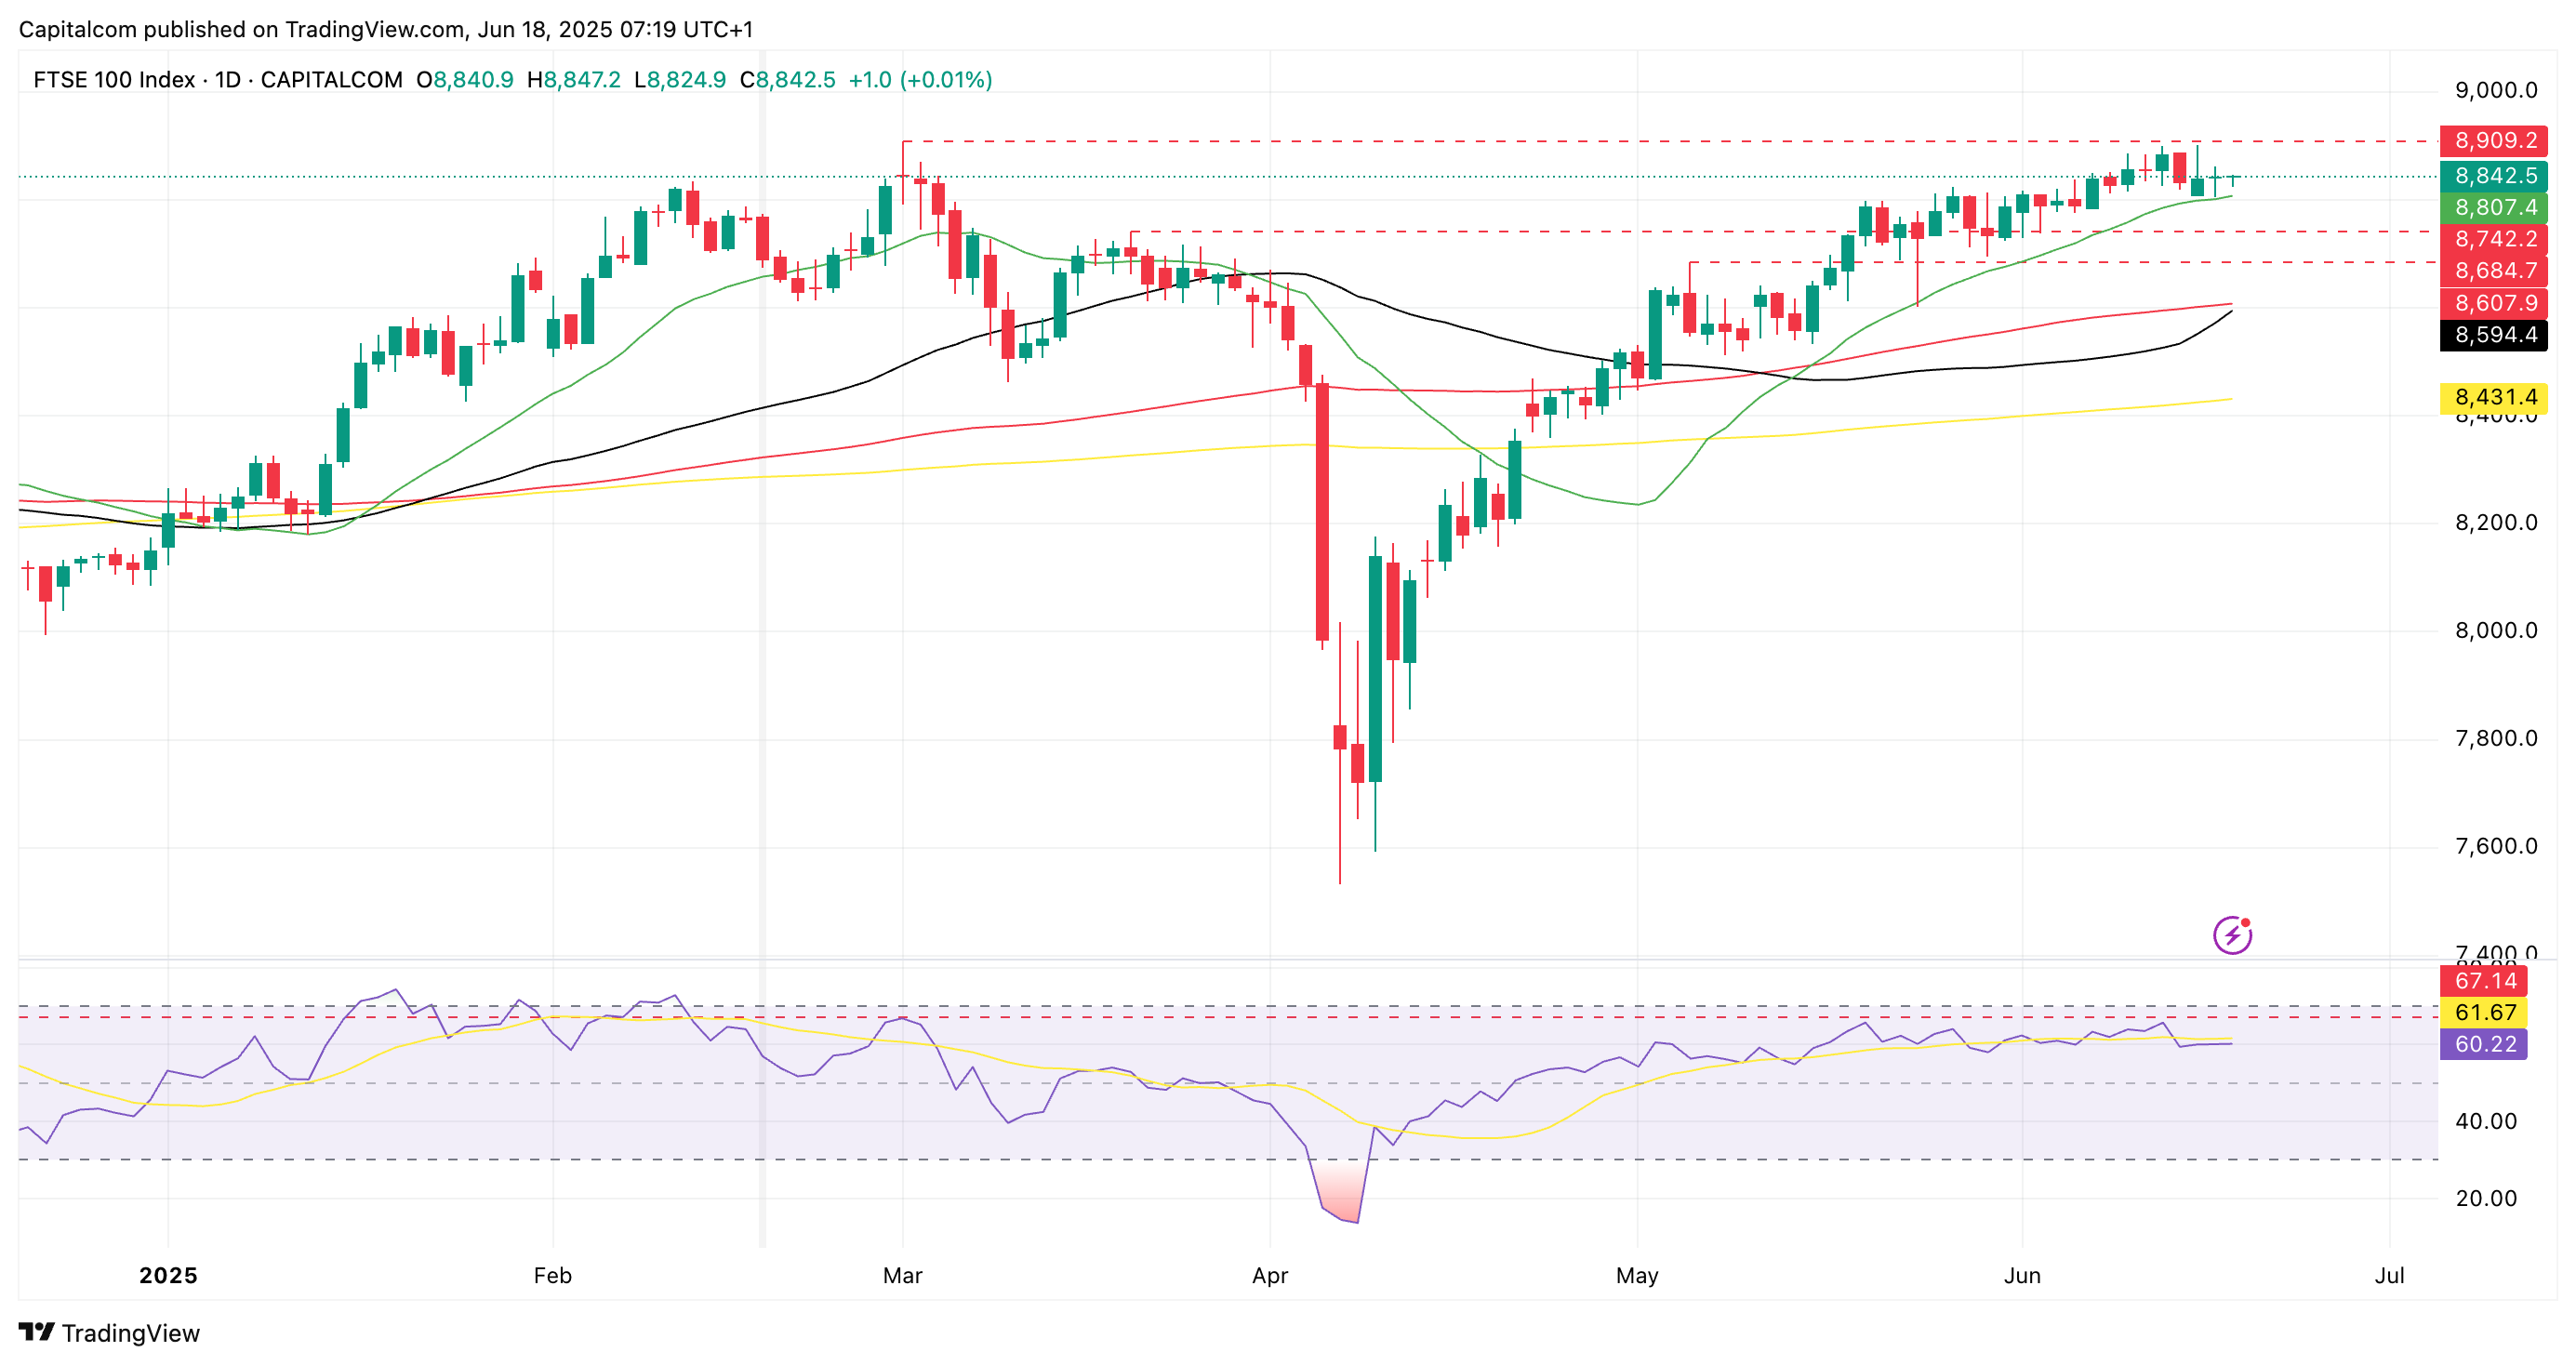
(Past performance is not a reliable indicator of future results)