Rising AI CAPEX Sparks Market Concerns for Meta and Oracle
Since reporting results, the AI names have been battered amid fears of out-of-control capital expenditure and the damage this is likely to inflict on free cash flow.
Since reporting results, the AI names have been battered amid fears of out-of-control capital expenditure and the damage this is likely to inflict on free cash flow. Meta and Oracle stand out as the poster children for this, with not only equity investors taking notice but, in Oracle’s case, credit investors as well.
Runaway Spending
What has been most striking is the decline in free cash flow both Meta and Oracle have experienced, with both turning lower over the past twelve months. In Oracle’s case, free cash flow has turned negative, to almost -$6 billion. More concerning is that analysts do not expect Oracle’s free cash flow over the next twelve months to return to the lofty levels it once enjoyed. If CAPEX continues to rise, it may even further impair Oracle’s free cash flow and possibly even push it lower.
Rising CAPEX and falling free cash flow would suggest that at this point, at least the big expenses that are being put in AI, to this point, are not paying off. Now, this has caught investors’ attention.
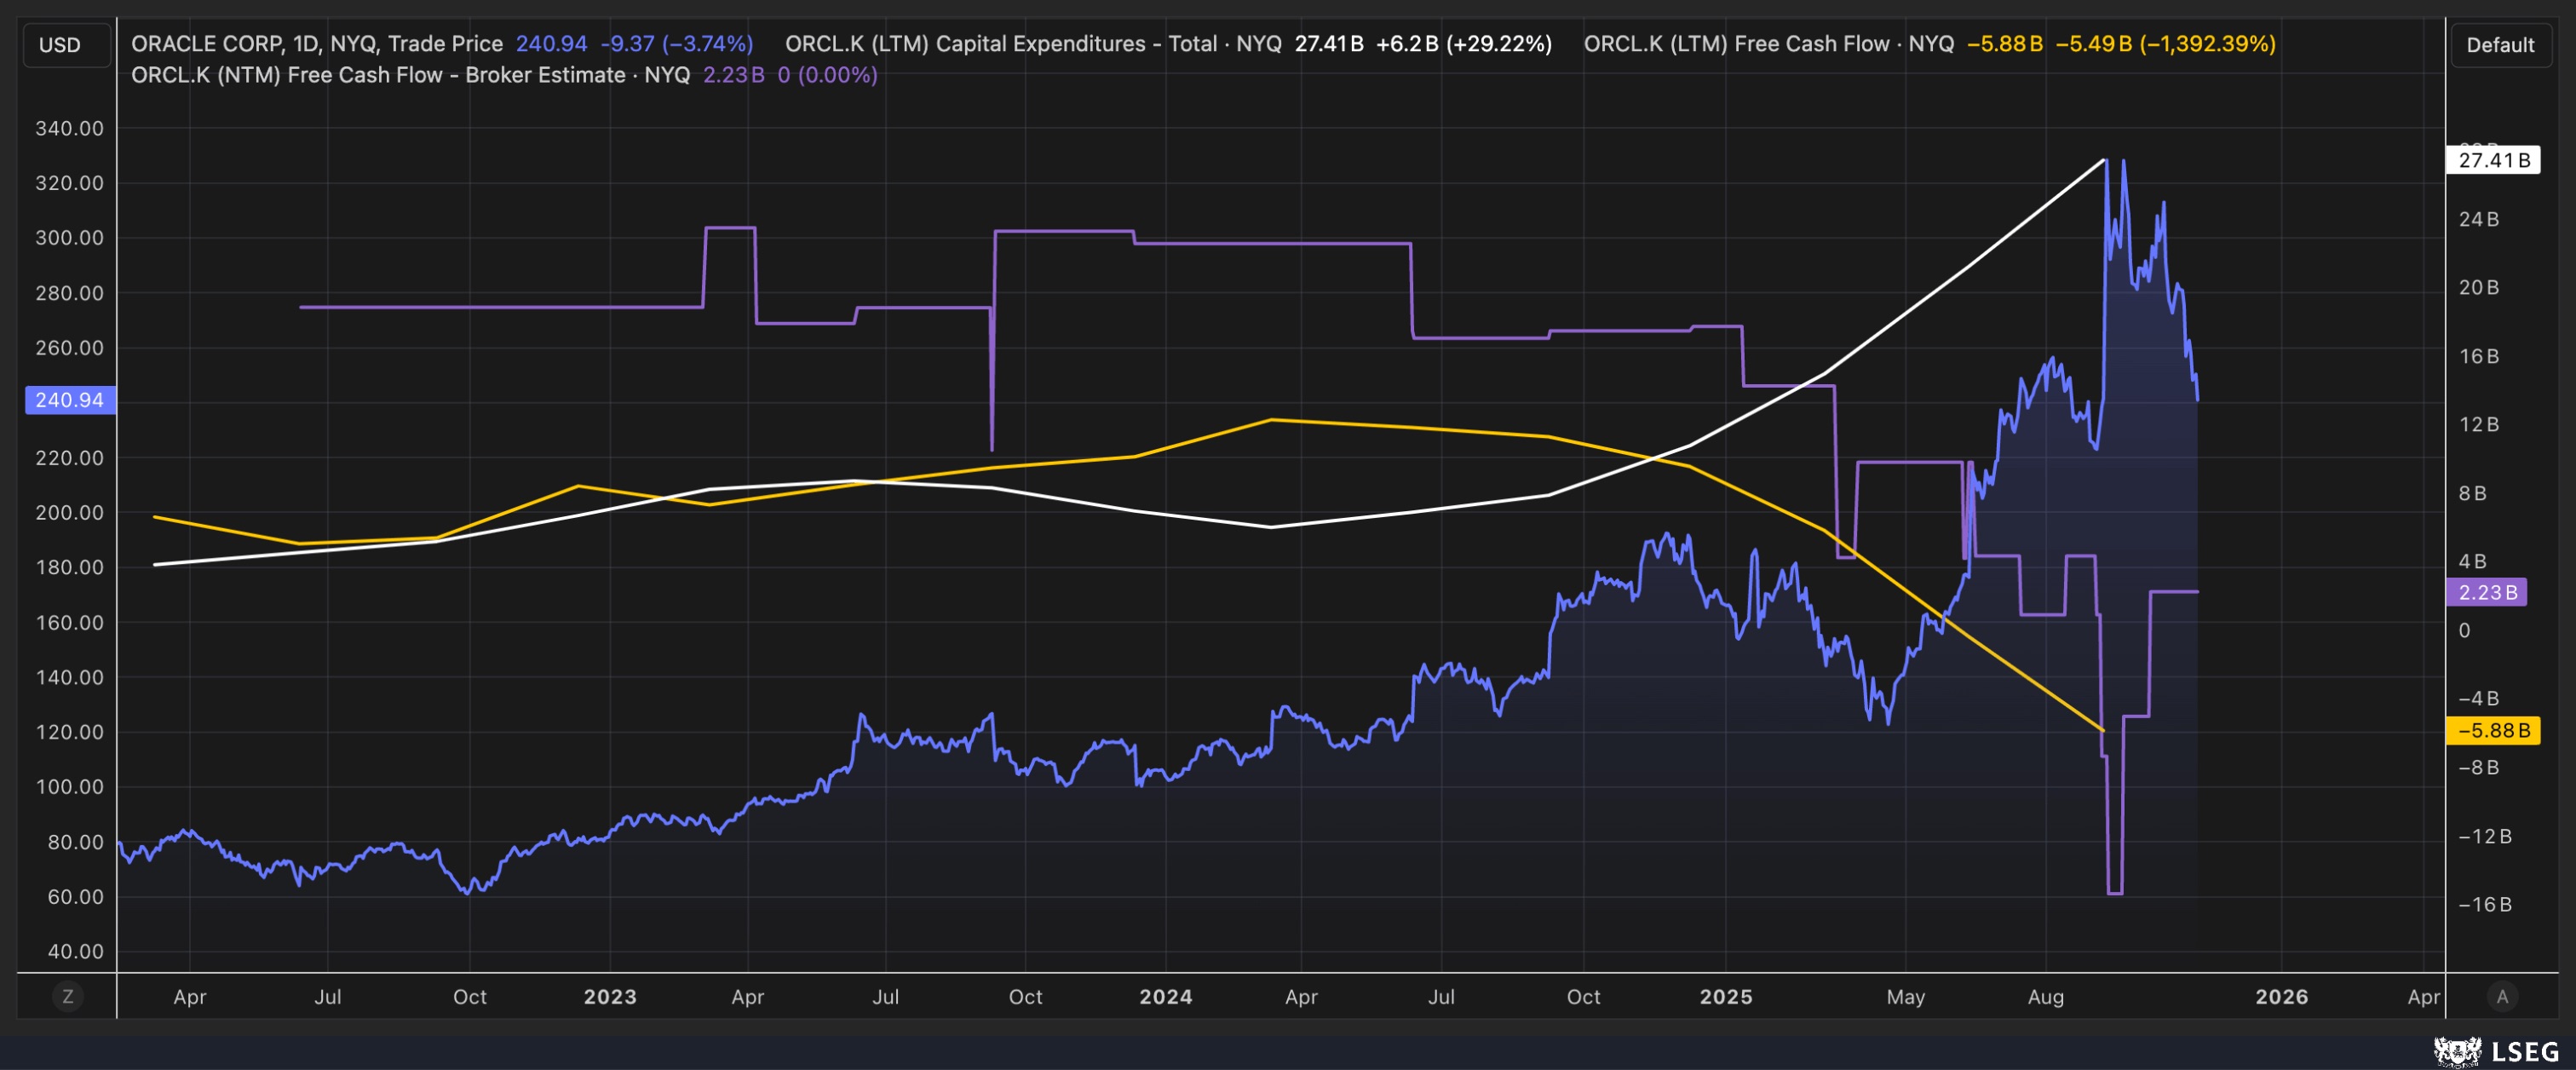
(Source: LSEG) (Past performance is not a reliable indicator of future results)
For Oracle, the credit market has woken up to the potential negative impact that AI-related spending is having on the company’s profitability. As a result, its credit default swap has widened to around 80 basis points. The spread has not been this wide since late 2022 and early 2023, during the Federal Reserve’s tightening cycle, when high inflation and rising interest rates triggered market fears of a potential recession. The widening of the CDS appears to coincide with Oracle’s declining free cash flow.
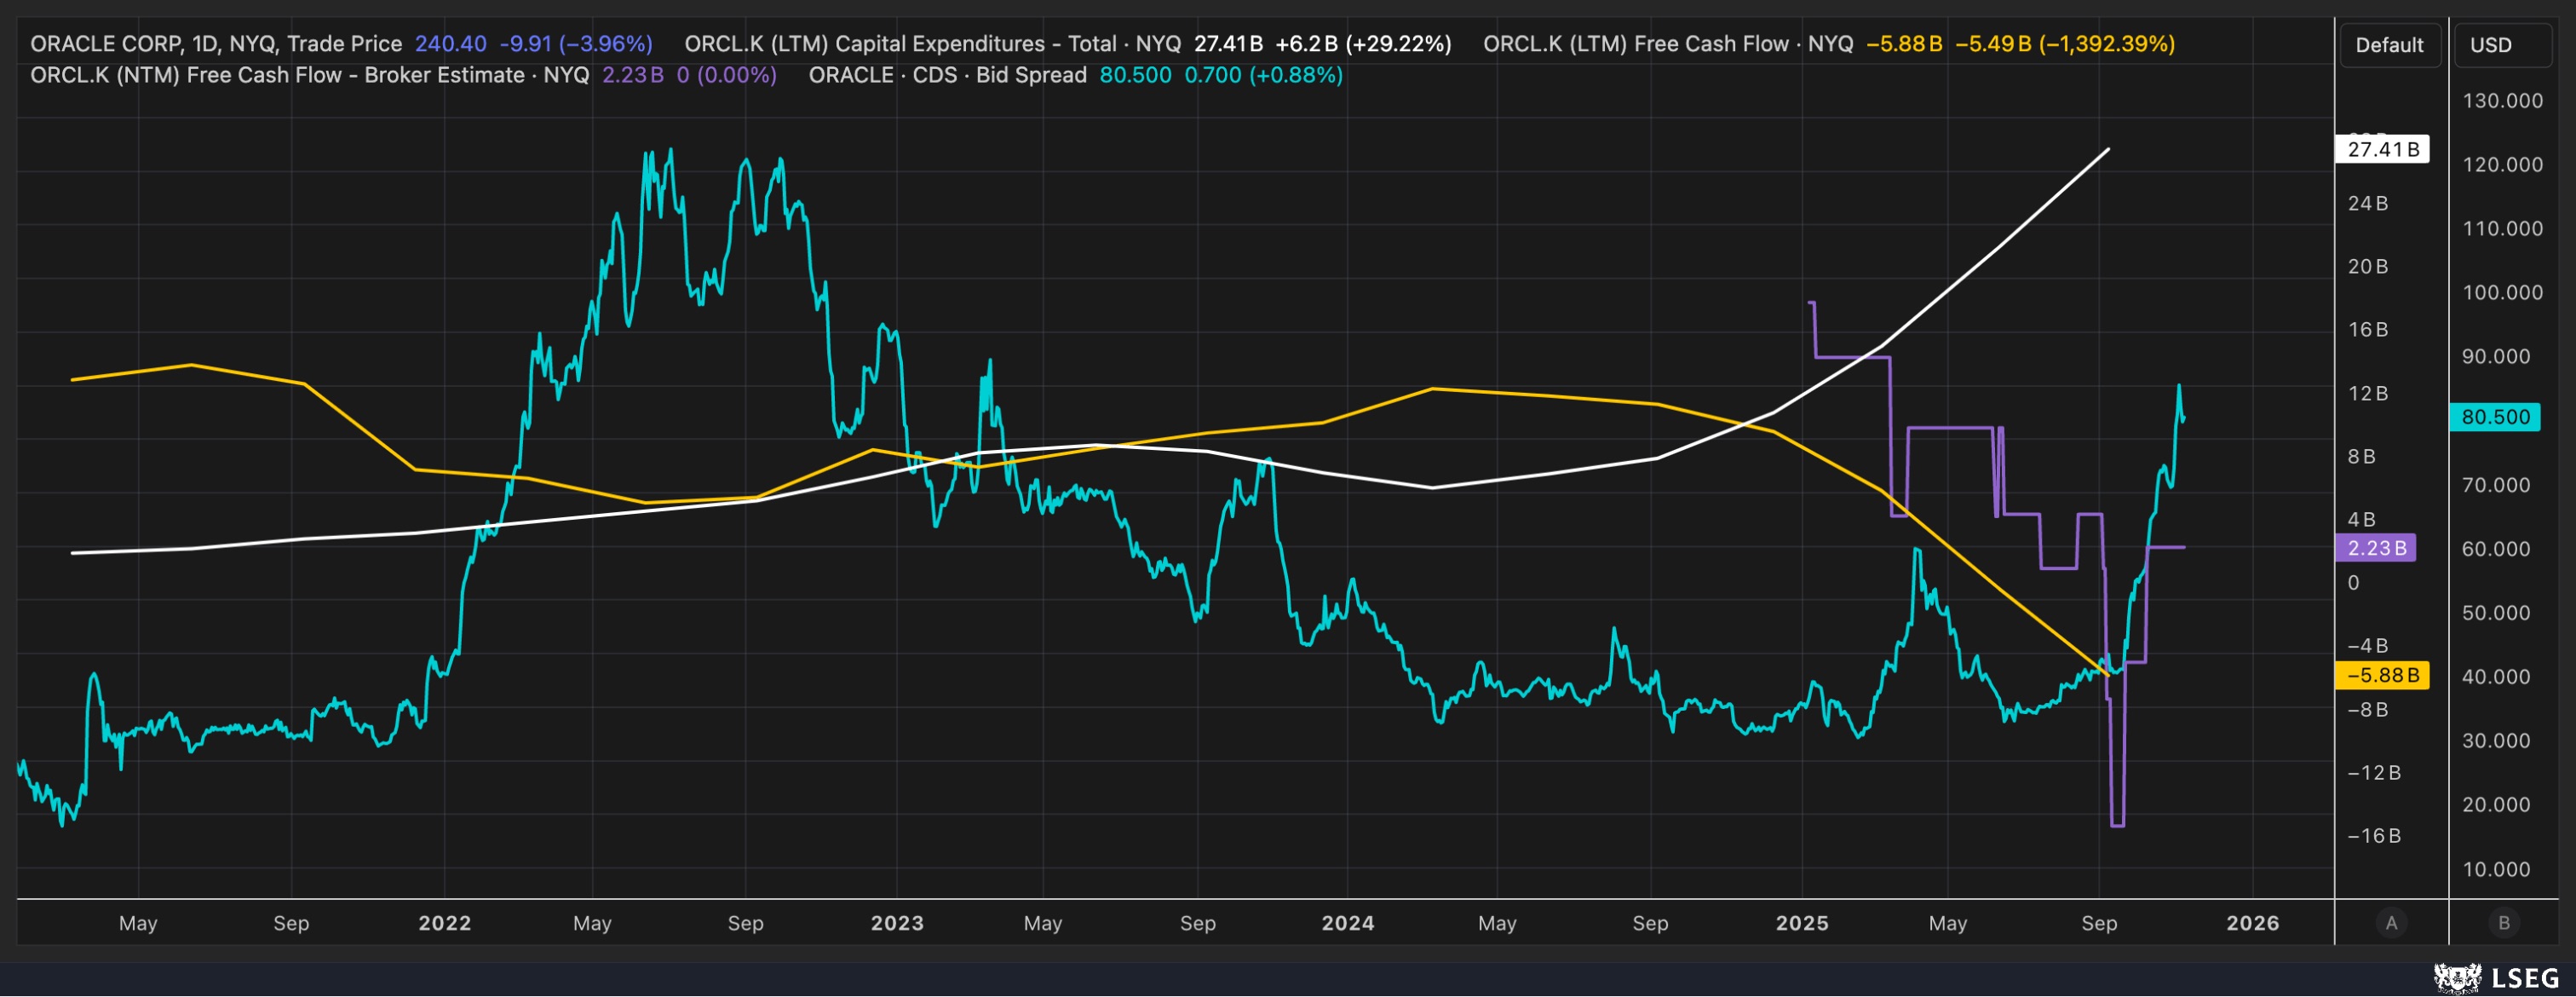
(LSEG) (Source: TradingView) (Past performance is not a reliable indicator of future results)
For Meta, the situation is not much better. Although the company still has positive free cash flow over the past twelve months, analysts expect it to fall to approximately $20 billion over the next twelve months, from its current $45 billion, as the company ramps up capital expenditures, and indicated during its latest earnings call it plans to spend even more in 2026.
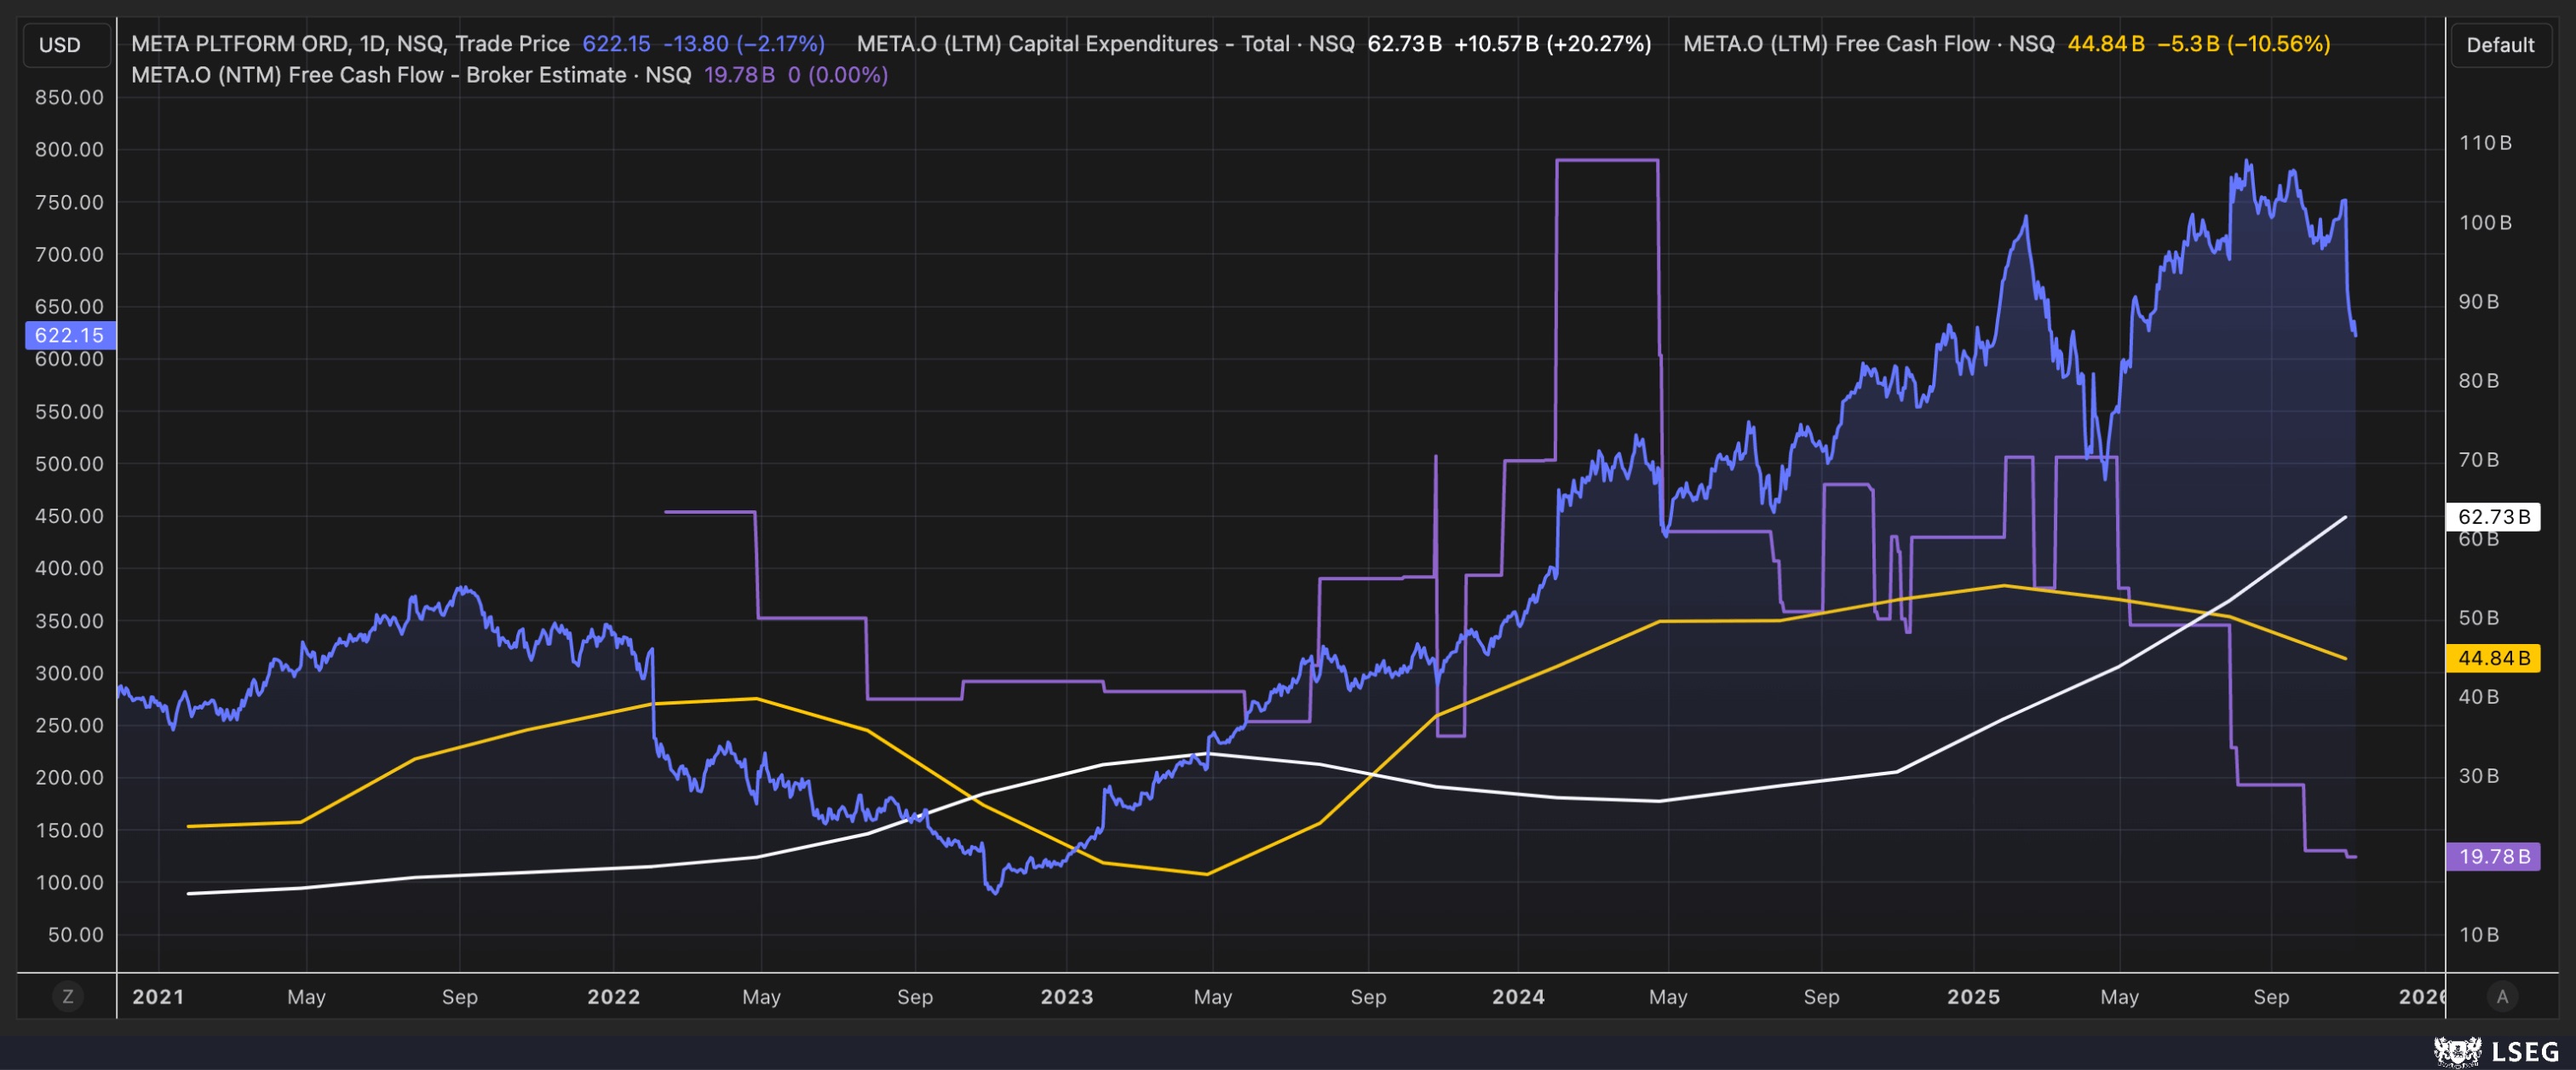
(Source: LSEG) (Past performance is not a reliable indicator of future results)
Stocks Are Seeing Negative Impacts
As a result of the increased spending, both stocks have fallen sharply, with Oracle shares plunging, erasing all the gains that followed its earnings report, when the stock surged by 35% in a single day. The question on investors’ minds now is what happens next for Oracle’s share price.
From an options standpoint, a big problem is that the stock is currently in a negative gamma and delta regime, meaning market makers are likely to act as sellers if the stock continues to fall. From an options perspective, the key gamma level sits around $240 per share, an important support level. If the $240 level were to break, it would suggest that, from an options standpoint, support has broken.
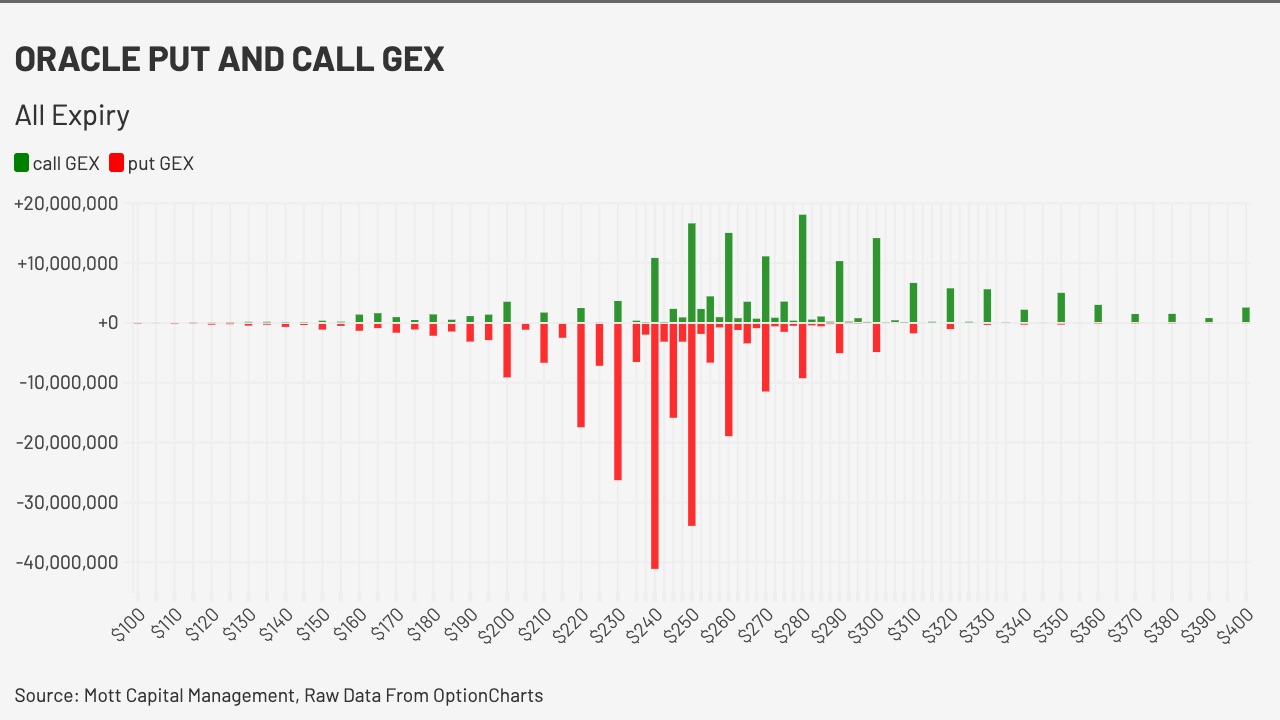
(Source: OptionsCharts) (Past performance is not a reliable indicator of future results)
Technically, the chart shows a similar risk, with the $240 level acting as support, allowing the stock to fill the gap created by the sharp spike higher after the company’s results in September. A break below this support at $240 could see the stock trade lower to approximately $220.
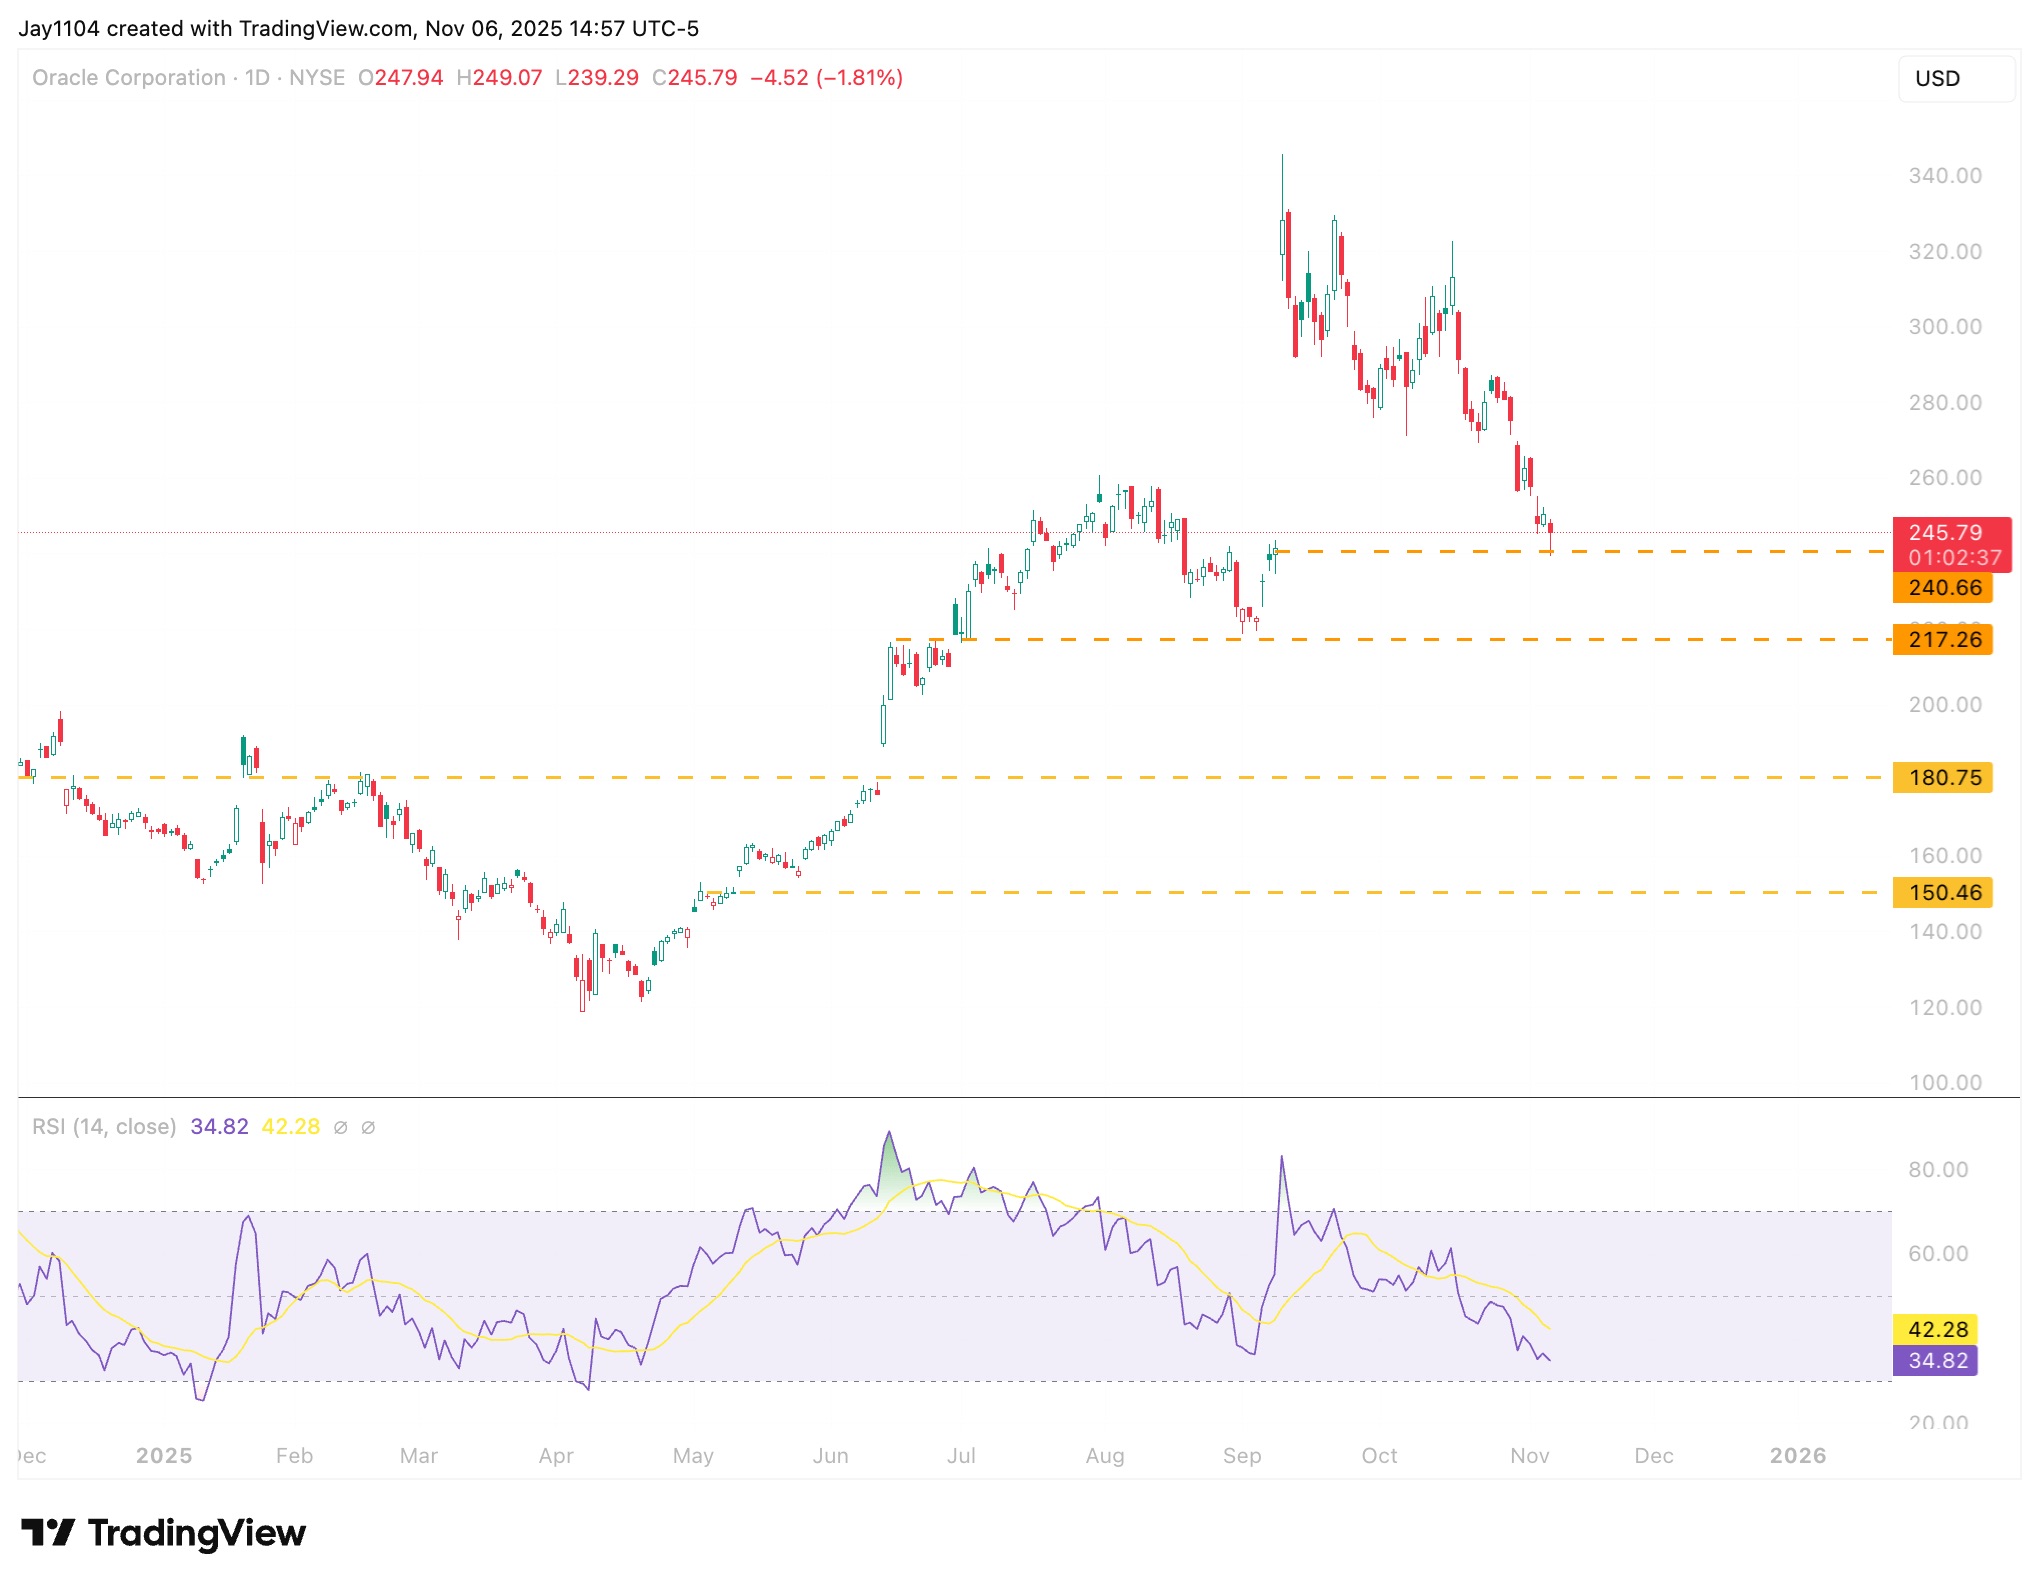
(Source: TradingView) (Past performance is not a reliable indicator of future results)
Meta has also plunged by more than 15% since reporting results, as investors worry about the increased spending on AI and the negative impact it is having — and is expected to have — on future free cash flow. Like Oracle, Meta is also in a negative gamma and delta regime, meaning market-maker hedging is likely to increase volatility and exacerbate declines if the stock continues to fall.
The put gamma level that currently supports Meta sits at the $630 strike price, and if the shares lose that area of put concentration, they could slide further towards $600, the next big area of put concentration.
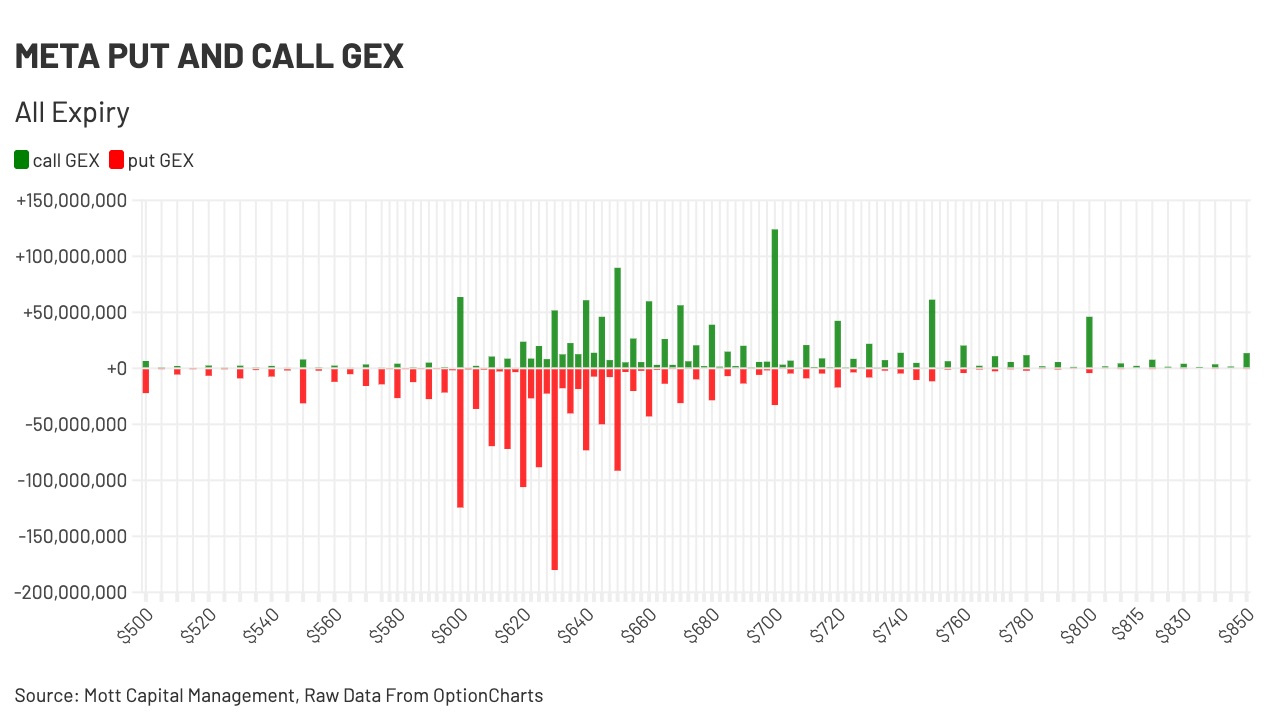
(Source: OptionsCharts) (Past performance is not a reliable indicator of future results)
The technical chart shows that the $600 level represents a major area of support for Meta, established on 1 May, when the stock gapped higher amid market turmoil from tariffs. This highlights the importance of that region, as it aligns with support from both an options and a technical perspective. The chart also indicates that the shares are approaching oversold conditions, with the relative strength index falling below 30 and the stock touching the lower Bollinger Band.
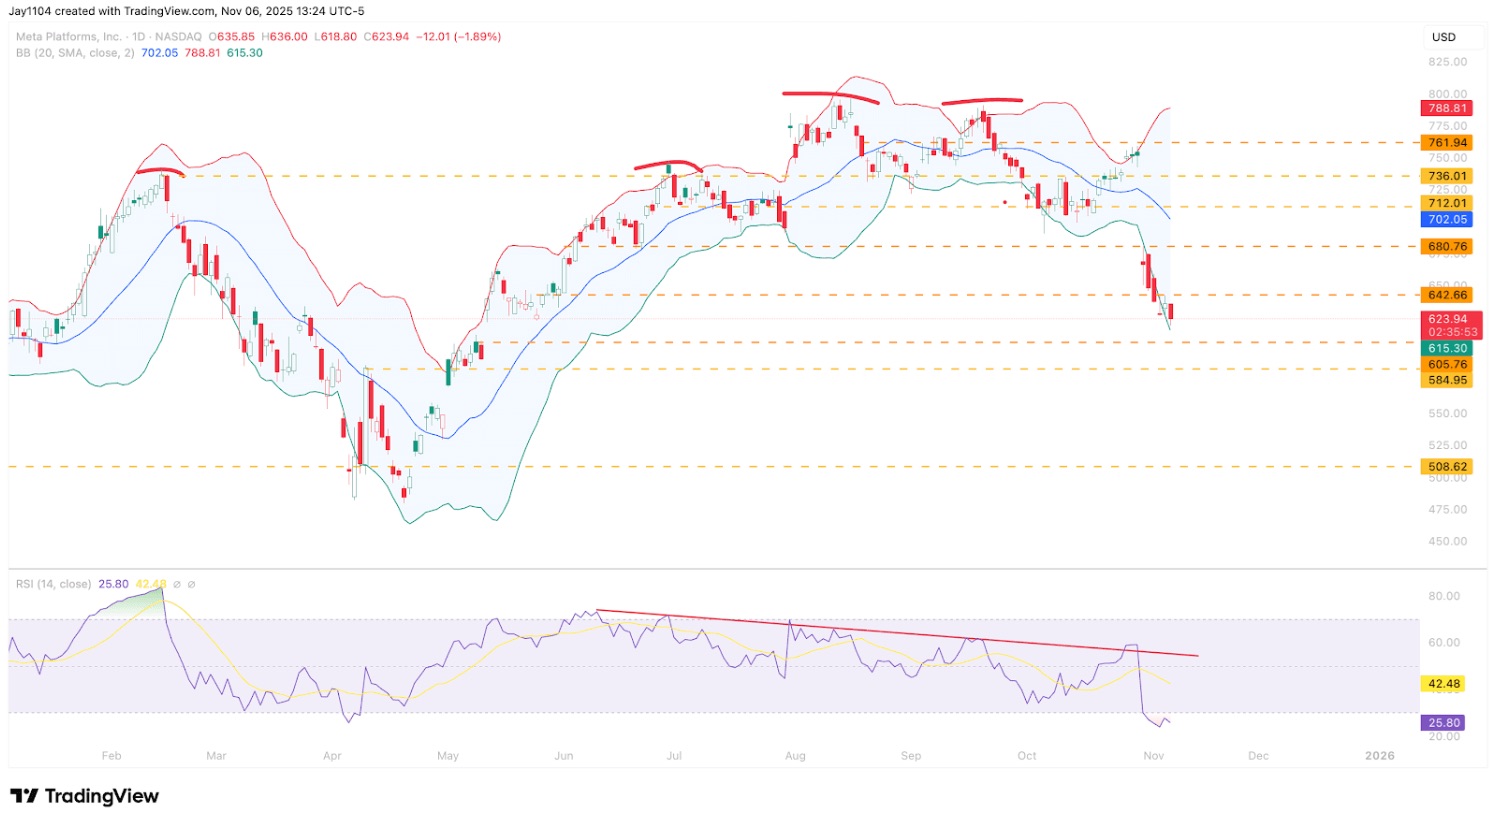
(Source: TradingView) (Past performance is not a reliable indicator of future results)
Any signs of increased spending by these two companies could further unsettle investors and weigh on their share prices. That even goes beyond these two companies since the entire space is now on notice from investors, which means paying attention to debt issuance or new spending plans. This is a clearly identifiable fundamental development underway — and one that investors will be watching very closely.