Market Analysis: GBP/USD attempts to break 1.25 as GDP data surprises
Stronger-than-expected growth in the UK has allowed GBP/USD to recover some bullish momentum
GBP/USD is making another attempt to push past the 1.25 level, buoyed by stronger-than-expected UK GDP data. The preliminary report suggests the UK economy grew by 1.5% in 2024, a significant improvement from the flat growth recorded in 2023. Markets had anticipated a 1% expansion following a softer Q3 reading. On a quarterly basis, GDP grew by 0.1% in the final three months of the year, outperforming expectations of stagnation and avoiding the anticipated 0.1% contraction. December’s monthly GDP rose by 0.4%, likely supported by increased consumer activity during the holiday season.
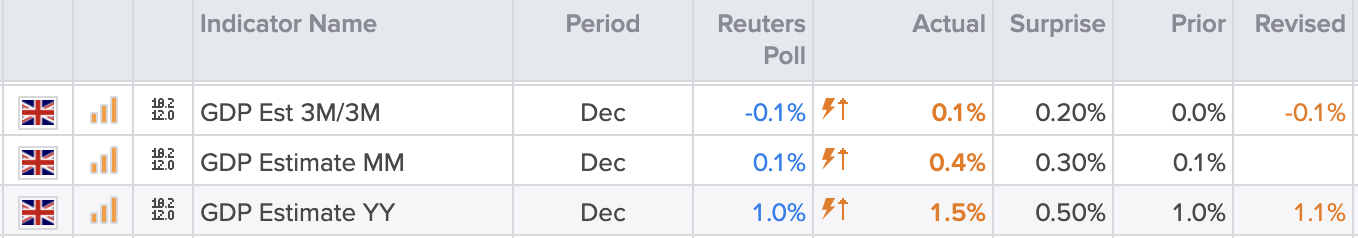
Source: refinitiv
Economic Outlook and Market Impact
The stronger growth data has eased concerns about economic stagnation, particularly as the Bank of England faces limited scope for rate cuts due to persistent inflation. However, the positive GDP surprise was accompanied by declines in business investment, manufacturing production, and industrial output, underscoring the economy's underlying fragility.
Looking ahead, growth forecasts for 2025 have been downgraded, with economists citing higher corporate taxes as a potential drag on business investment and expansion. The Bank of England has revised its economic growth forecast downward, from 1.5% to 0.75% for the year, while predicting that headline inflation will rise to 3.7% in Q3. Additionally, the looming threat of a trade war poses further downside risks to growth.
GBP/USD Technical Outlook
Despite these challenges, the GDP surprise has provided GBP traders with renewed momentum, helping the currency recover from multi-year lows against the US dollar. Recent market dynamics, shaped by Trump’s tariff policies and the Federal Reserve’s hawkish stance, have strengthened the dollar and limited gains in other currencies. However, signs of a potential Russia-Ukraine truce and a pause in new trade-related headlines from the Trump administration have allowed risk appetite to return to markets.
GBP/USD daily chart
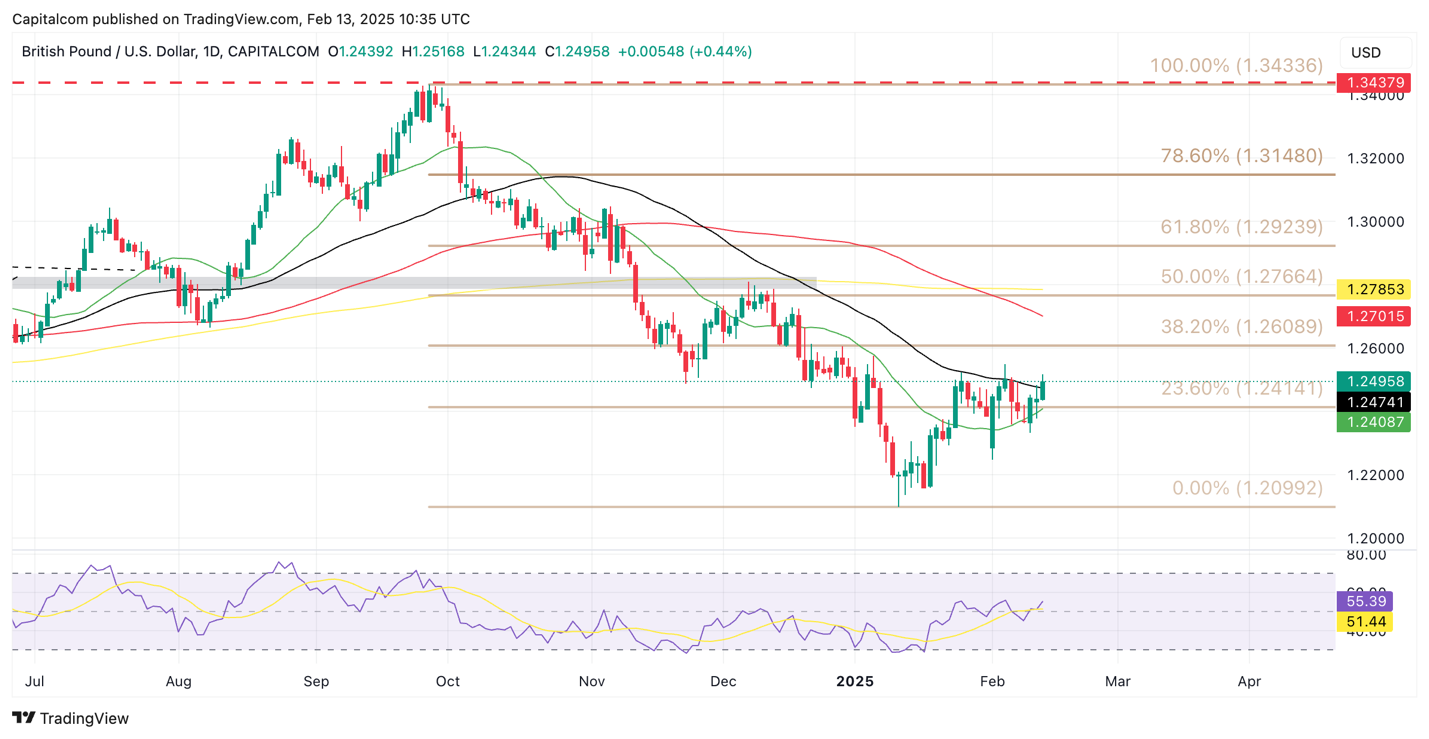
Past performance is not a reliable indicator of future results.
GBP/USD has retraced approximately 25% of its decline from 1.3430 to 1.21 between September 2023 and January 2024. However, the pair is encountering resistance near its 50-day SMA (currently at 1.2474). Thursday’s candlestick will be a key indicator of whether GBP/USD can hold above this resistance or if selling pressure will reassert itself. If bullish momentum persists, the pair will need to overcome the 1.25 level, which has acted as a key resistance point in recent weeks.