Equity Indexes Stall While the Market Awaits the December FOMC Rate Decision
The S&P 500 closed the day down by just nine basis points.
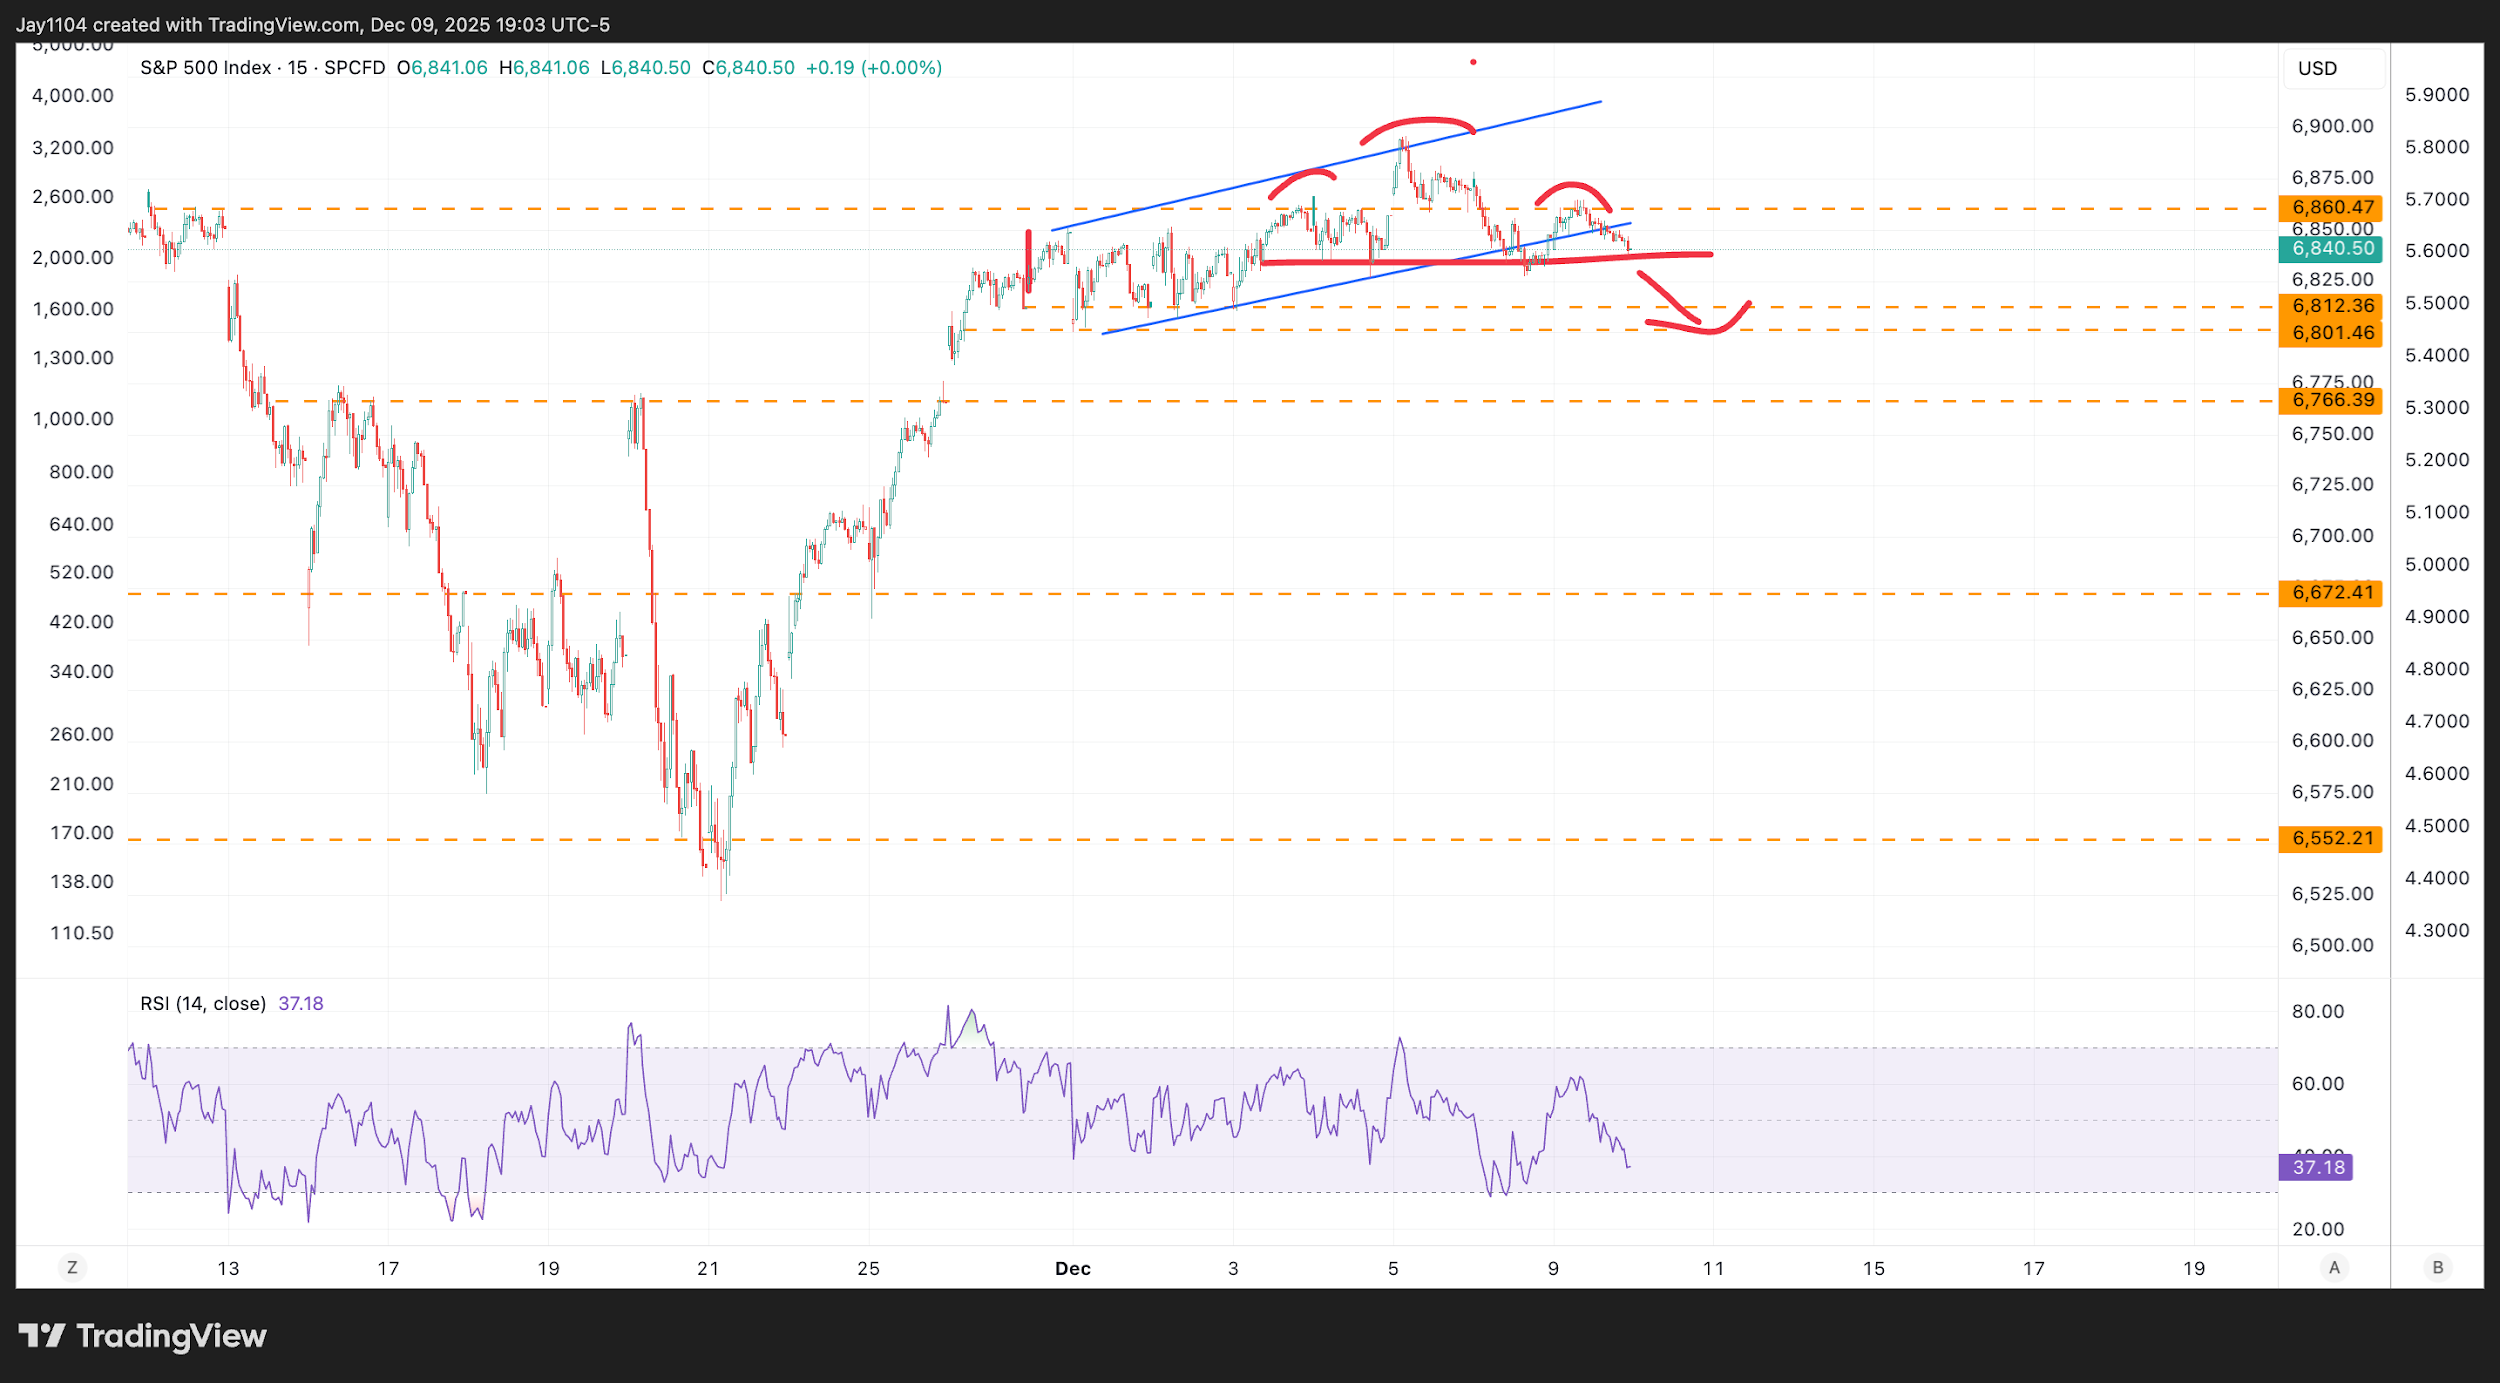
The index continues to fluctuate between the 6,800 and 6,850 levels, and that has remained unchanged since 28 November. Eventually, this trading range will inevitably break. Some might even suggest that, on the intraday chart of the S&P 500, an identifiable head-and-shoulders pattern is forming, which would indicate that a break below the neckline around 6,830 could see the index start to move lower towards 6,800 — the key support level maintained since the last week of November. [chart1]
Additionally, the S&P 500 appears to have formed a bearish pattern resembling a rising flag, and it may have broken today, again indicating that a decline could be coming. [chart1] This entire two-week period has ultimately demonstrated that without implied volatility to sell, the market lacks the energy to push the index higher — and this is becoming more evident with each passing day.

Again, it would take a meaningful break below 6,800 for the index to begin unwinding to lower levels. Until that happens, we are simply waiting and marking time, consolidating in a sideways pattern.
(Source: TradingView)
(Past performance is not a reliable indicator of future results)
[chart1]
Implied Volatility Is Rising Ahead of FOMC
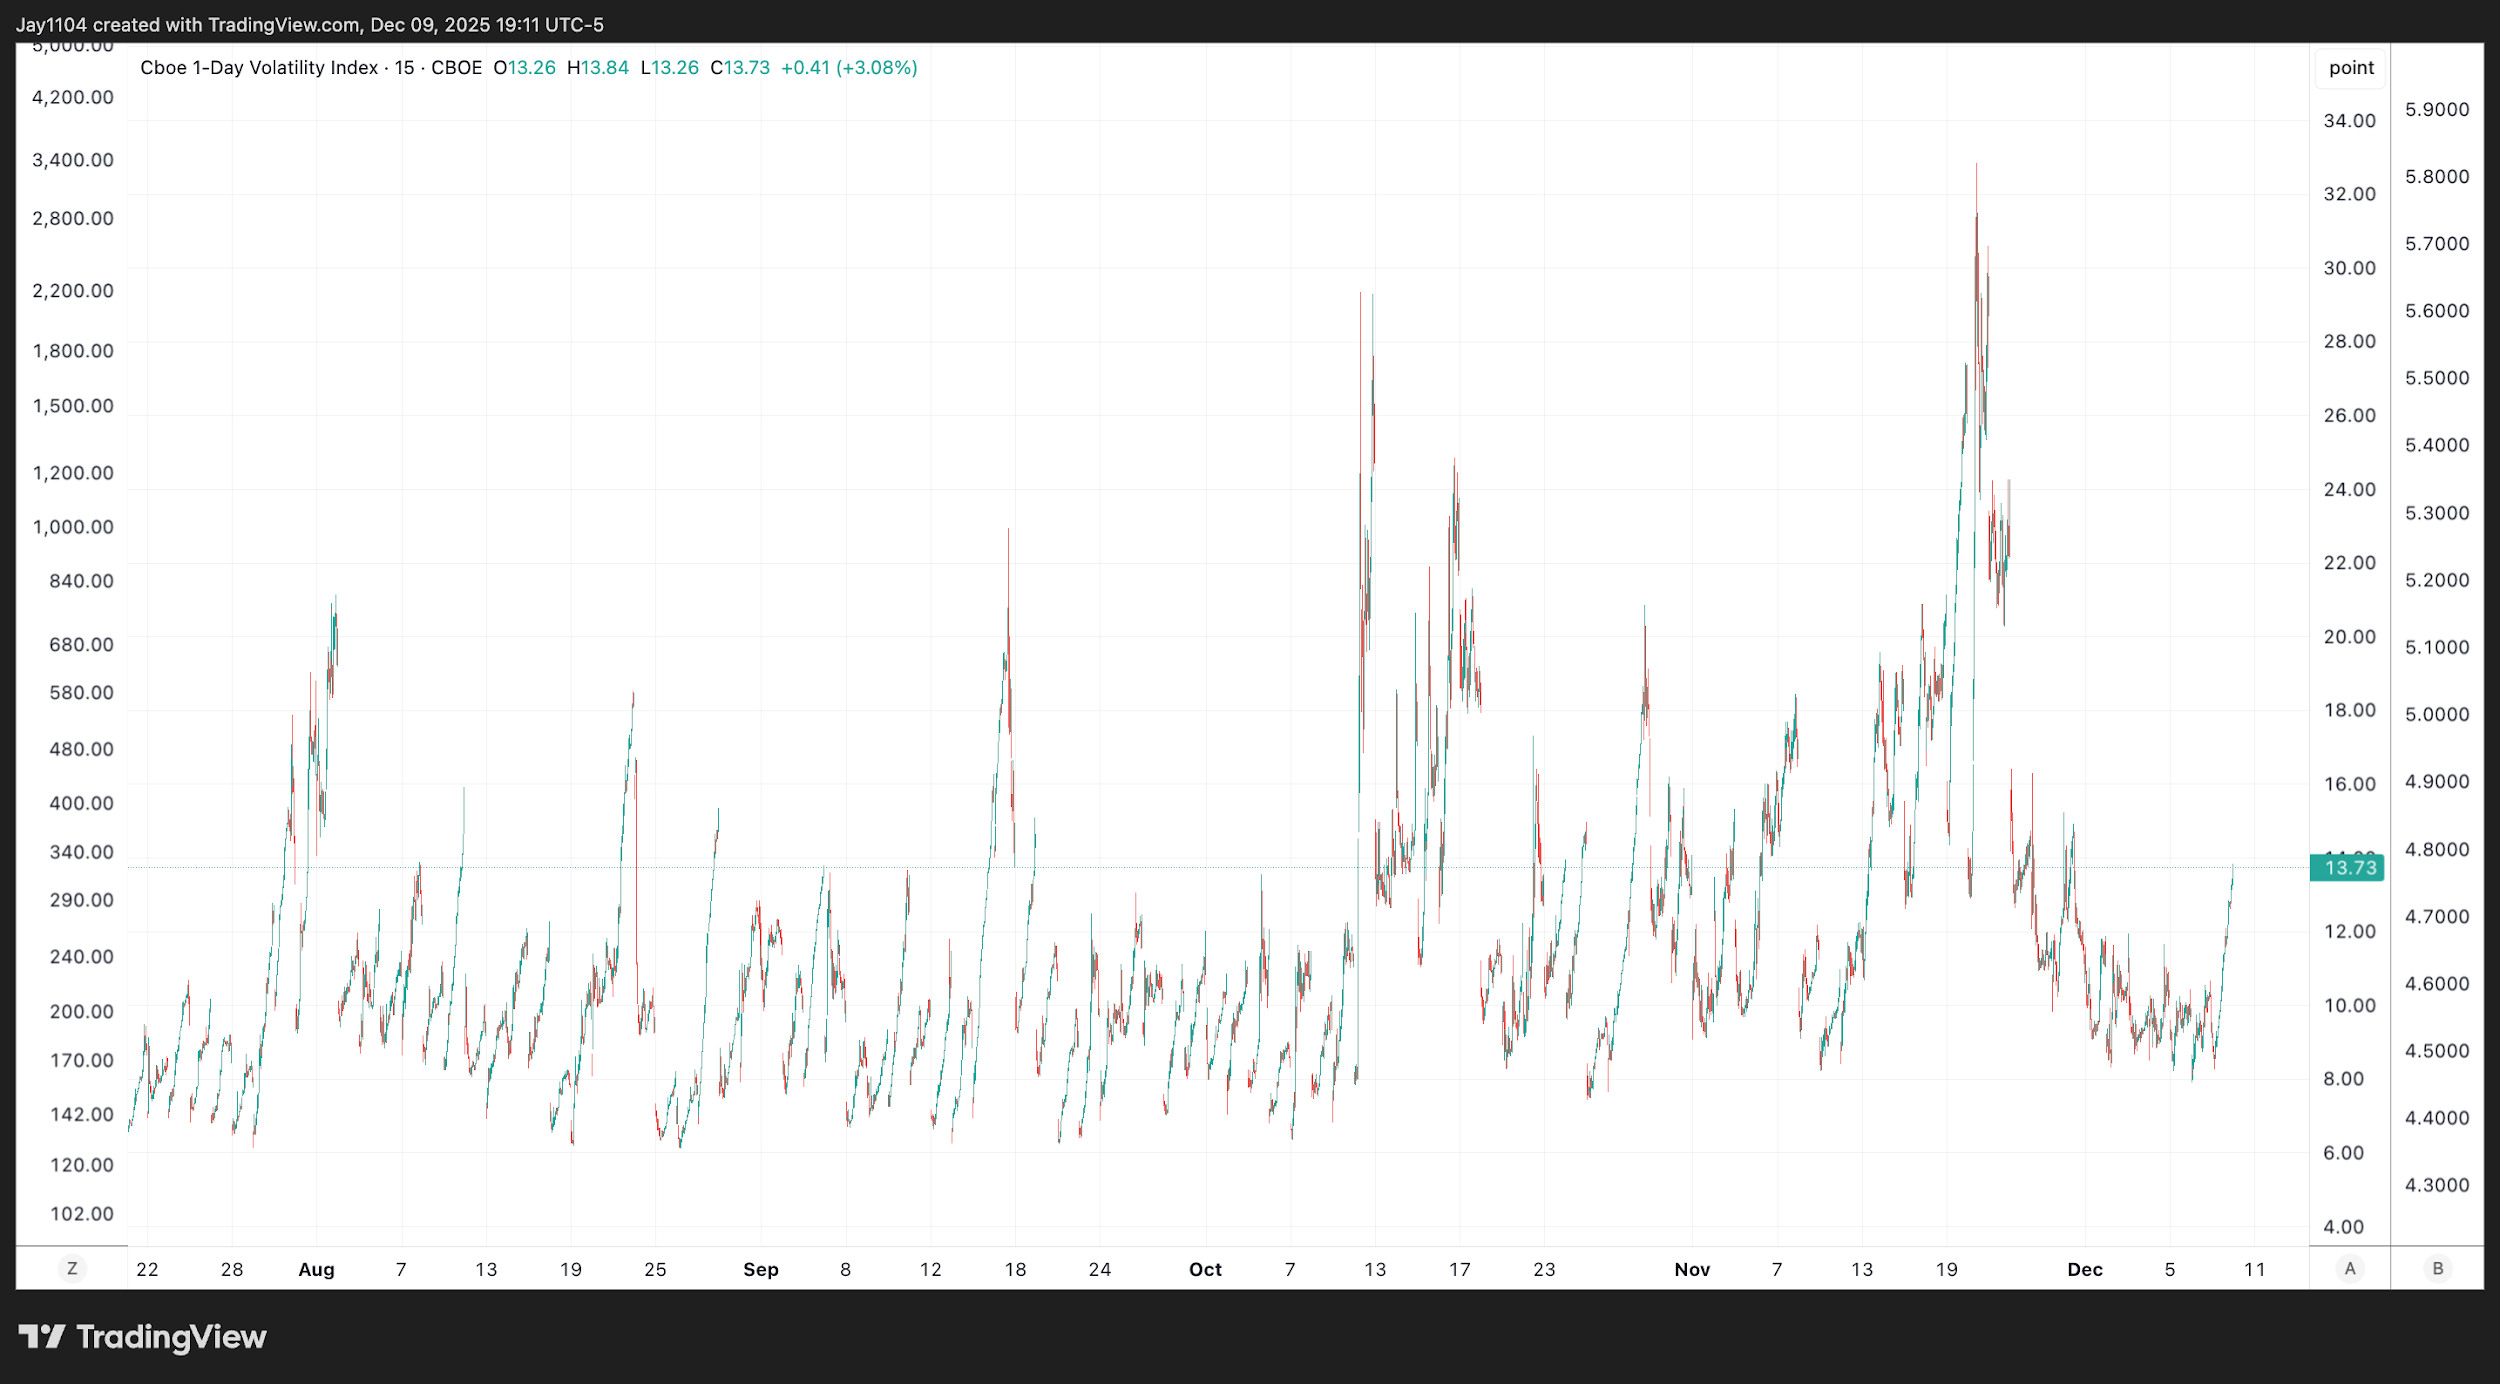
The VIX 1-Day rose today to 13.7, [chart2] signalling that volatility is beginning to increase ahead of the FOMC announcement. However, once the Fed's statement is issued at 2 p.m. Eastern Time, implied volatility could likely decline, at least on the VIX 1-Day. A decline in implied volatility following the Fed announcement has, at times, been associated with equity markets stabilising or moving higher once uncertainty begins to ease. If a similar volatility reset occurs after the press conference, it could contribute to upward pressure on the S&P 500, although market reactions can vary widely depending on broader conditions and how investors interpret the Fed’s messaging.
The only caveat, of course, is that this does not necessarily indicate where any rally might start, nor how far it could extend, or how long it lasts. What it suggests is that once the press conference begins and implied volatility declines, it would not be surprising to see the equity market rally significantly. Once volatility settles after an initial reset, equity gains have often moderated in recent sessions. In general, when implied volatility on the VIX 1-Day Index increases ahead of major events, it has been associated with larger subsequent price swings in the S&P 500, though the direction and magnitude of those moves can vary depending on overall market conditions.
(Source: TradingView)
(Past performance is not a reliable indicator of future results)
[chart2]
The Big Question Mark
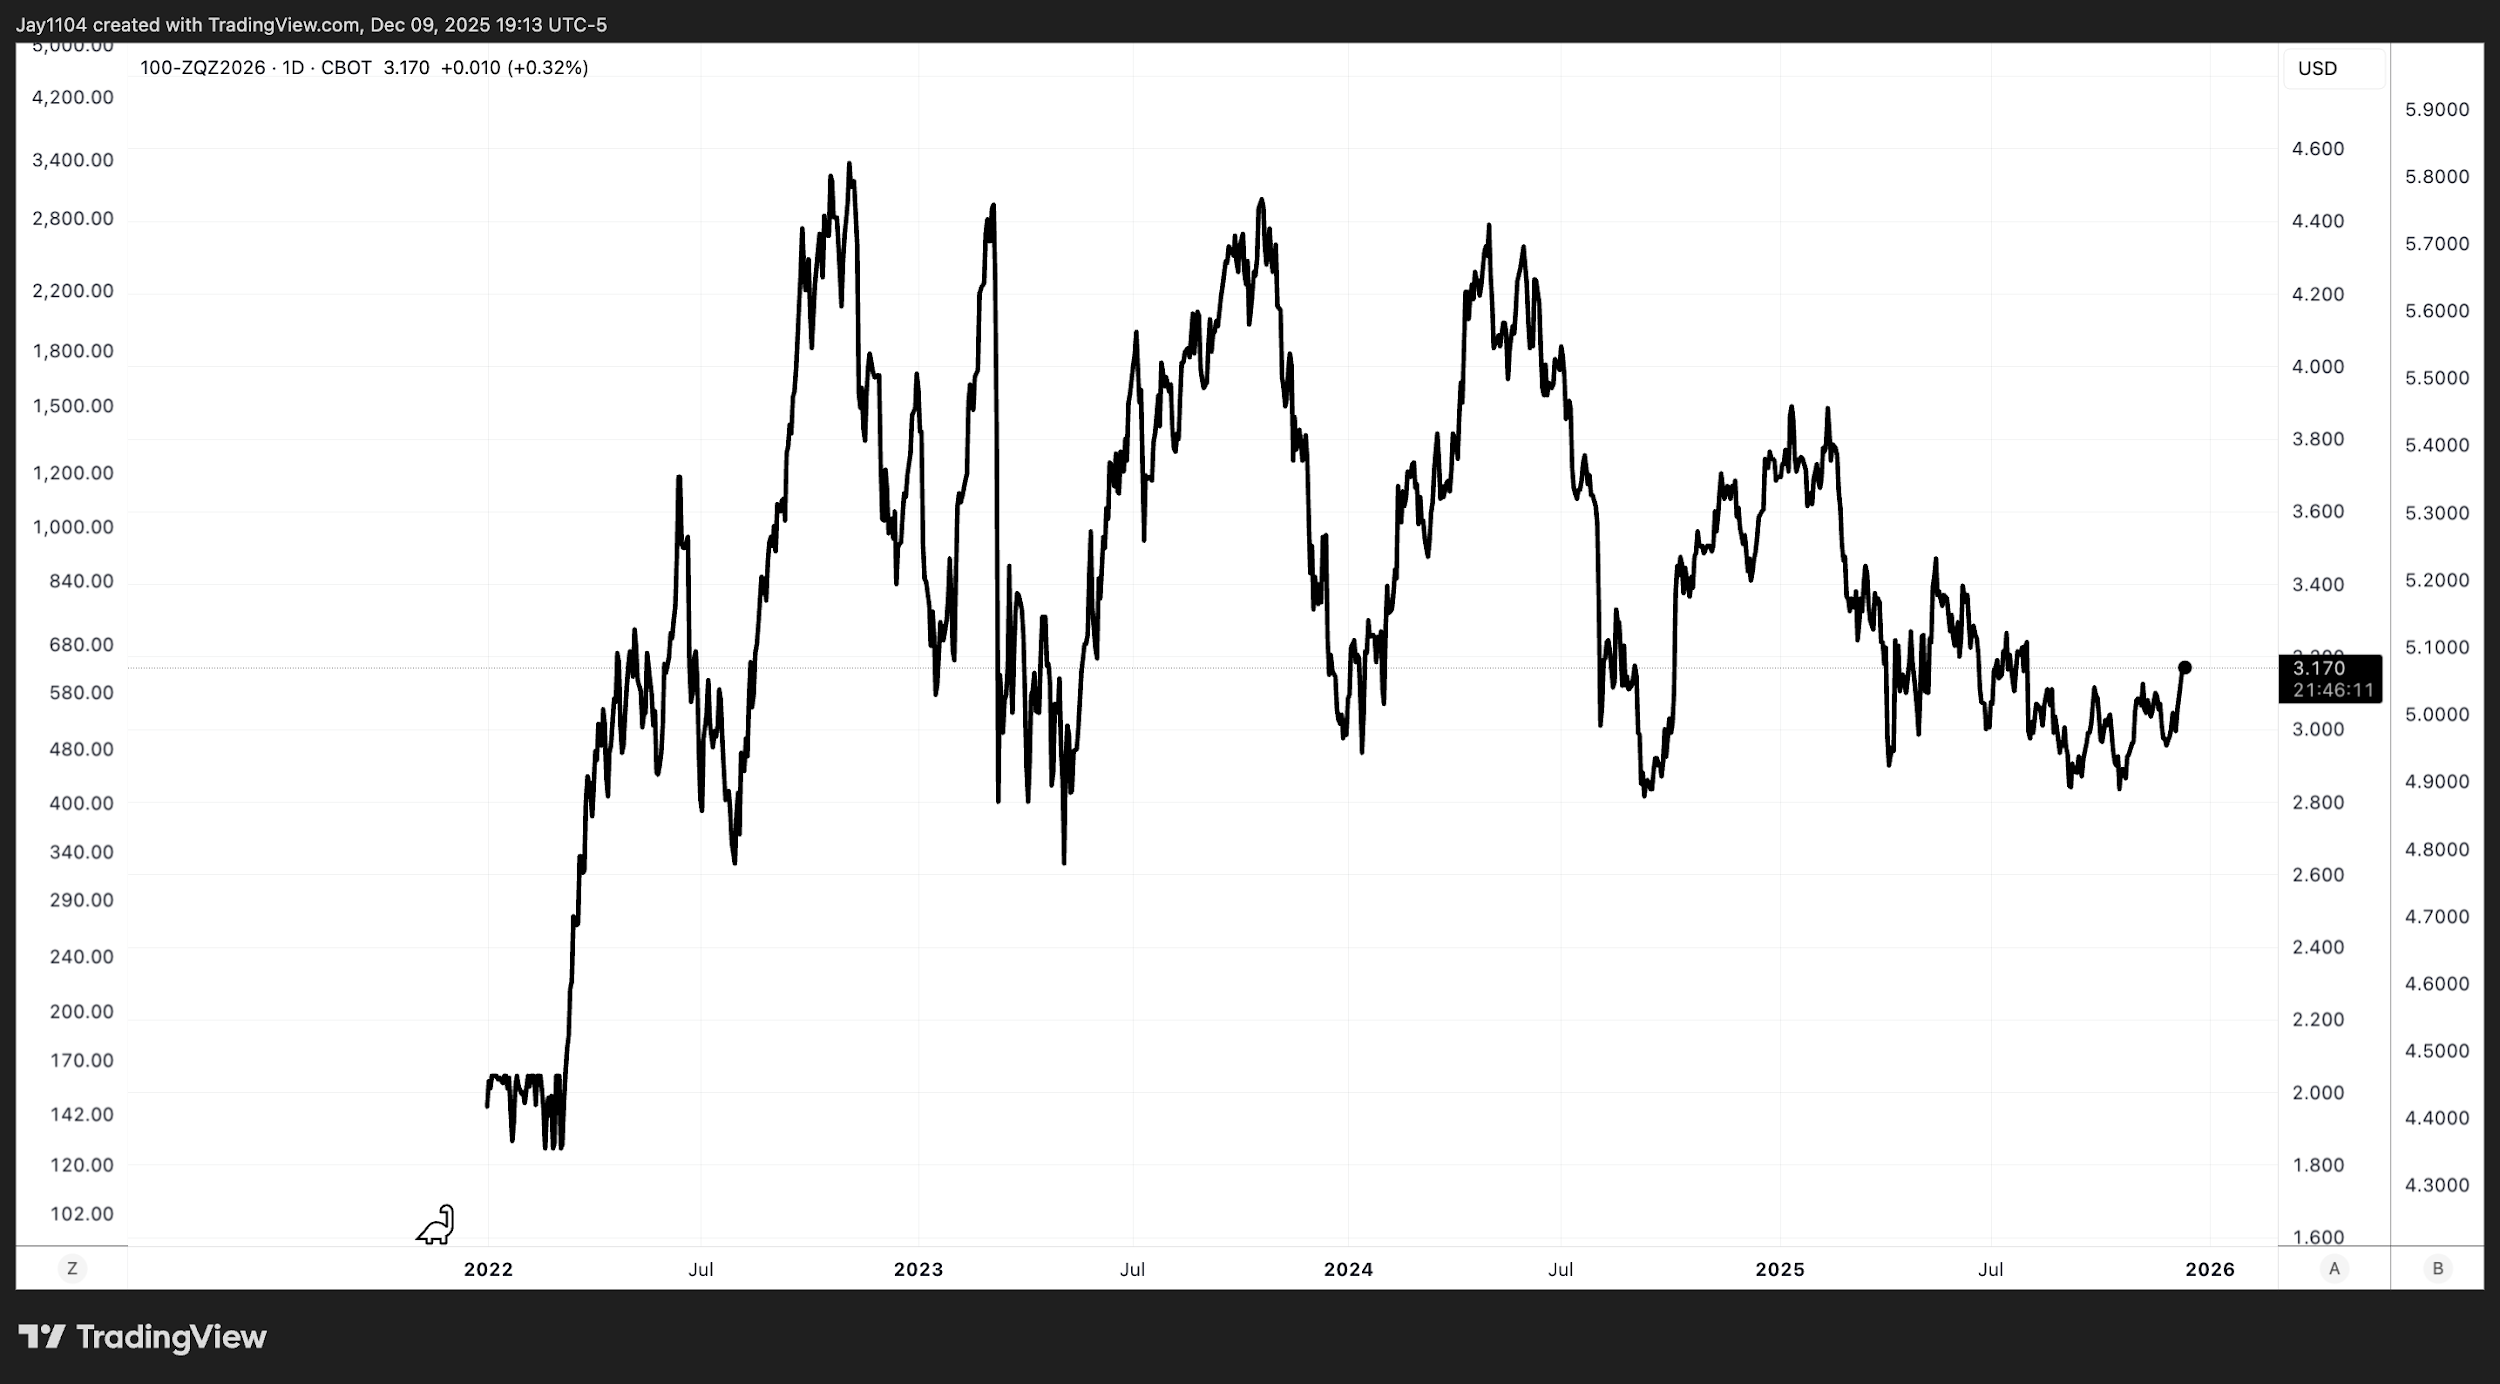
The dot plot, which will be released at 2 p.m. Eastern Time as part of the Summary of Economic Projections, will also be highlighted. The key element within the dot plot is the federal funds rate for 2026. In September, that projection was lowered to 3.4% from 3.6% in June. However, it is essential to note that the market is expecting a significantly lower rate, with the December Fed funds futures price at 3.18%. [chart3] This suggests that the market anticipates the Fed will make more rate cuts than the Fed projected in September.
(Source: TradingView)
(Past performance is not a reliable indicator of future results)
[chart3]
The key point to observe is whether the Fed aligns more closely with the market’s expectations or deviates further, raising the dots. That could be a negative development but not necessarily because the Fed might cut rates less in 2026, but because it could indicate that an incoming Fed Chair may struggle to persuade the committee to adopt a lower-rate policy stance. Such a scenario might increase division within the Fed and, consequently, bring about greater uncertainty.
The Dollar To Benefit
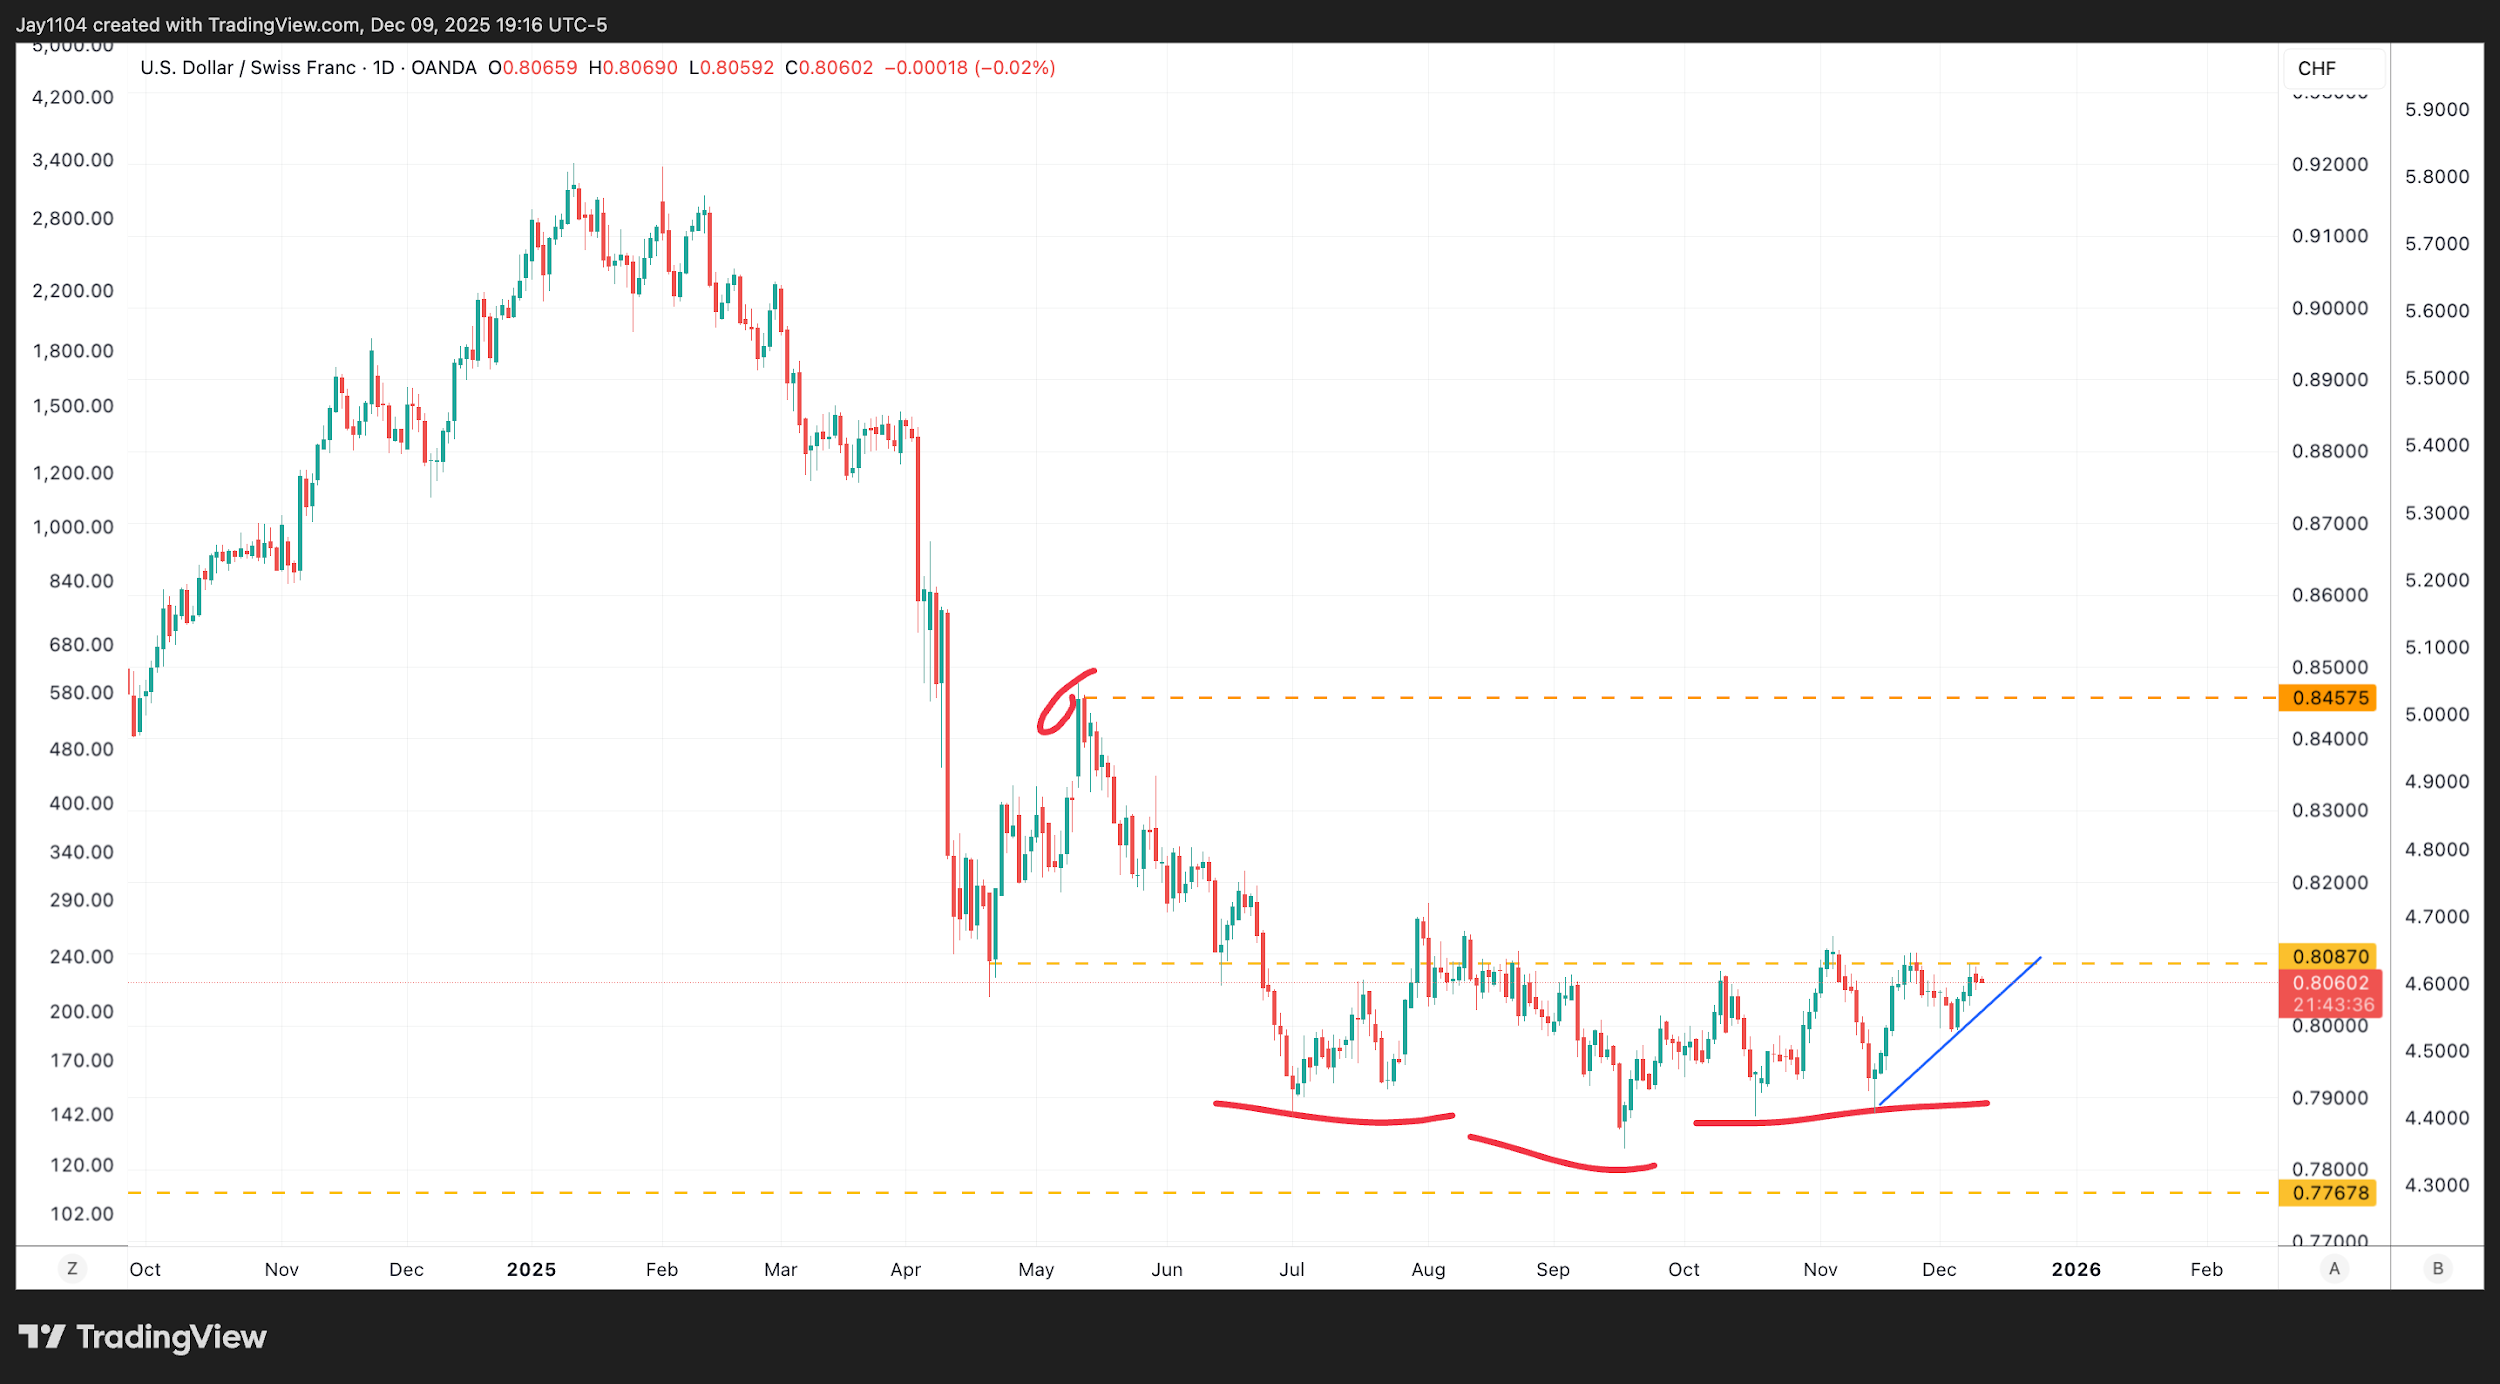
The dollar could also benefit if the Fed delivers a more hawkish outcome than expected, and while the dollar has been stabilising across several currency pairs, USD/CHF remains one of the more structurally constructive setups. The pair continues to meet resistance in the same zone it has struggled to clear in recent weeks, and a break above that area would indicate weakening momentum in the Swiss franc and open the path for further dollar strength; however, if this resistance holds, USD/CHF may continue to move sideways or even reverse lower depending on how rate-differential expectations evolve, making the upcoming price action around this level an important indicator of the trend’s next phase.
(Source: TradingView)
(Past performance is not a reliable indicator of future results)
[chart4]