Quasimodo Trading: How the QM Pattern Works
The Quasimodo pattern can emerge in various markets, such as forex, shares, indices, commodities and cryptocurrency markets – and it’s applicable to a range of timeframes. As with all technical indicators, Quasimodo trading is used as part of a broader technical analysis process rather than as a standalone signal.
Highlights
- The Quasimodo pattern is a price action reversal setup based on swing highs and lows.
- It can appear in rising or falling markets and on multiple timeframes.
- You can use the QM level to define entries, stop-loss placement, and potential targets.
- The pattern is commonly combined with supply and demand zones, candlestick confirmation, and momentum indicators.
- Some charting tools and custom scripts can scan for QM structures, though the pattern may still be interpreted differently depending on how swing points are defined.
What is the Quasimodo pattern?
The Quasimodo is a reversal pattern. It can form near the end of a trend and signal a possible change in direction. It’s sometimes compared with the head and shoulders pattern because both are linked to reversals. However, the Quasimodo pattern focuses more on changes in trend structure and the return to a specific supply or demand zone:
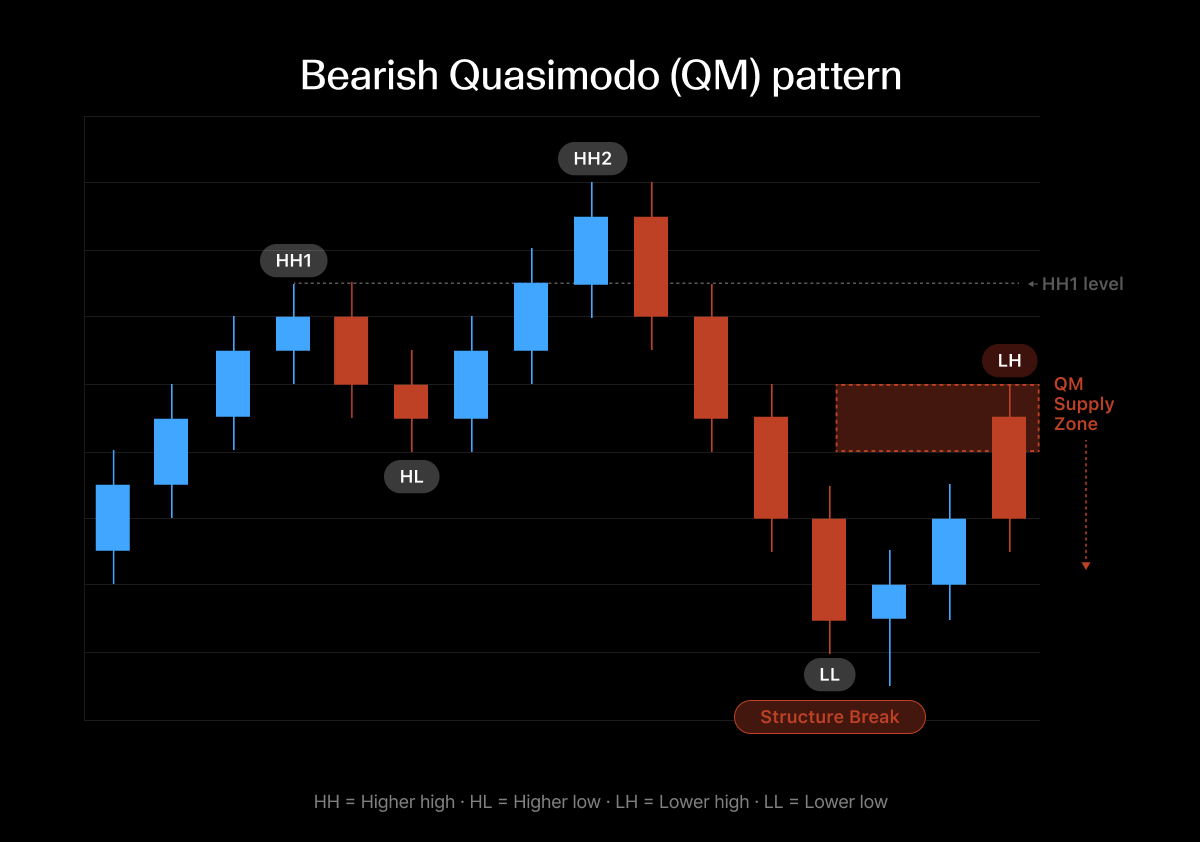
- In a bearish Quasimodo pattern, the price forms higher highs, then breaks below a previous low. It may then rally again, but the next swing high is typically below the head. This area becomes the key Quasimodo level, where some traders look for a possible short setup.
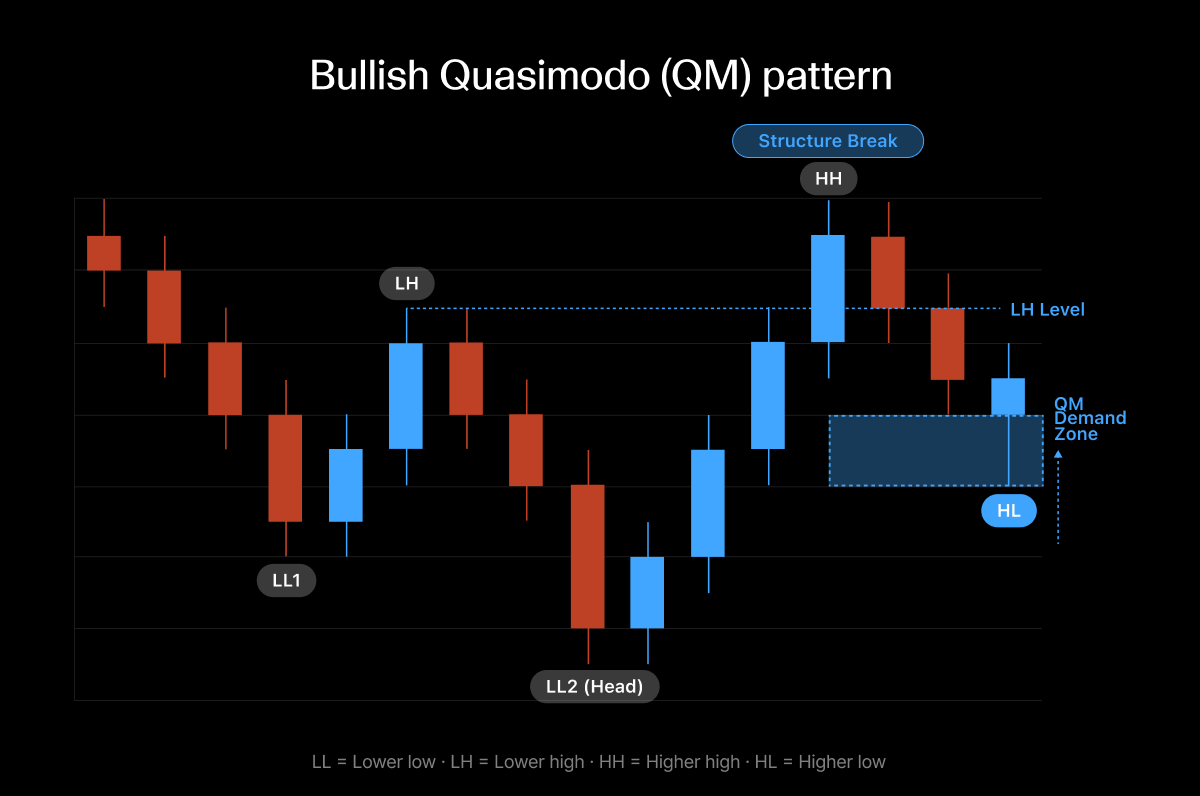
- A bullish Quasimodo pattern works in reverse. The price forms lower lows, then breaks above a previous high. If the price then pulls back and forms a higher low, that area may become the key Quasimodo level, where some traders look for a possible long setup.
Calculating the Quasimodo trading pattern
The Quasimodo pattern does not use a fixed formula. Instead, you can identify it by reading market structure.
Bearish Quasimodo pattern
For a bearish Quasimodo pattern, look for this sequence:
- Price forms a higher high.
- Price pulls back to form a higher low.
- Price rises again to form another higher high.
- Price then falls and forms a lower low, breaking the earlier uptrend structure.
- Price rebounds, but only forms a lower high.
That final lower high is often referred to as the Quasimodo level. Some traders treat it as a supply zone where selling pressure may return.
Bullish Quasimodo pattern
For a bullish Quasimodo pattern, the logic works in reverse:
- Price forms a lower low
- Price rebounds to form a lower high
- Price drops again to form another lower low
- Price then rises and forms a higher high, breaking the earlier downtrend structure
- Price pulls back, but only forms a higher low
That higher low becomes the key QM level and some traders treat it as a demand zone.
Because the pattern is based on structure rather than a mathematical reading, interpretation matters. Two traders may identify slightly different swing points on the same chart. As a result, some use additional tools to refine the setup, such as the 50%–61.8% Fibonacci retracement zone, average true range (ATR) for volatility, or nearby support and resistance levels.
How to use the Quasimodo trading pattern
A Quasimodo setup is usually assessed in two stages rather than traded immediately.
- Identify a market trendFirst, the trader identifies a market trend and checks whether that trend structure has broken down. This break matters because the pattern is based on a shift in market structure.
- Mark the QM zoneIn a bearish setup, this is the area around the final lower high. In a bullish setup, it's the area around the final higher low. This zone can act as the reference point for trade planning.
- Confirmation
You may wish to wait for the price to return to that area rather than entering immediately. This retest can help show whether the market confirms or invalidates the setup
Quasimodo pattern and other indicators
Confirmation may come from other forms of technical analysis, such as:
- Pin bar or engulfing candle
- Momentum shift on the MACD
- RSI readings that suggest overbought or oversold conditions
- Increased volume or tick volume near the QM level
*Standard stop-loss orders are not guaranteed. Guaranteed stop-loss orders (GSLOs) incur a fee if activated.
Opportunities and limitations of the Quasimodo pattern
The Quasimodo pattern can provide a structured framework for price action analysis, but it also has risks and limitations.
| Factor | Advantages | Disadvantages |
|---|---|---|
| Entry timing | Can help identify a possible reversal before a new trend is fully established | The pattern does not always form in a clear, textbook shape |
| Risk management | The QM level can provide a logical reference point for risk planning | Tight stop-losses may still be affected by volatility, slippage, or false breaks |
| Versatility | Can be applied across forex, shares, indices, commodities, and cryptocurrencies | Performance can vary by timeframe, market conditions, and execution |
| Structure | Uses visible swing points and clear invalidation logic | Interpretation can be subjective and may vary from one trader to another |
One of the main strengths of the strategy is its clarity. Once the structure is defined, you have a clearer framework for assessing risk and reward. However, that does not remove uncertainty. False signals can still occur, especially in choppy or news-driven markets.
As with any technical strategy, the Quasimodo pattern may be more useful when combined with broader analysis rather than used in isolation.
FAQ
What is the Quasimodo pattern used for in trading?
The Quasimodo pattern is used to identify possible reversal points after a trend structure begins to break down. You can use it to map out potential entry points, stop-loss placement and profit targets around a specific supply or demand zone.
What is the best Quasimodo setting for day trading?
There is no single setting because the Quasimodo pattern is not a fixed indicator. Some day traders track it on intraday charts, such as the 15-minute or one-hour chart, and use a higher timeframe for broader market context. The most suitable timeframe depends on your approach, the asset being traded, and prevailing volatility.
Which indicator works best with the Quasimodo pattern?
There is no universal best indicator, but you can combine the Quasimodo pattern with RSI, MACD, Fibonacci retracement levels, or volume-based analysis. These tools can offer additional confirmation, though they don't remove risk or guarantee an outcome.