Technical Overview: Netflix Ahead of Earnings
Netflix approaches a key technical area as it approaches Q3 earnings, with the technical setup suggesting this could be a make-or-break moment for the stock.
After an extended uptrend that drove shares to all-time highs earlier this year, the streaming giant now finds itself in a position where earnings results could determine whether the momentum continues or a significant correction unfolds.
Monthly Chart: Stalled at the Peak
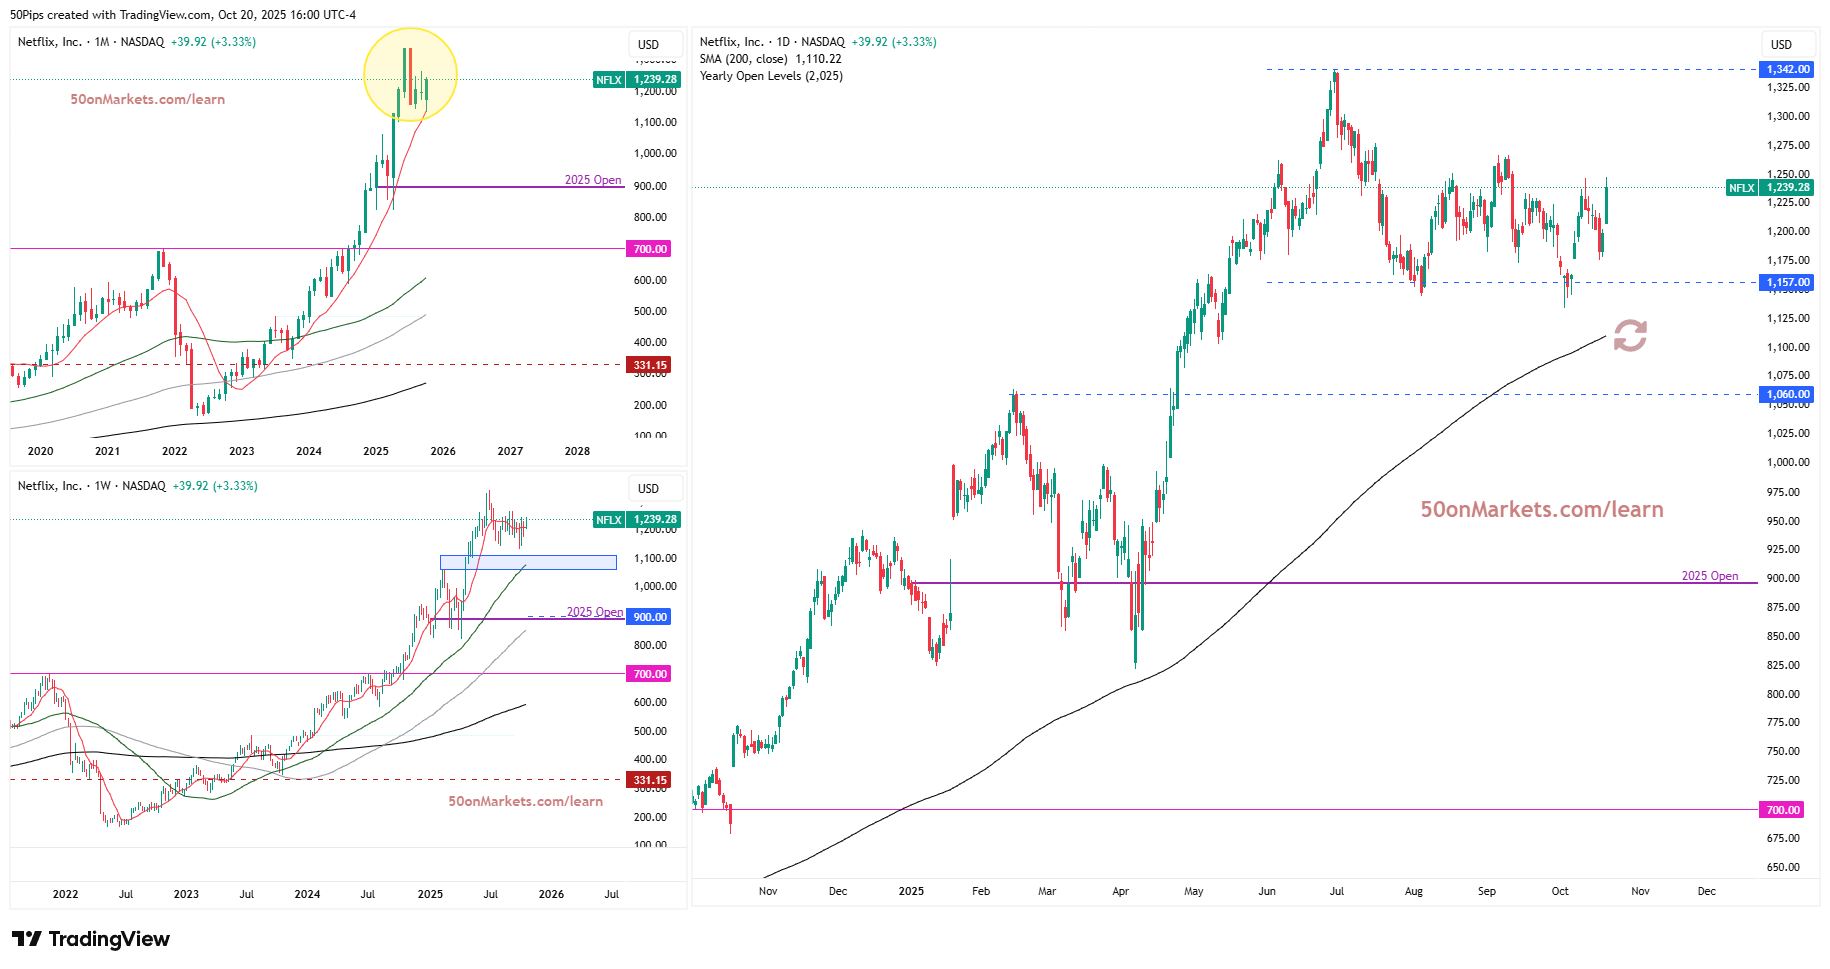
The monthly perspective reveals a potentially notable signal that began three weeks ago with an aggressive negative close that engulfed the previous month's candle. This bearish engulfing pattern near all-time highs represents a potential significant top, with the stock now trapped within that monthly range. The 10-month moving average is providing critical support, but the market's inability to attract new buyers above the highs might suggest exhaustion at these elevated levels.
Monthly closes above or below the 10-month moving average represent important potential momentum shifts, serving as a key reference point for market timers and systematic trend-following strategies. A decisive monthly close below this level could lead to program selling from CTAs and momentum funds, potentially accelerating any downside move. Conversely, a monthly close above the current range while maintaining support above the 10-month MA could suggest that the consolidation was merely a pause rather than a reversal, potentially reigniting both institutional and retail buying.
With approximately ten trading days remaining in October, the earnings report will play a pivotal role in determining which side of the 10-month moving average Netflix closes the month, making this not just a fundamental catalyst but a critical technical inflection point.

Weekly Chart: Lower Highs and Neutral Momentum
The weekly timeframe provides clearer insight into the current structure. Netflix has been making a series of lower highs and lower lows while the 10-week moving average has flattened out, with crucial support anchored around the 1,100 level. This zone represents a convergence of multiple technical factors: the 50-day moving average, previous resistance from February 2025 now acting as support, and a key psychological level.
A weekly close below this support zone could trigger a significant unwind, potentially sending the stock back to the 900 mark and 2025 opening levels. Beyond that, the next major support doesn't appear until the 200-day moving average that is starting to move into the 700 mark — a level that coincides with the major swing high from October-November 2021, from which Netflix subsequently corrected over 70%.
Daily Chart: The Chop Zone
The daily chart helps us zoom in on the technicals. Netflix is currently trading, give or take, within 9% of both its all-time highs and that crucial support anchored around the 1,100 level and the 200-day moving average. This positioning makes the upcoming earnings particularly significant, as the stock sits equidistant between potentially confirming continuation or breakdown scenarios.
A close below the 200-day moving average could confirm short-term weakness and coincide with a breach of the 1,100 support area. However, such movement would remain consistent with broader market volatility rather than a definitive trend reversal.
Conversely, a break and close above the all-time highs could suggest continuation of the prior uptrend, although no outcome is certain and price action remains dependent on post-earnings sentiment.
The Path Forward
Naturally, time will tell how this setup plays out, with earnings potentially serving as the catalyst for either of these breakout scenarios. However, traders often forget that markets can not only go up or down, but that there is a third option—they can go sideways. Netflix could just as easily continue consolidating within its current range, frustrating both bulls and bears.
(Source: TradingView)
(Past performance is not a reliable indicator of future results)