Markets Suffer Deep Intraday Reversals Across Equities and Crypto
It was a harsh day for risk assets, with markets opening higher only to give back all those gains, finishing sharply lower.
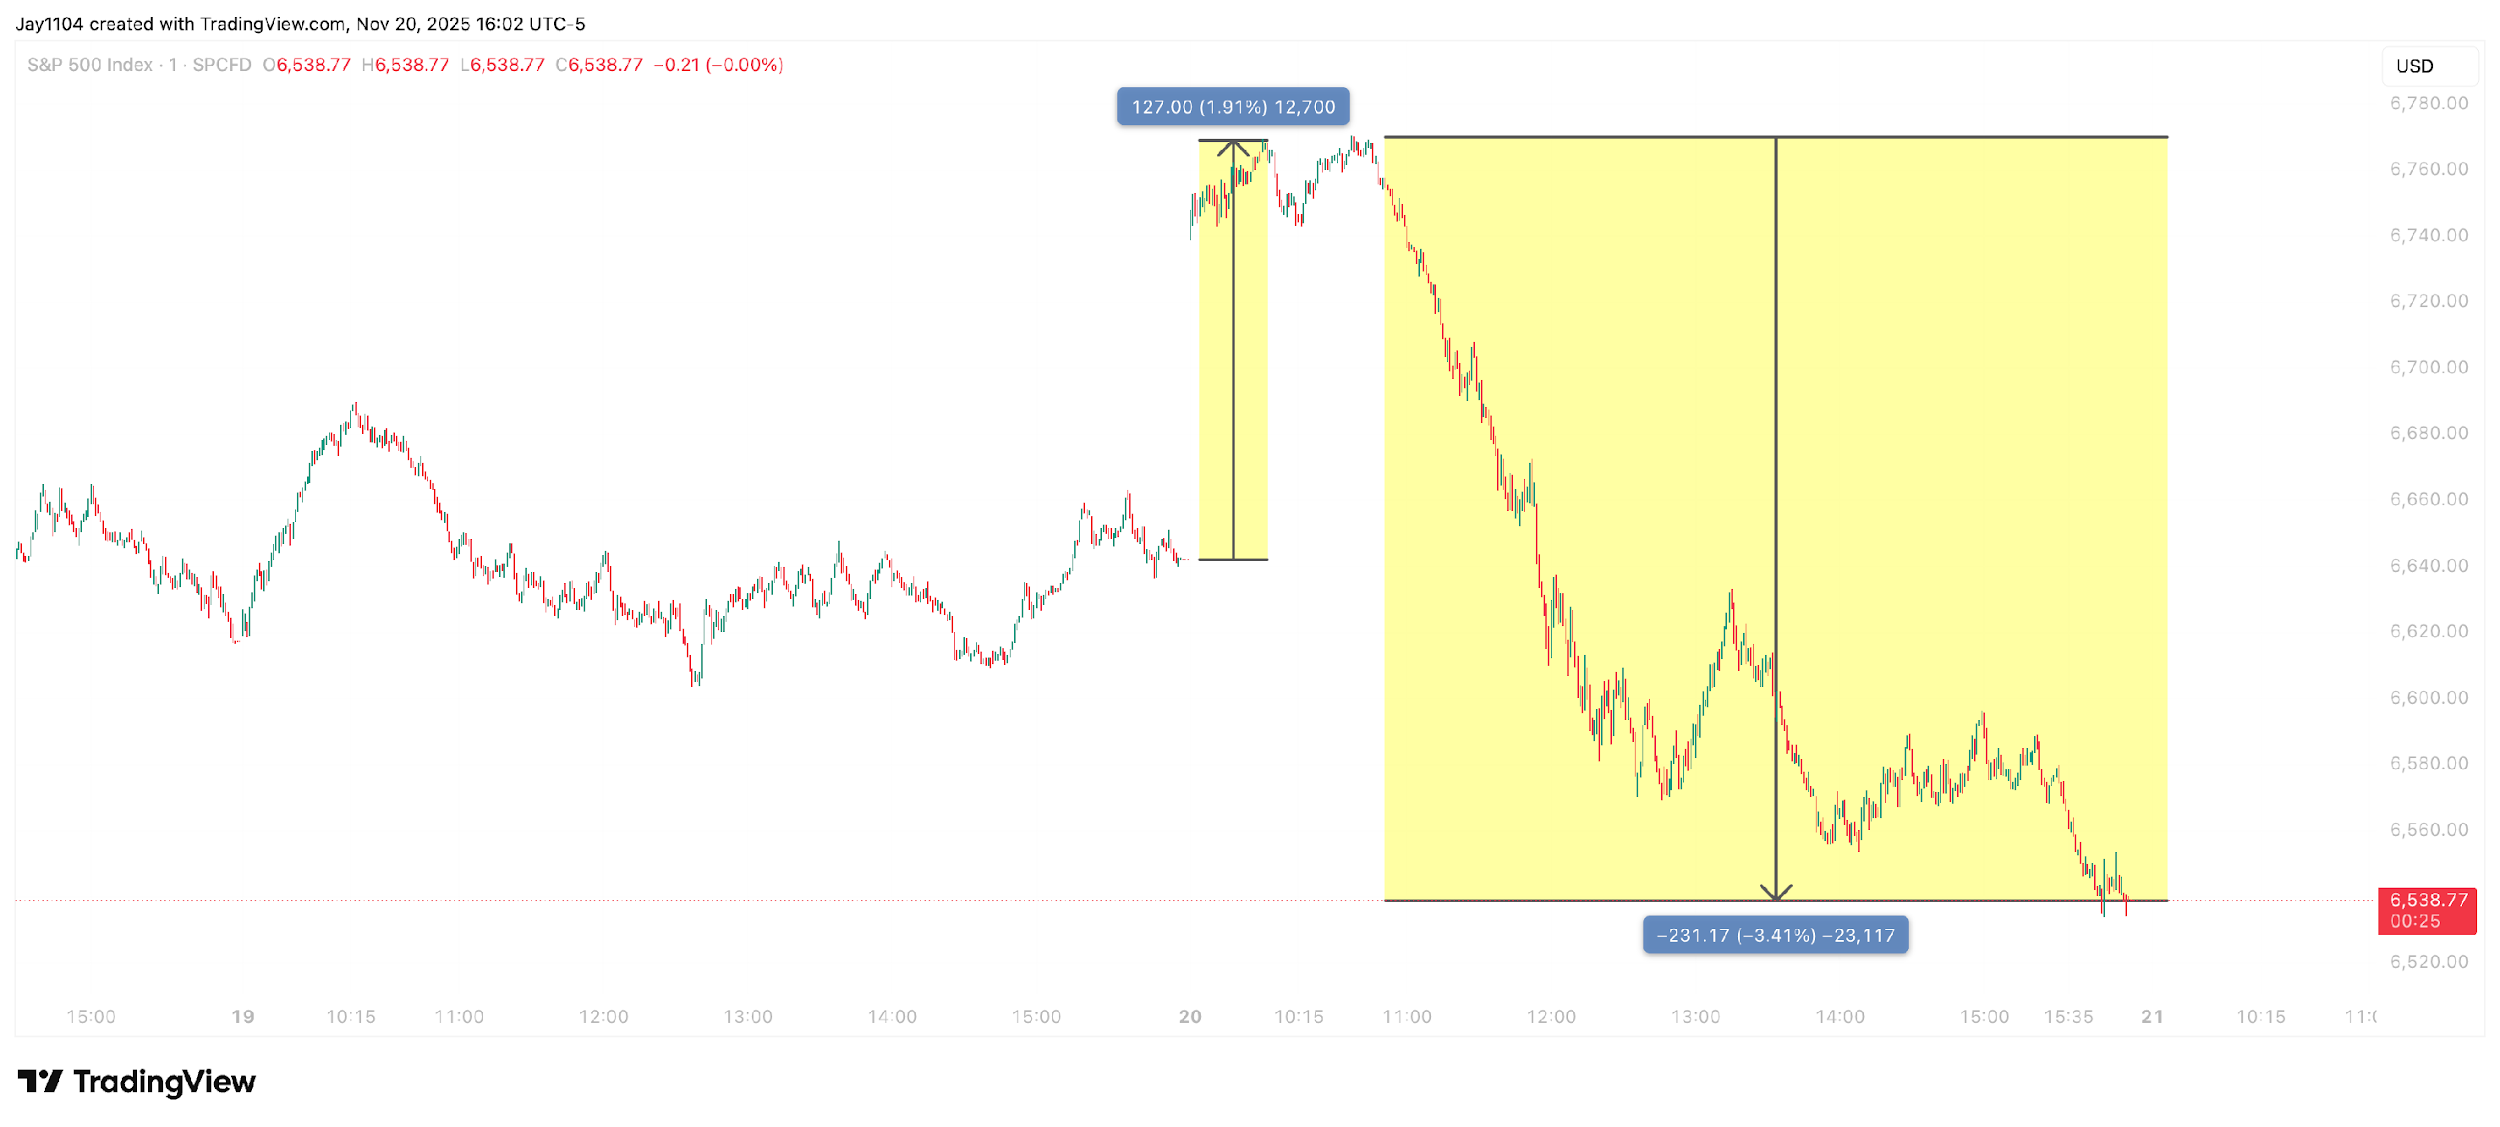
It was a harsh day for risk assets, with markets opening higher only to give back all those gains, finishing sharply lower. The S&P 500 exemplified this. The index was nearly 2% higher at one point, but it suddenly reversed around 10:45 a.m. Eastern Time, with the index dropping more than 3% from its intraday high [chart1]. It was a major intraday reversal and raises serious questions about where this market is headed next.
(Source: Morningstar)
Past performance is not a reliable indicator of future results.
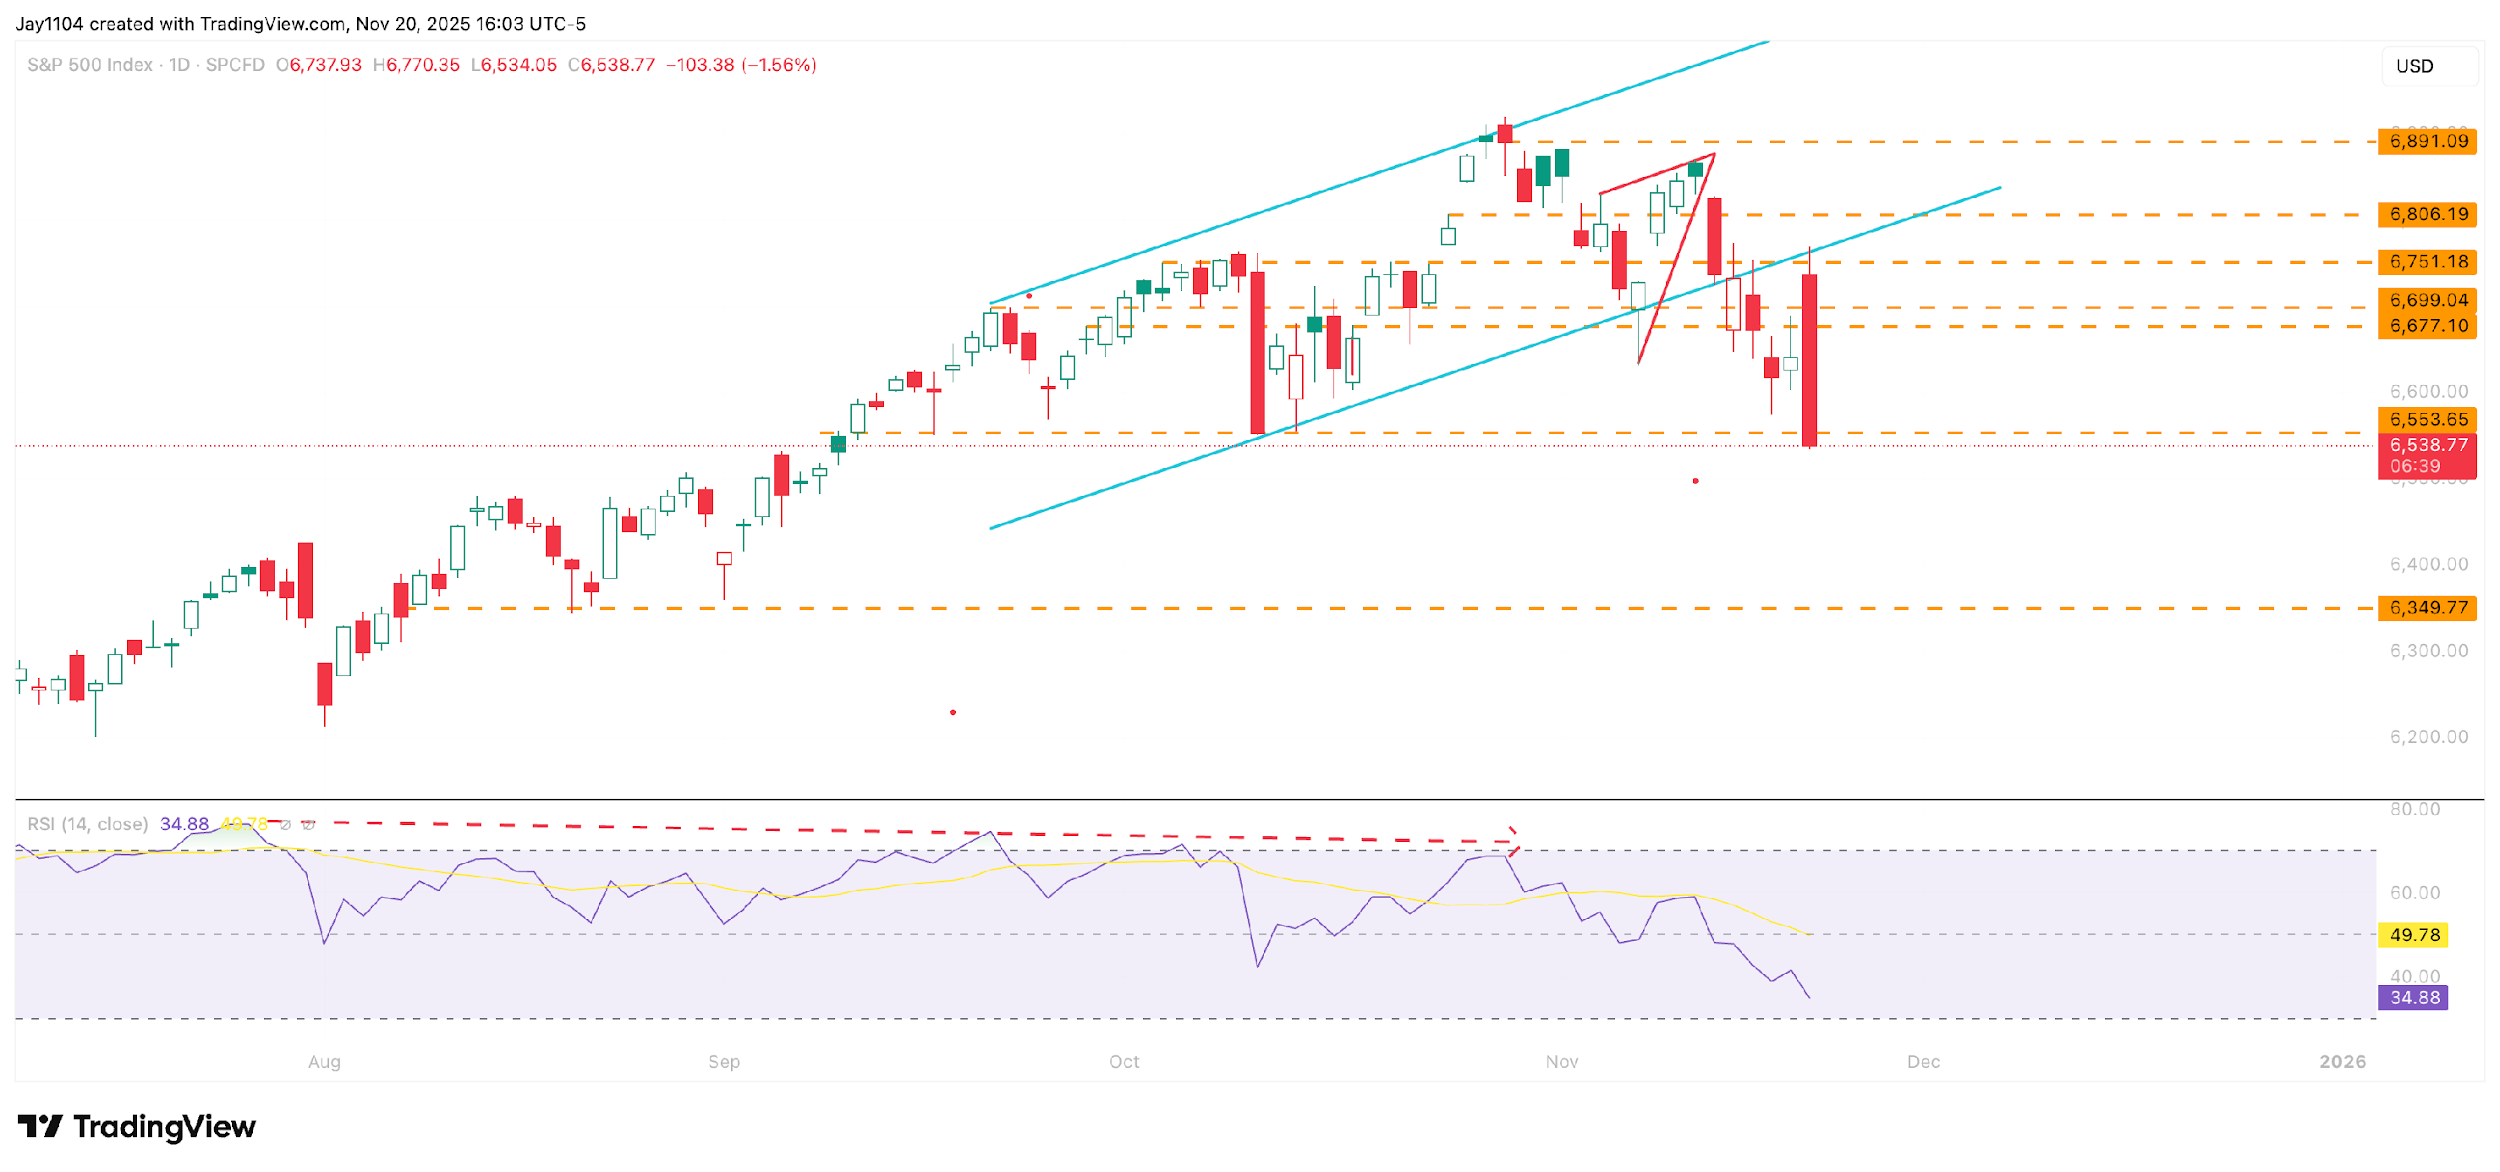
The S&P 500 rose right up to a trendline that was established in mid-June [chart2]. It reached that trendline and then reversed sharply off it, undercutting even the most recent lows and closing at its lowest level since mid-September. For now, the index appears to be trying to hold around 6,550, but with options expiry on Friday, 21 November, that could change quickly. If the region at 6,550 is lost, the index could slip to around 6,400.
(Source: Morningstar)
Past performance is not a reliable indicator of future results.
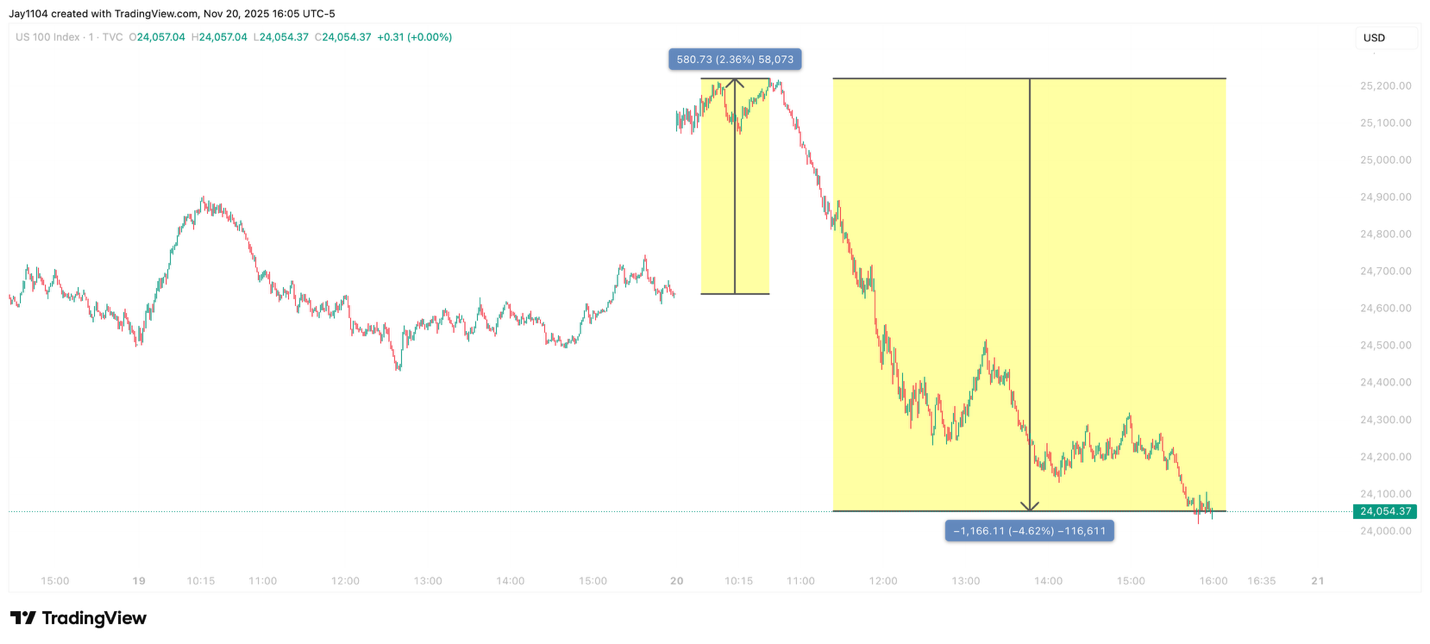
For the NASDAQ 100, the intraday reversal was even more severe, with the index falling more than 4% from its high around 10:40 a.m. The NASDAQ actually dipped below a significant uptrend that began at the start of May and tried to regain that level today, but it failed. It now rests on a support region at 24,100 [chart3]. However, a break below 24,100 could open the door for the NASDAQ to slip back towards 23,000, or possibly even 22,775.
(Source: Morningstar)
Past performance is not a reliable indicator of future results.
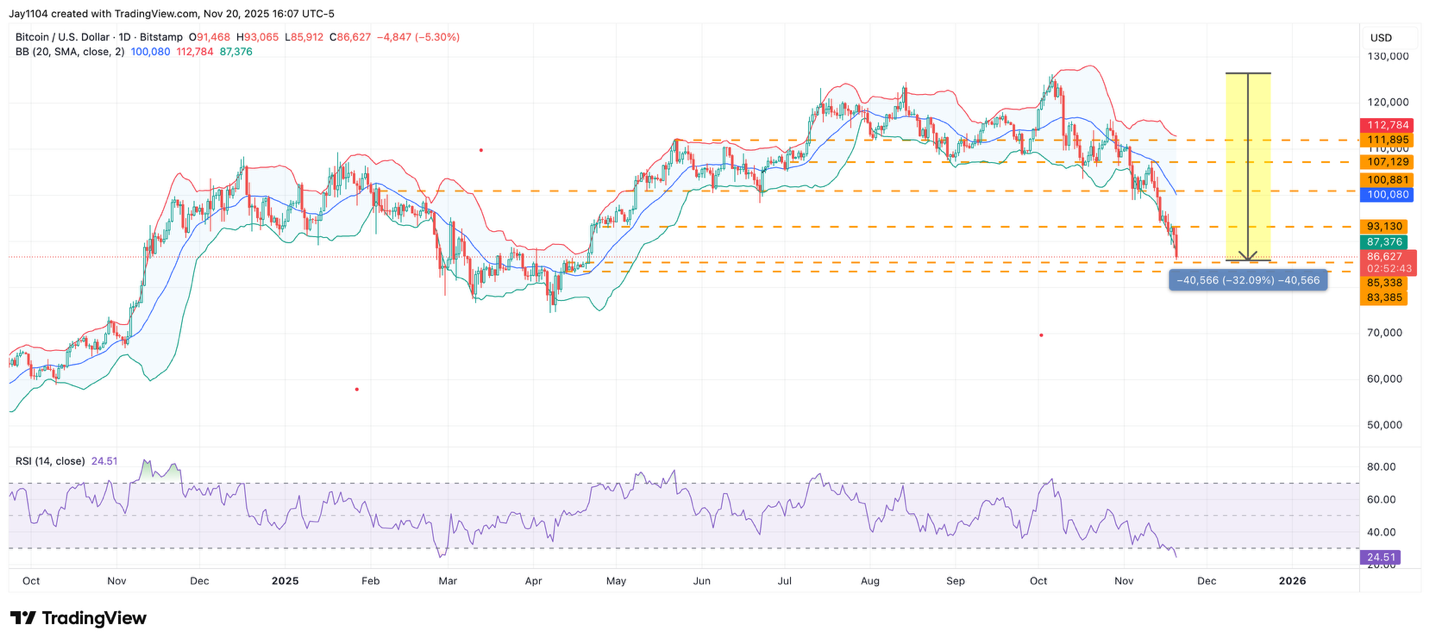
The decline was worse for Bitcoin, even without accounting for the drop from the intraday high. The cryptocurrency fell by nearly 5% during the day and is increasingly approaching the support zone between $83,000 and $85,000 [chart4]. A breach of the $83,000 level could lead to a decline towards approximately $74,000. However, Bitcoin is also entering an oversold zone, testing the lower Bollinger Band, and with the RSI around 24.5, a sharp rebound could therefore happen at any moment. Nonetheless, it seems the markets are simply seeking a stable area for the cryptocurrency where buyers might finally appear in larger numbers.
At this point, Bitcoin is down about 30% from its recent high on 6 October at roughly $126,000.
 (Source: Morningstar)
Past performance is not a reliable indicator of future results.
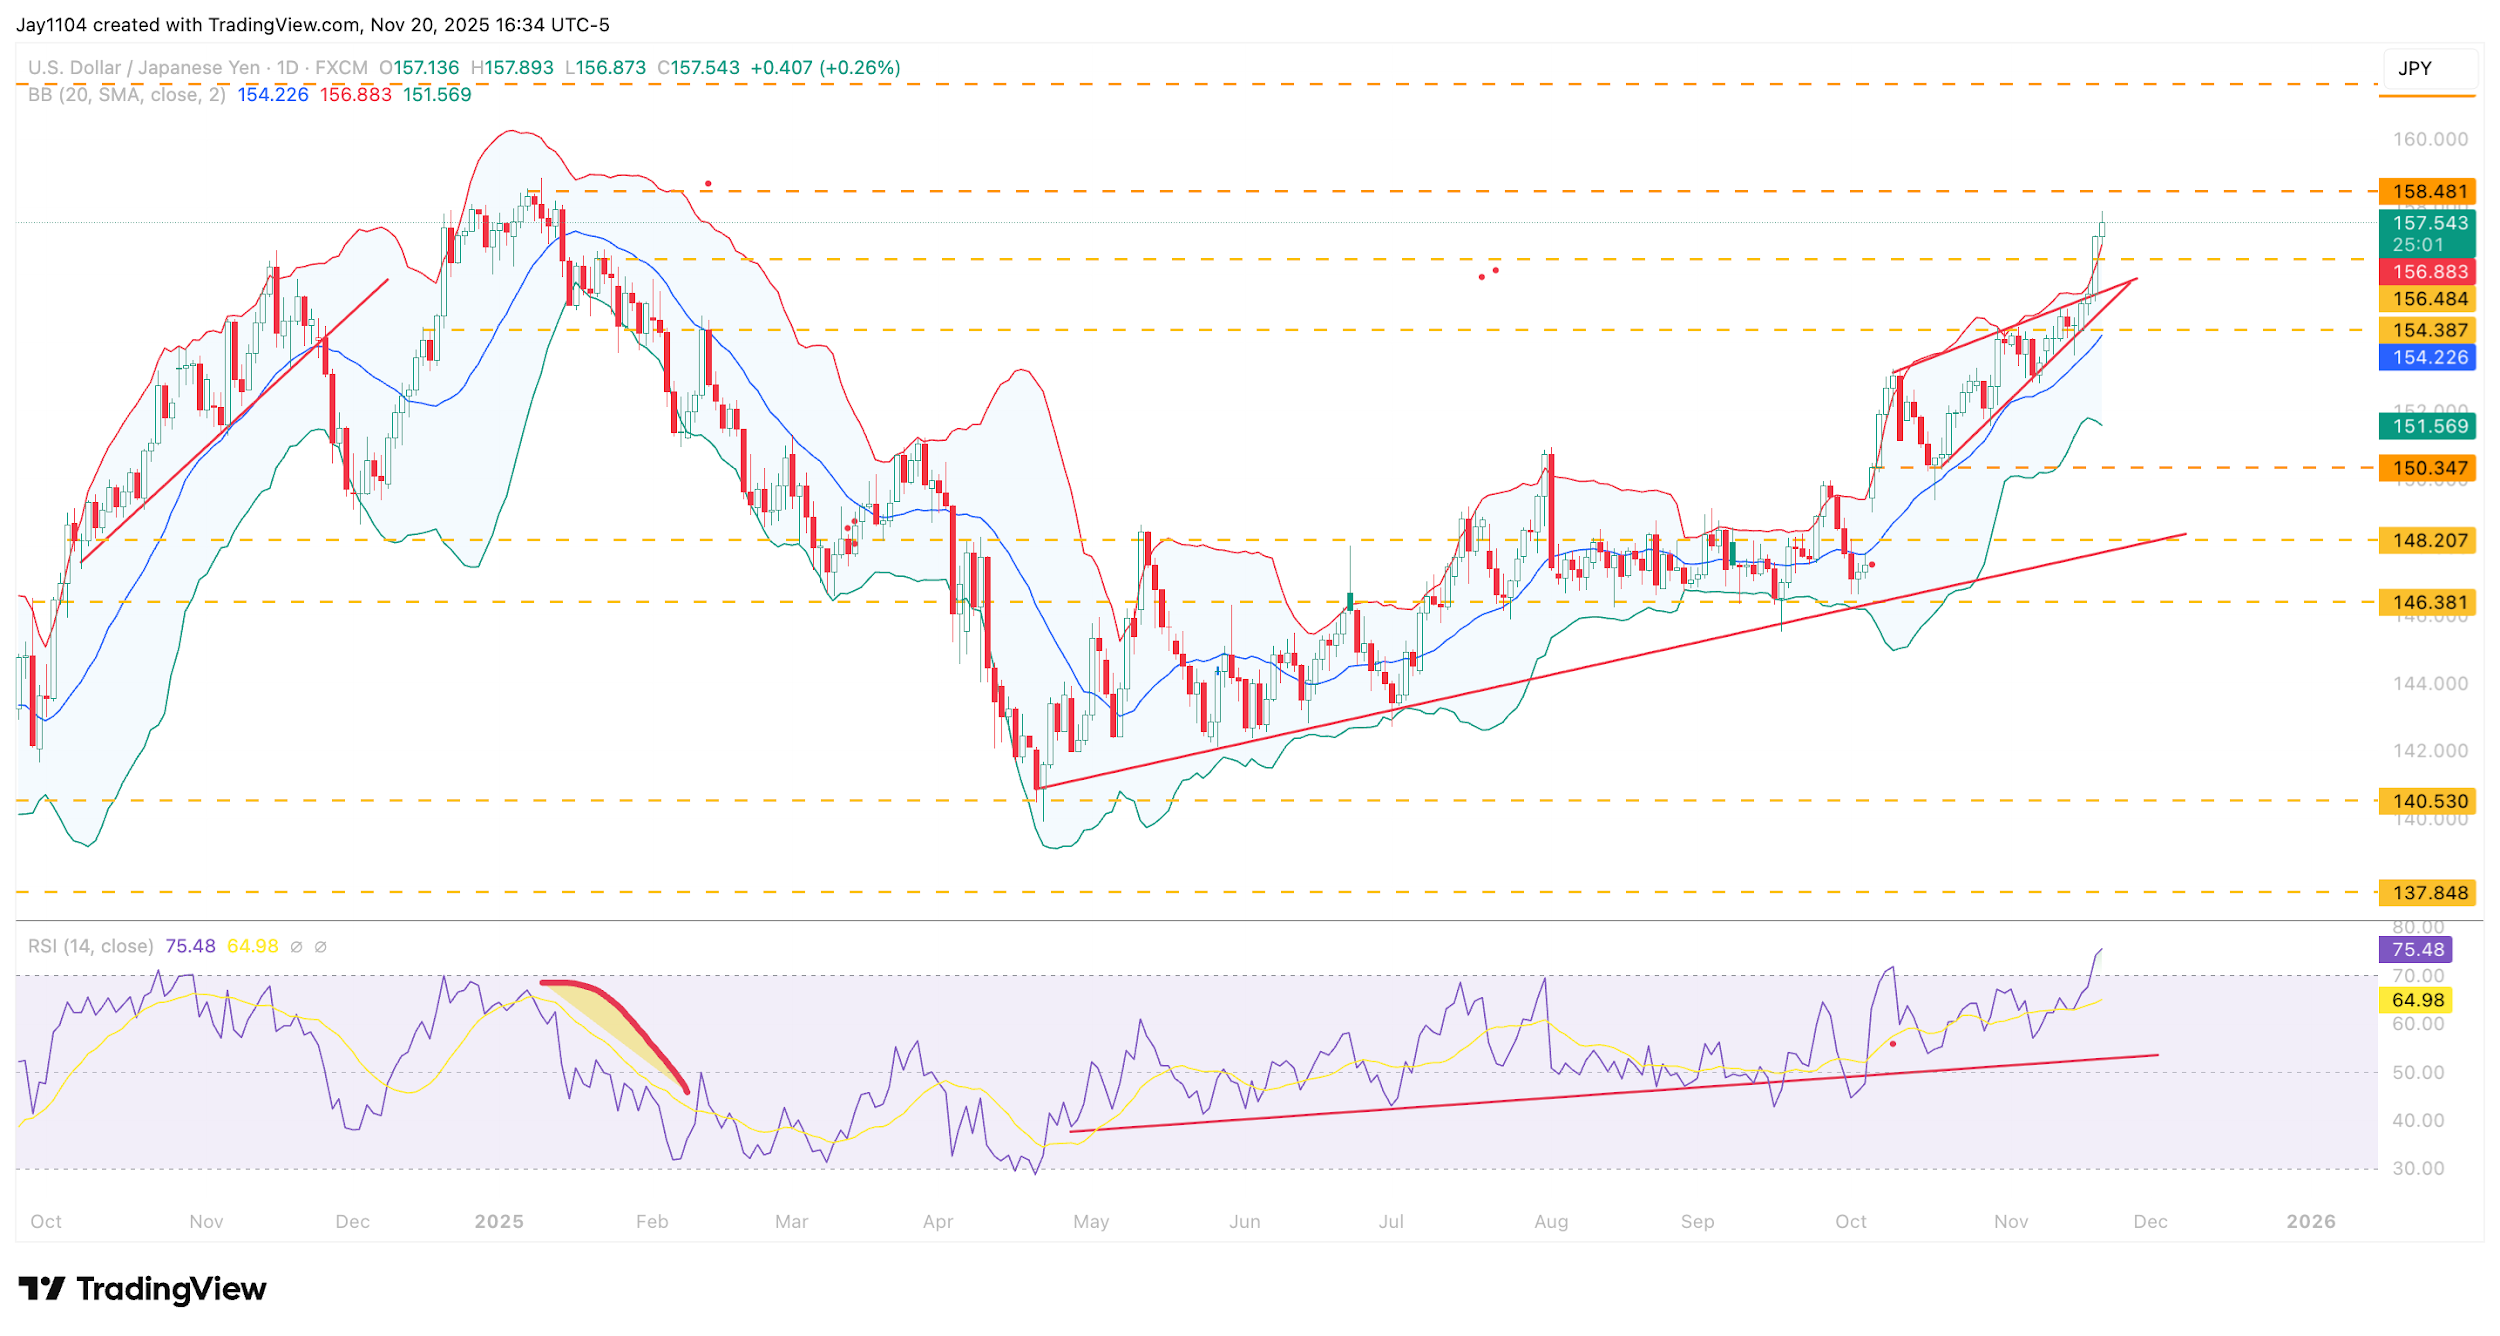
The lower job revisions took some of the steam out of the better-than-expected non-farm payrolls report, but it still supported the dollar's strength against the yen, with the yen rising to around 157.60 and approaching the upper resistance level at 158.50 [chart5]. If the yen weakens through 158.50, the next resistance zone would be approximately 161. However, much like Bitcoin, the yen appears overextended here, with the RSI above 70 and trading above its upper Bollinger Band, so caution is warranted for a potential pullback — or, in this case, a possible strengthening of the yen. Much of this relates to the Japanese government’s plan to increase fiscal stimulus, suggesting headline risk remains in either direction.
(Source: Morningstar)
Past performance is not a reliable indicator of future results.
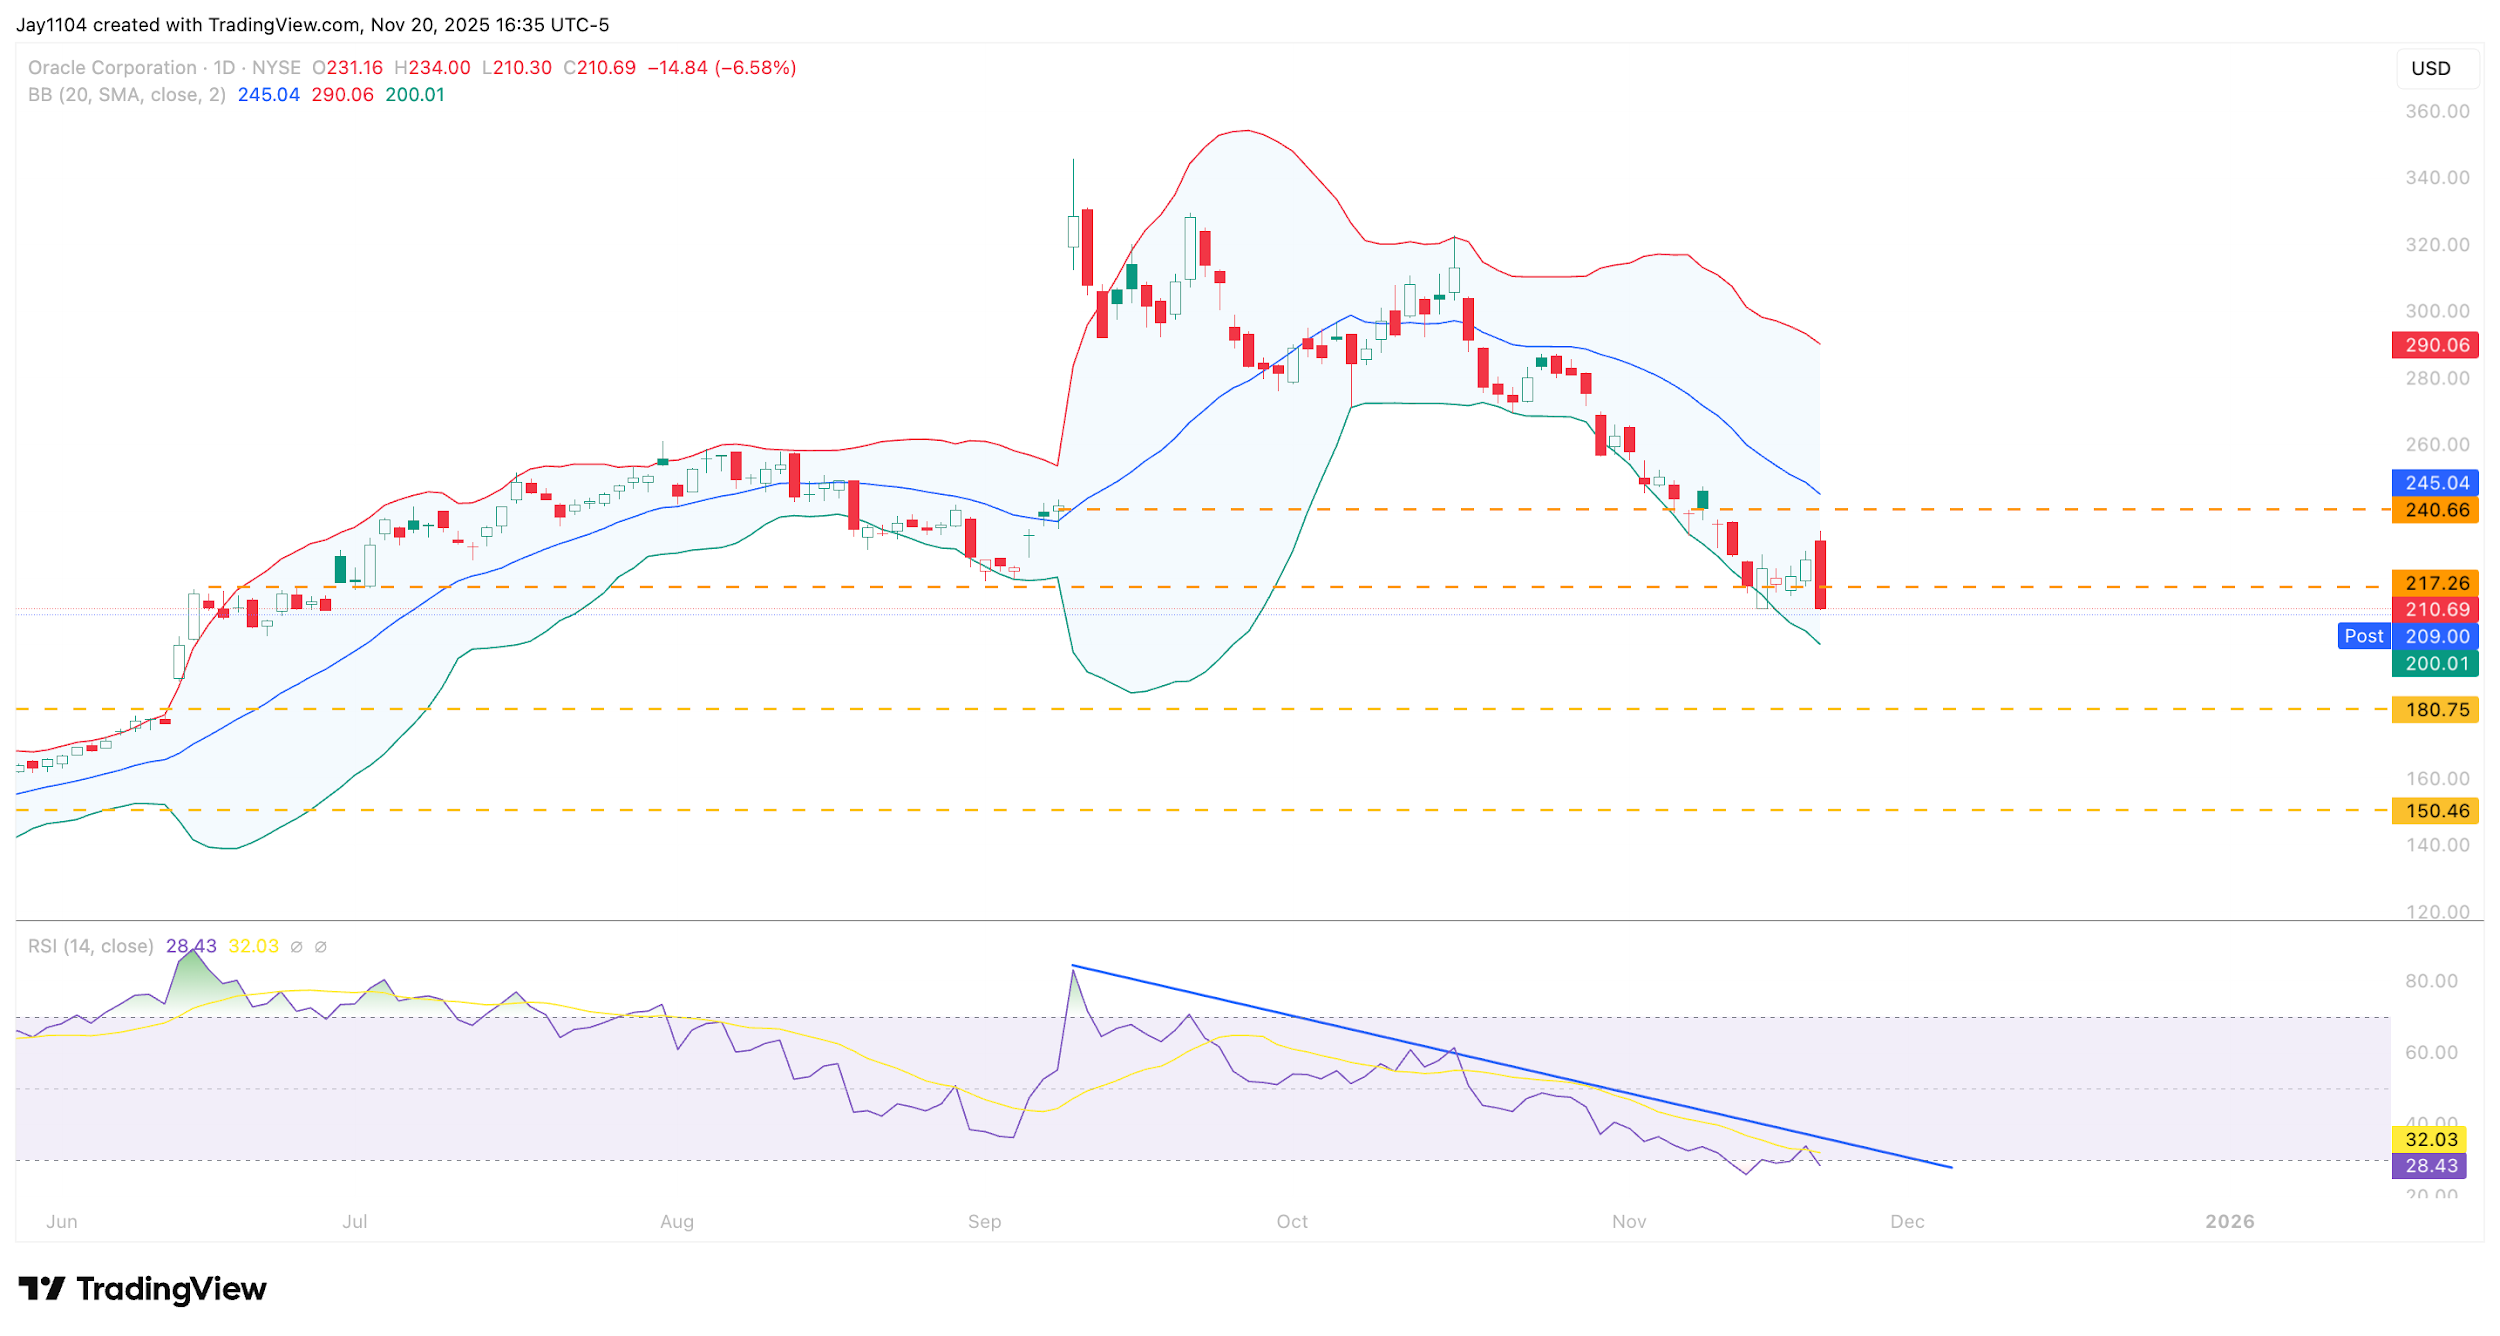
Oracle appeared to work off its oversold conditions over the past couple of trading sessions, with the shares today rising to their 10-day exponential moving average before reversing sharply, creating a bearish engulfing pattern based on the current setup. The lower Bollinger Band sits around $199, suggesting the shares still have room to fall. That also aligns with a support area that dates to early–mid June.
(Source: Morningstar)
Past performance is not a reliable indicator of future results.
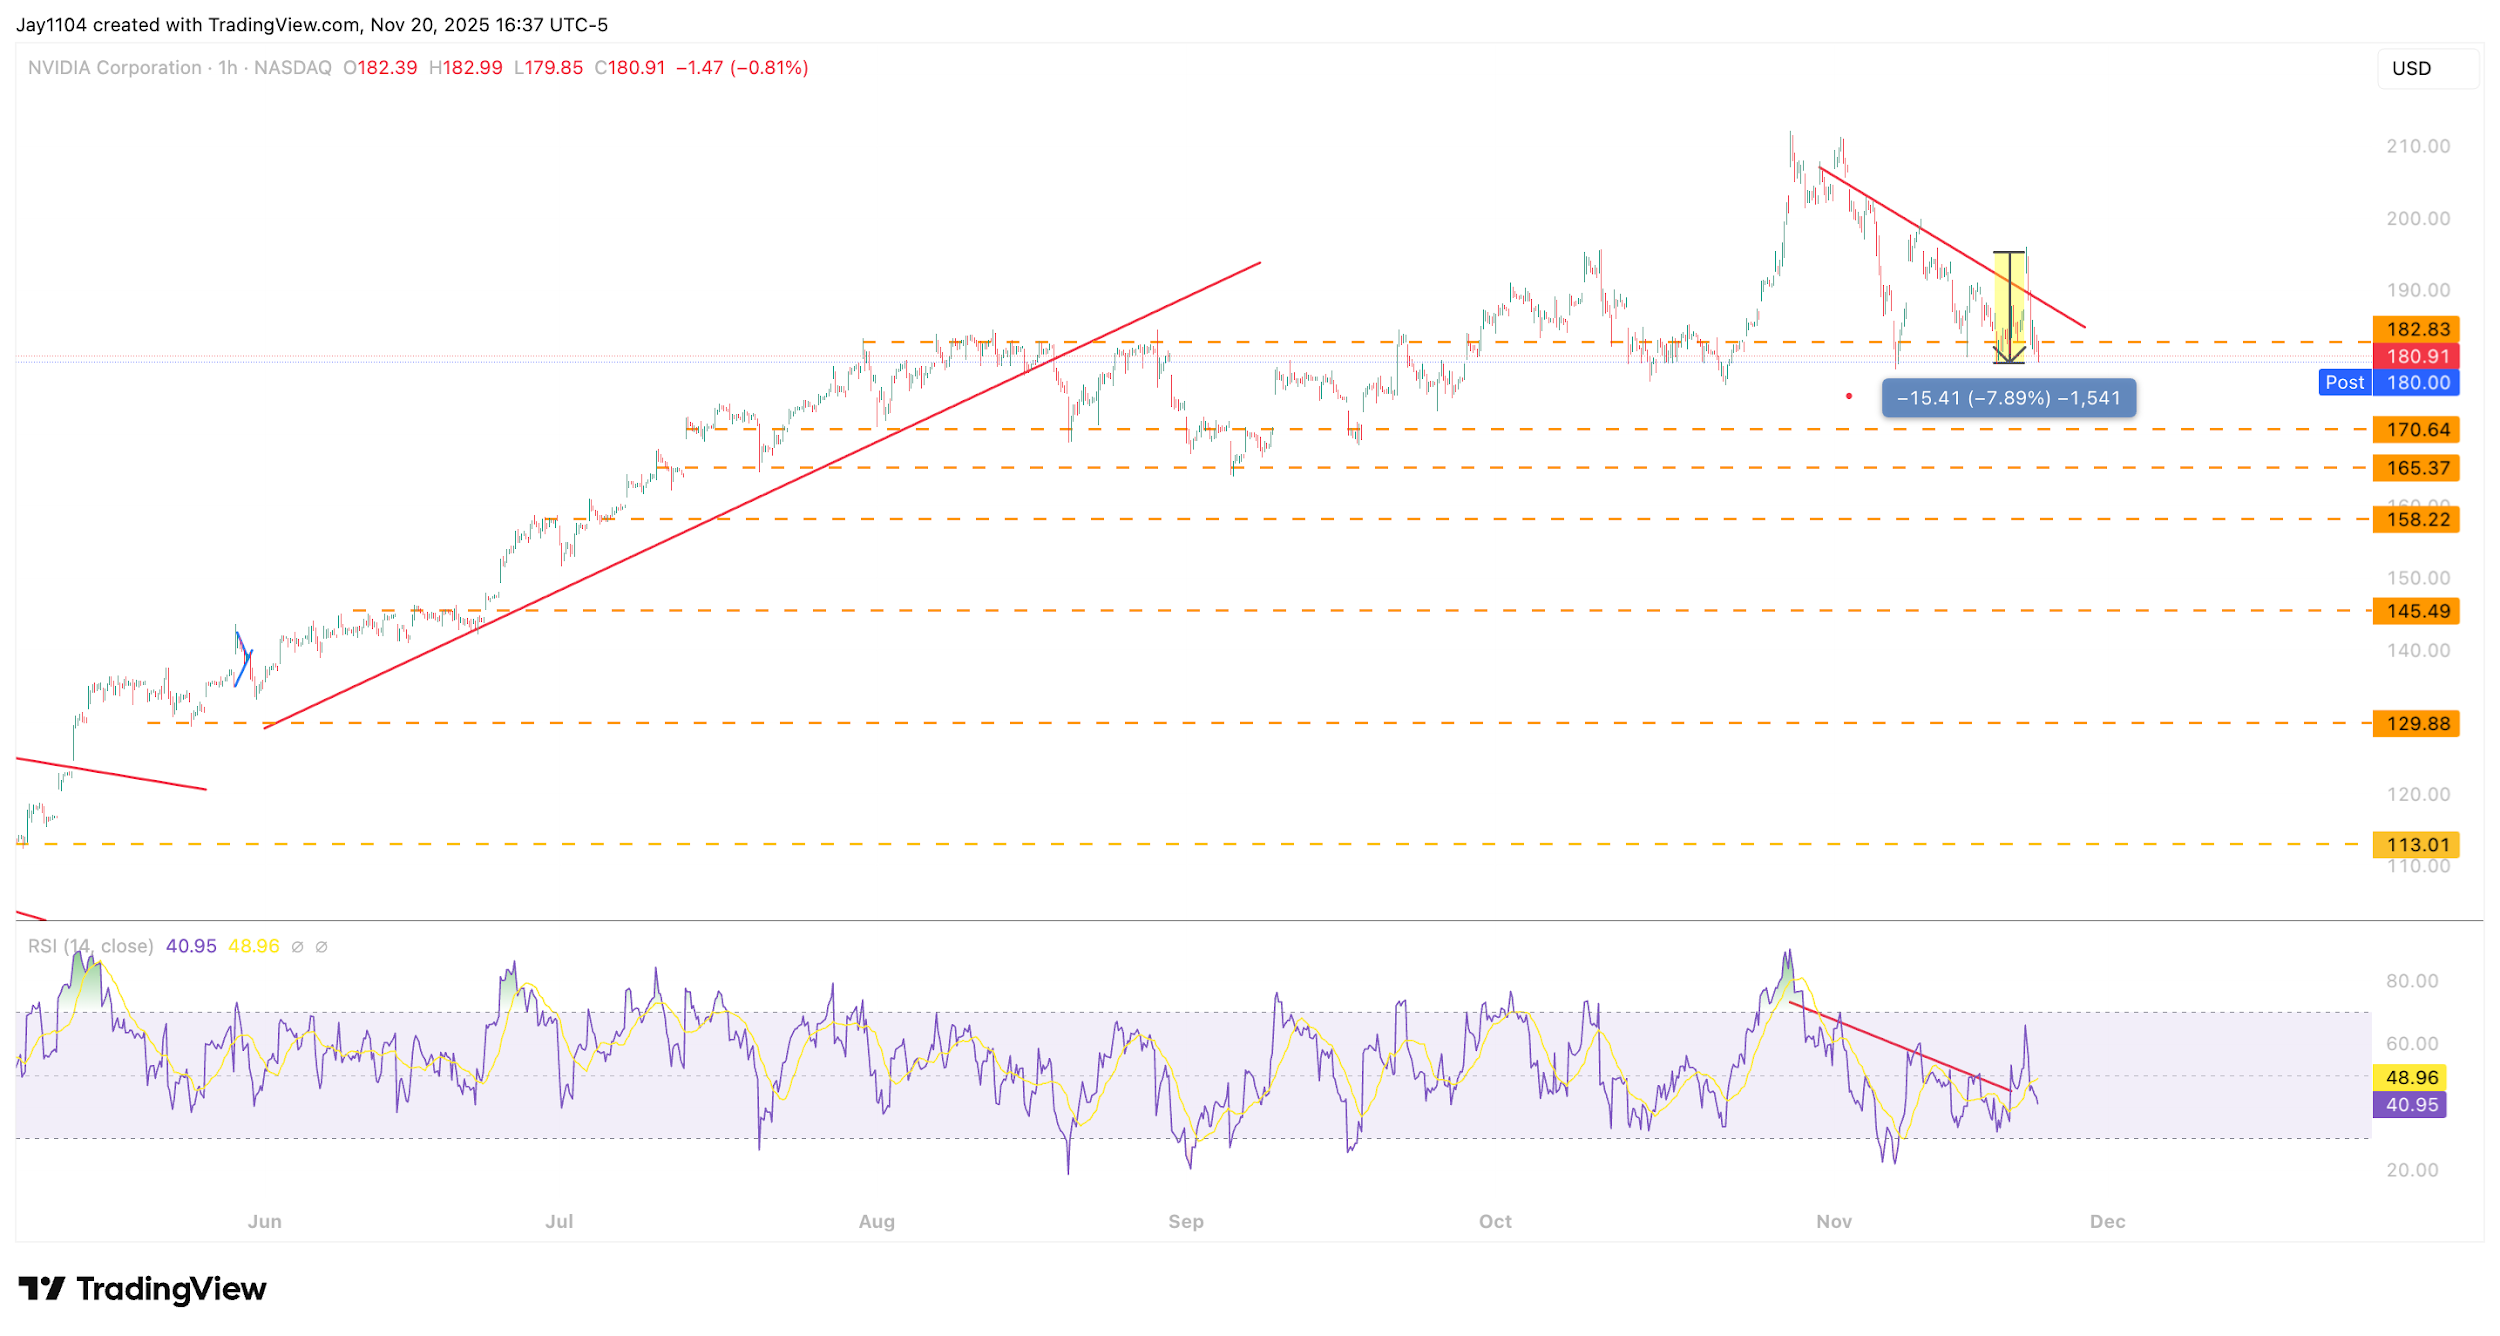
Finally, it became clear that NVIDIA was unable to stabilise global markets, with shares dropping 3% on the day and reversing a nearly 5% gain, resulting in an intraday reversal of about 7.5% [chart7]. More importantly, NVIDIA now sits on a critical support level around $180, and if this level breaks, there is potential for the shares to decline towards $170, which would, of course, have negative implications not just for NVIDIA but for the wider market. The RSI remains firmly trending lower and is currently around 43, suggesting the shares could fall further, as momentum to the downside may only just be gathering.
(Source: Morningstar)
Past performance is not a reliable indicator of future results.
This report contains independent commentary to be used for informational and educational purposes only. Michael Kramer is a member and investment adviser representative with Mott Capital Management. Mr. Kramer is not affiliated with this company and does not serve on the board of any related company that issued this stock. All opinions and analyses presented by Michael Kramer in this analysis or market report are solely Michael Kramer’s views. Readers should not treat any opinion, viewpoint, or prediction expressed by Michael Kramer as a specific solicitation or recommendation to buy or sell a particular security or follow a particular strategy. Michael Kramer’s analyses are based upon information and independent research that he considers reliable, but neither Michael Kramer nor Mott Capital Management guarantees its completeness or accuracy, and it should not be relied upon as such. Michael Kramer is not under any obligation to update or correct any information presented in his analyses. Mr. Kramer’s statements, guidance, and opinions are subject to change without notice. Past performance is not indicative of future results. Neither Michael Kramer nor Mott Capital Management guarantees any specific outcome or profit. You should be aware of the real risk of loss in following any strategy or investment commentary presented in this analysis. Strategies or investments discussed may fluctuate in price or value. Investments or strategies mentioned in this analysis may not be suitable for you. This material does not consider your particular investment objectives, financial situation, or needs and is not intended as a recommendation appropriate for you. You must make an independent decision regarding investments or strategies in this analysis. Upon request, the advisor will provide a list of all recommendations made during the past twelve months. Before acting on information in this analysis, you should consider whether it is suitable for your circumstances and strongly consider seeking advice from your own financial or investment adviser to determine the suitability of any investment.