Markets Drift as Gold Plunges and Oil Hints at Reversal
The S&P 500 spent most of Tuesday, 21 October, trading sideways. However, gold and other precious metals made up for the lack of excitement in equities, with gold prices plunging by more than 5%.
The S&P 500 spent most of Tuesday, 21 October, trading sideways. However, gold and other precious metals made up for the lack of excitement in equities, with gold prices plunging by more than 5%. In addition, it appears there may be a reversal pattern forming in both oil and US 10-year interest rates.

S&P 500
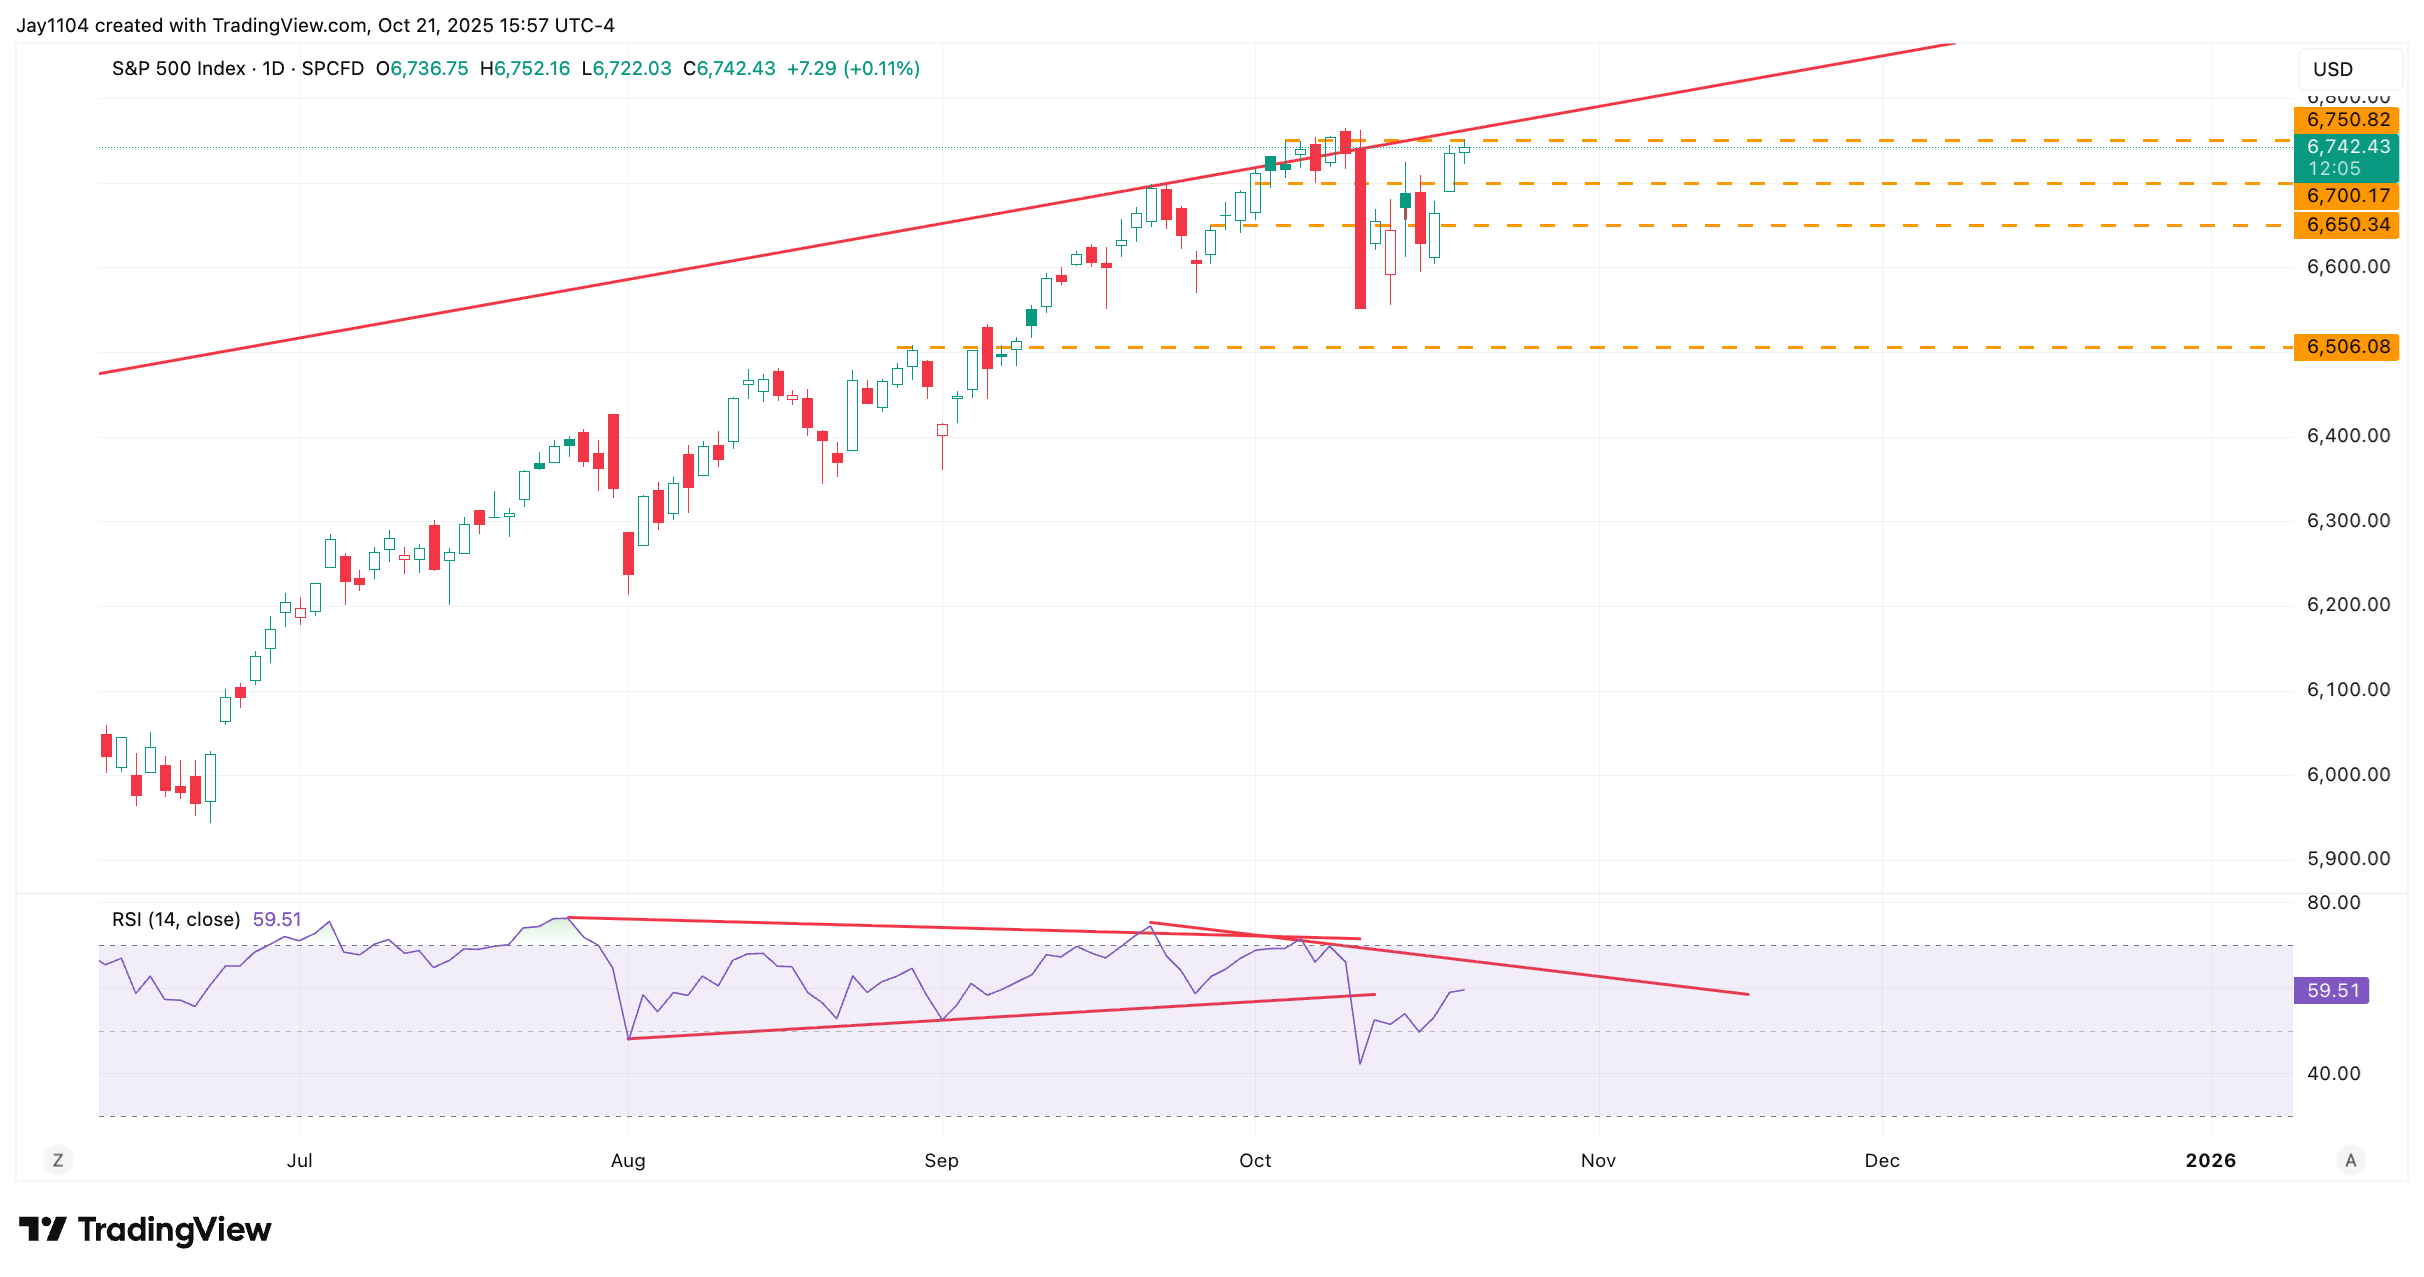
The S&P 500 experienced a mostly quiet session today, increasing by about 14 basis points. It’s clear that, since volatility has been reset from Friday’s high levels, the market hasn’t moved much. This supports the idea that Monday’s action on 20 October was probably driven by mechanical trading related to the drop in implied volatility.
At this stage, it isn’t clear whether the equity market is setting up for a major turn or simply consolidating before its next move higher. However, a clear divergence is forming between the RSI and price action, with the RSI trending lower, while the index is moving higher or sideways, suggesting that something may be developing beneath the surface.
(Source: TradingView)
(Past performance is not a reliable indicator of future results)
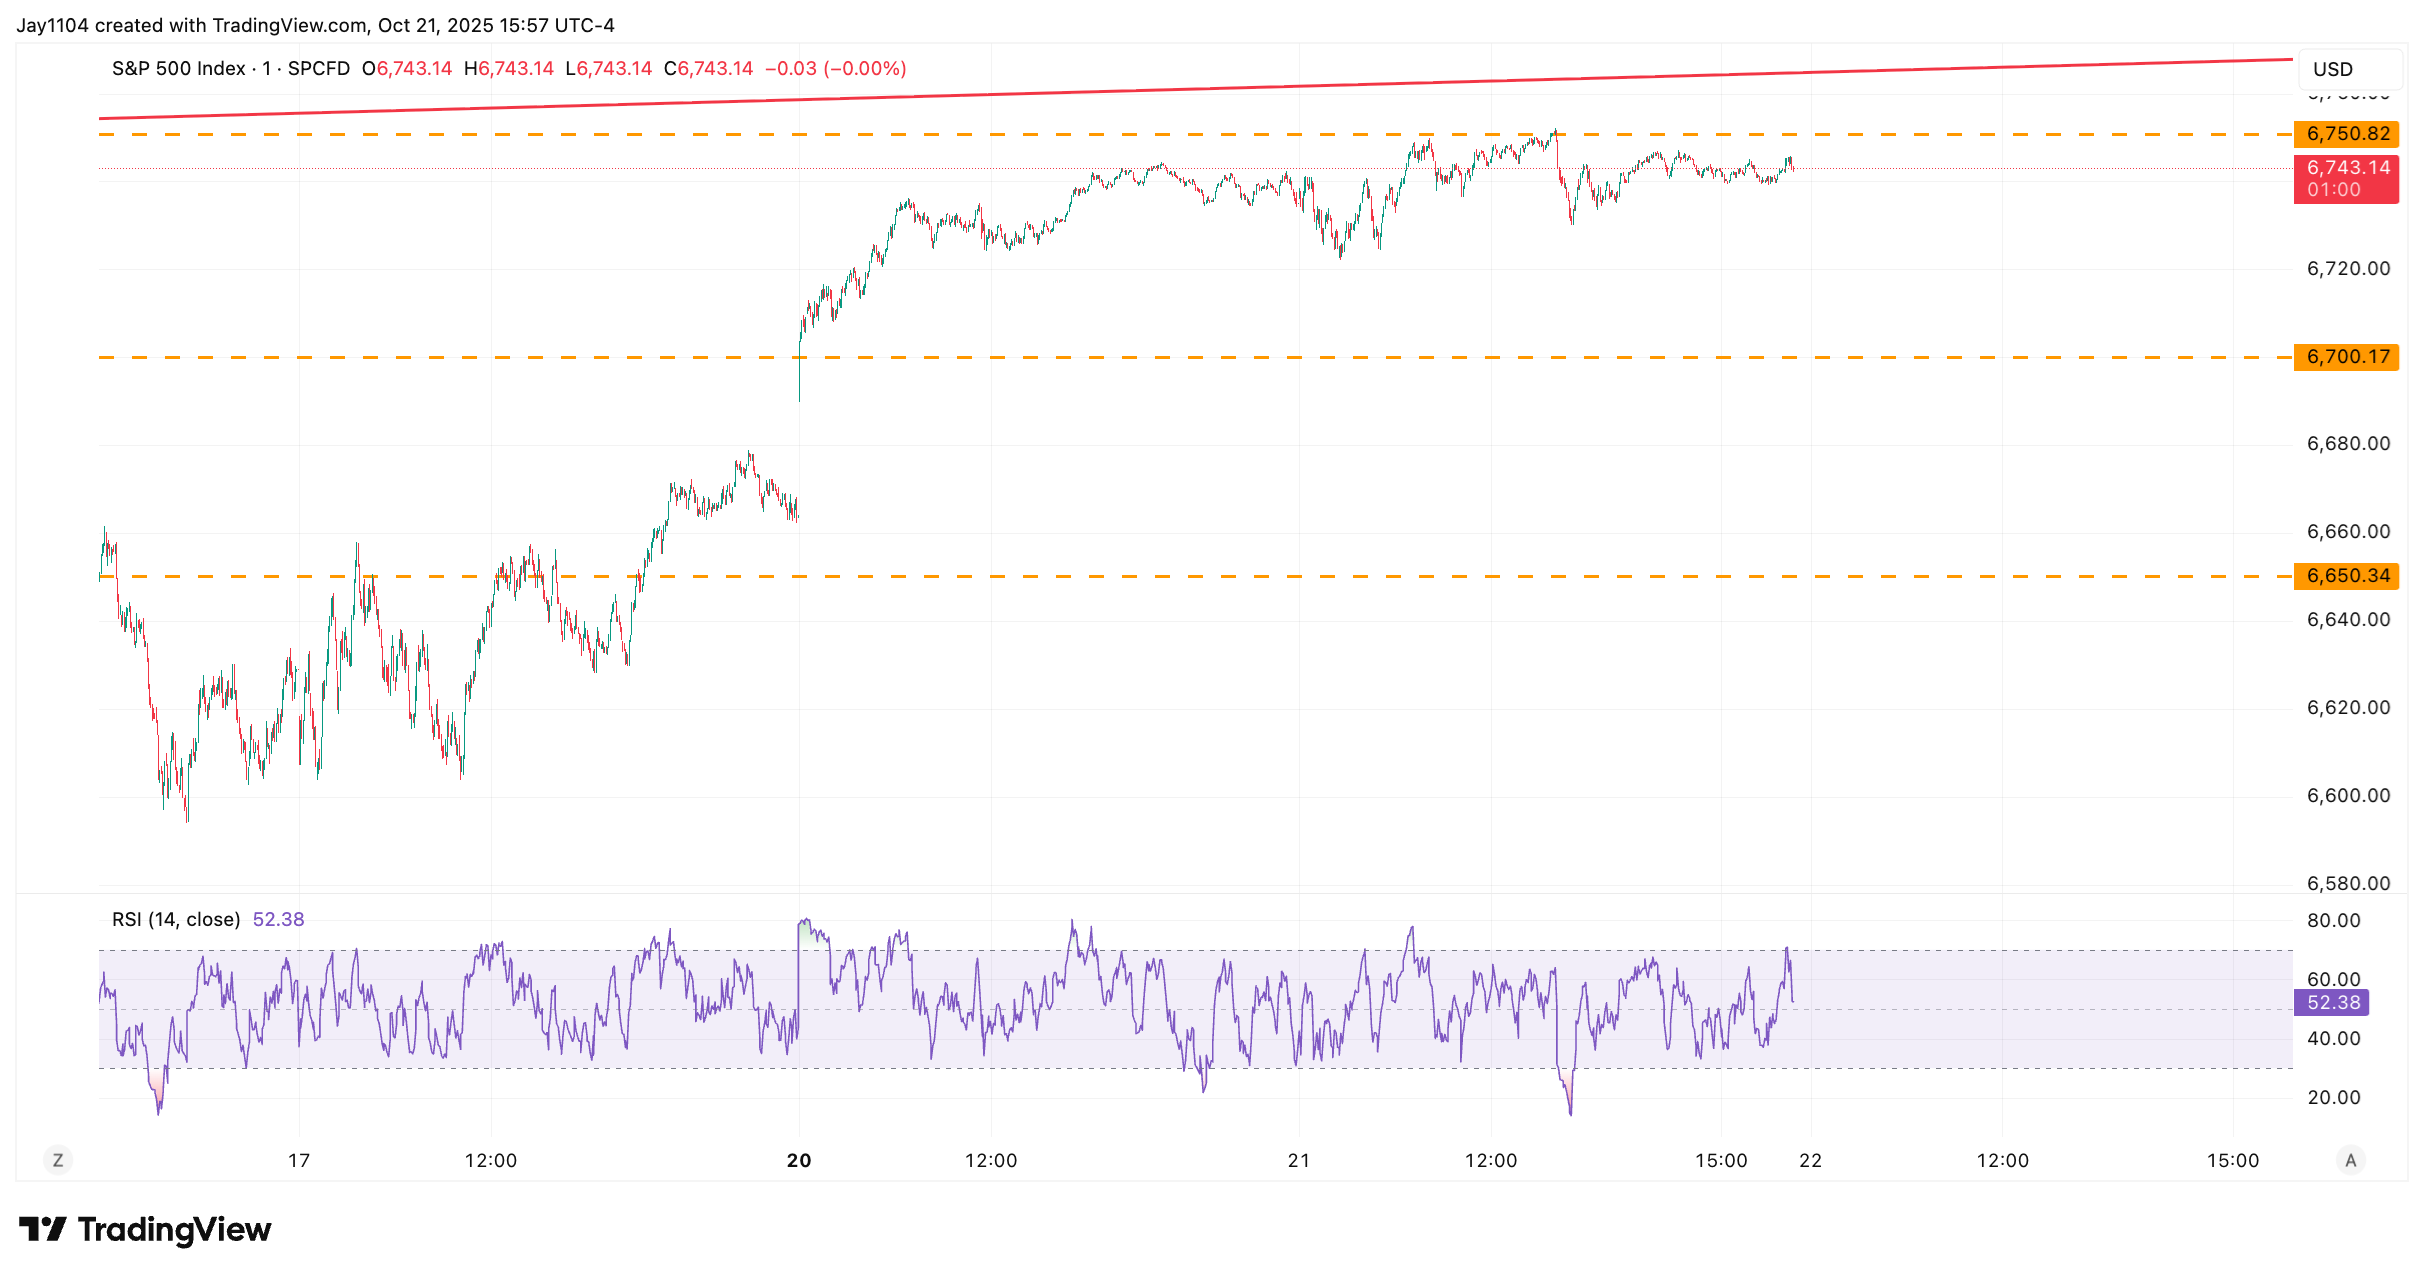
For the second day in a row, the S&P 500 has remained above its 20-day simple moving average, but it’s worth bearing in mind that Monday’s move appears somewhat unstable. Typically, when a gap higher follows a weak close, as seen on Friday, it often results in the index retracing its gains and refilling the gap, which currently sits around 6,660 on the S&P.
(Source: TradingView)
(Past performance is not a reliable indicator of future results)
Gold
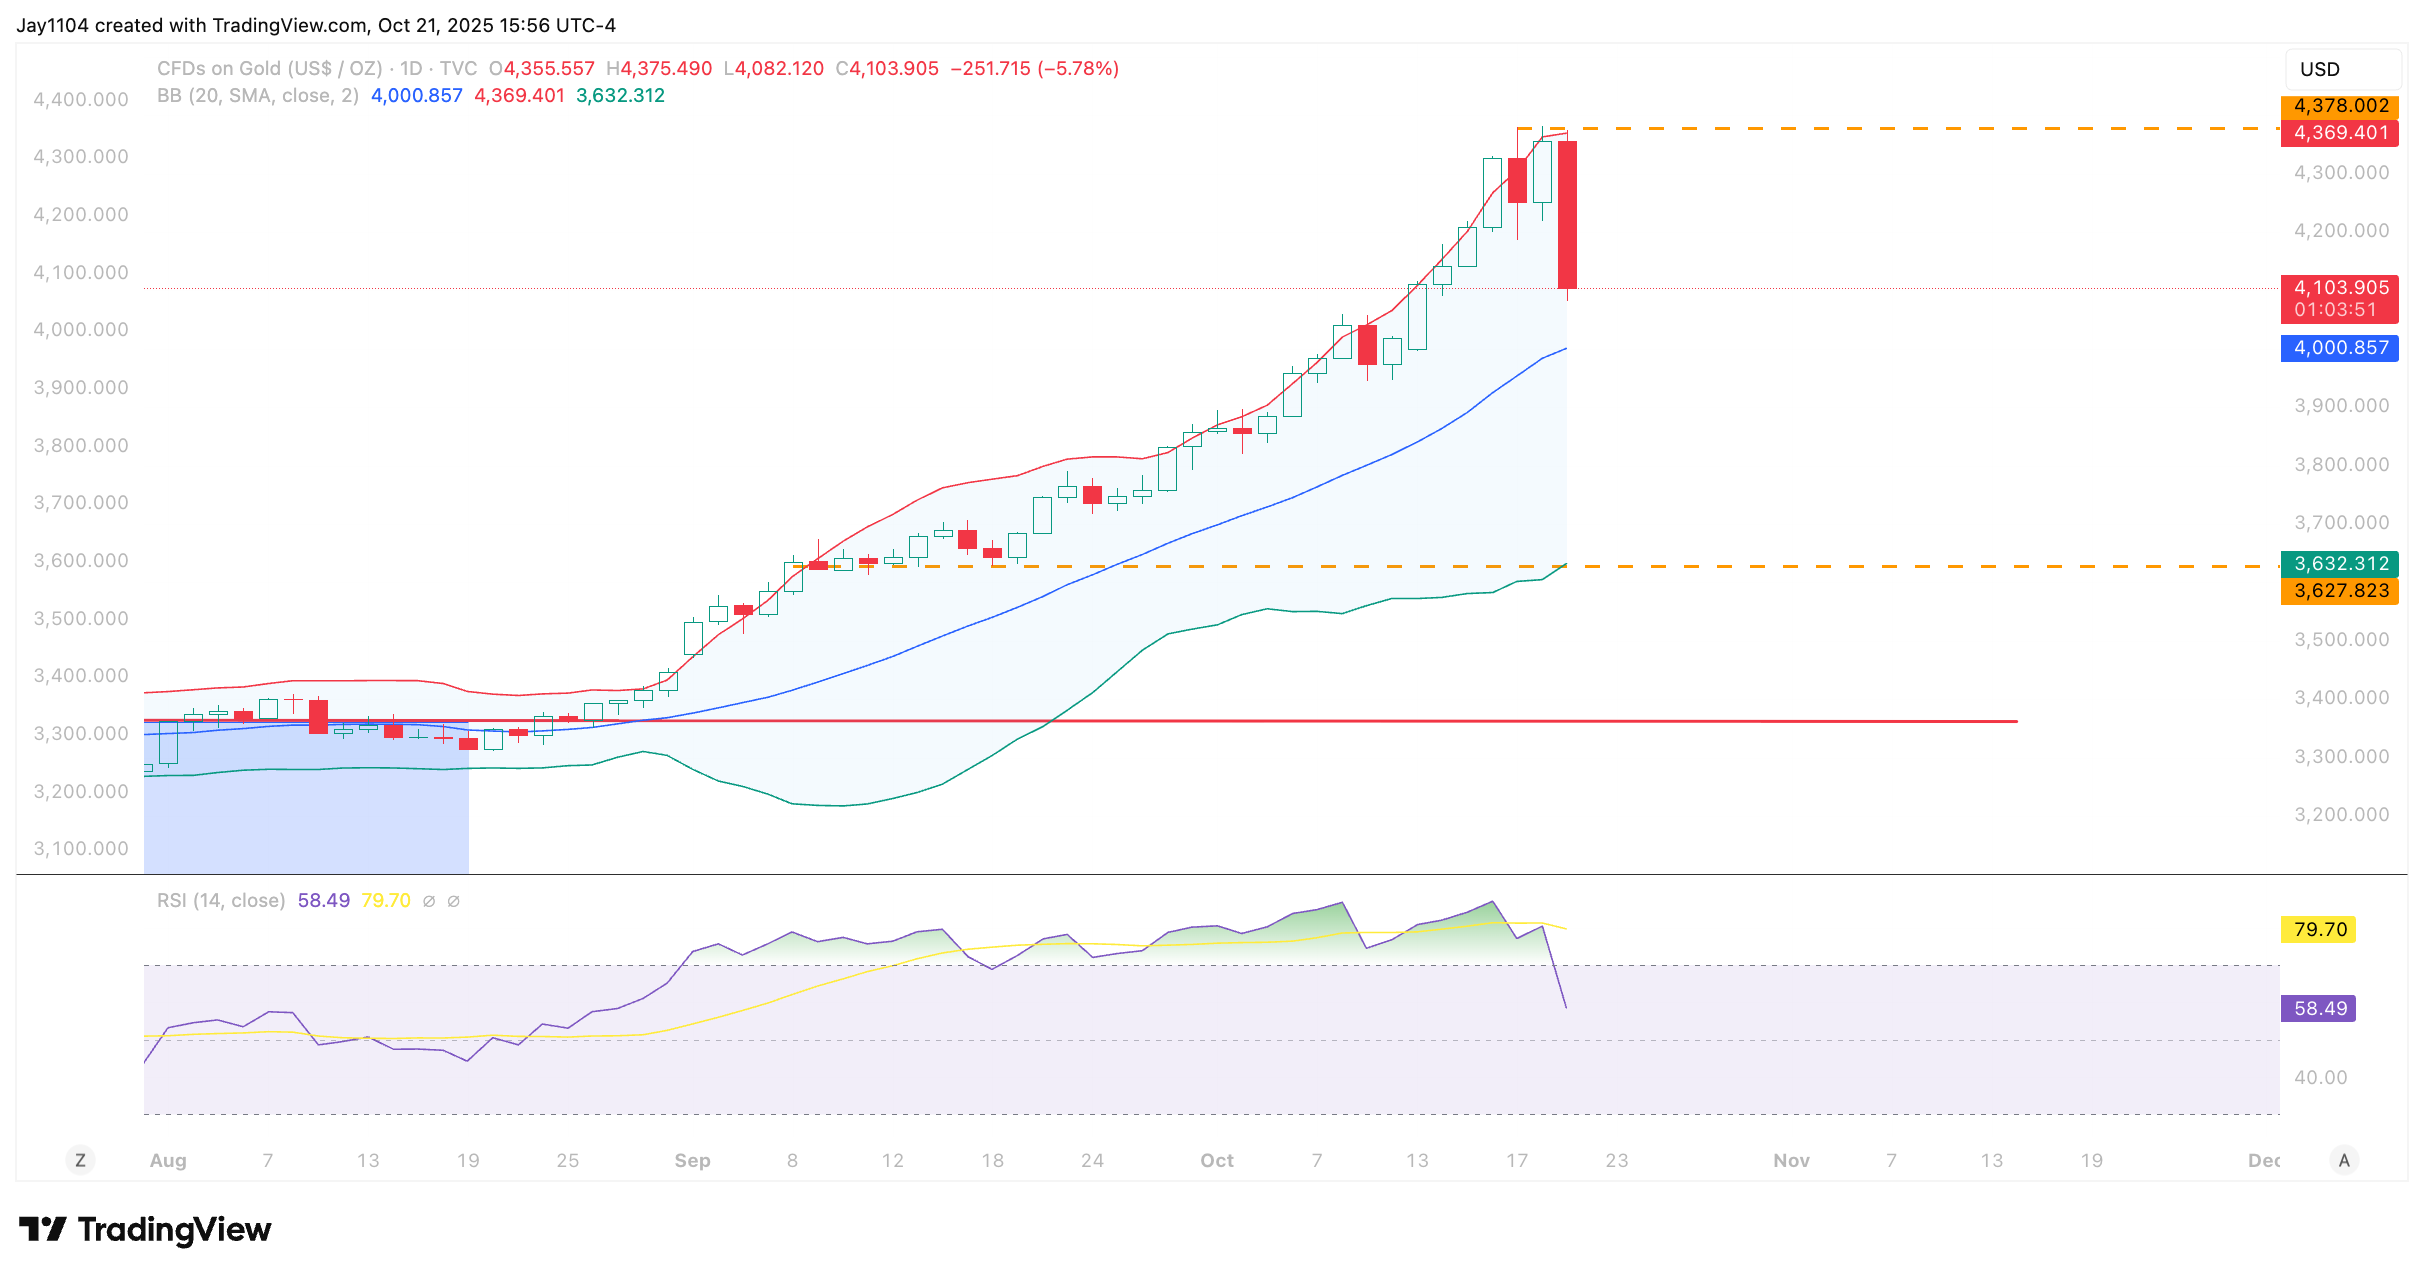
Gold, along with many other precious metals, fell sharply on Tuesday. The price of gold declined by 5.5% on the day, and for the first time in some time, the relative strength index dropped below 70, indicating that gold is no longer in overbought territory.
At this stage, the next major level of support appears to be around 4,000, which previously acted as a resistance area on the way up and coincides with the 20-day moving average. A break below 4,000 or beneath the 20-day moving average could indicate potential for further decline towards the 3,600 region, where it would meet the lower Bollinger Band and an earlier consolidation zone from early September.
(Source: TradingView)
(Past performance is not a reliable indicator of future results)
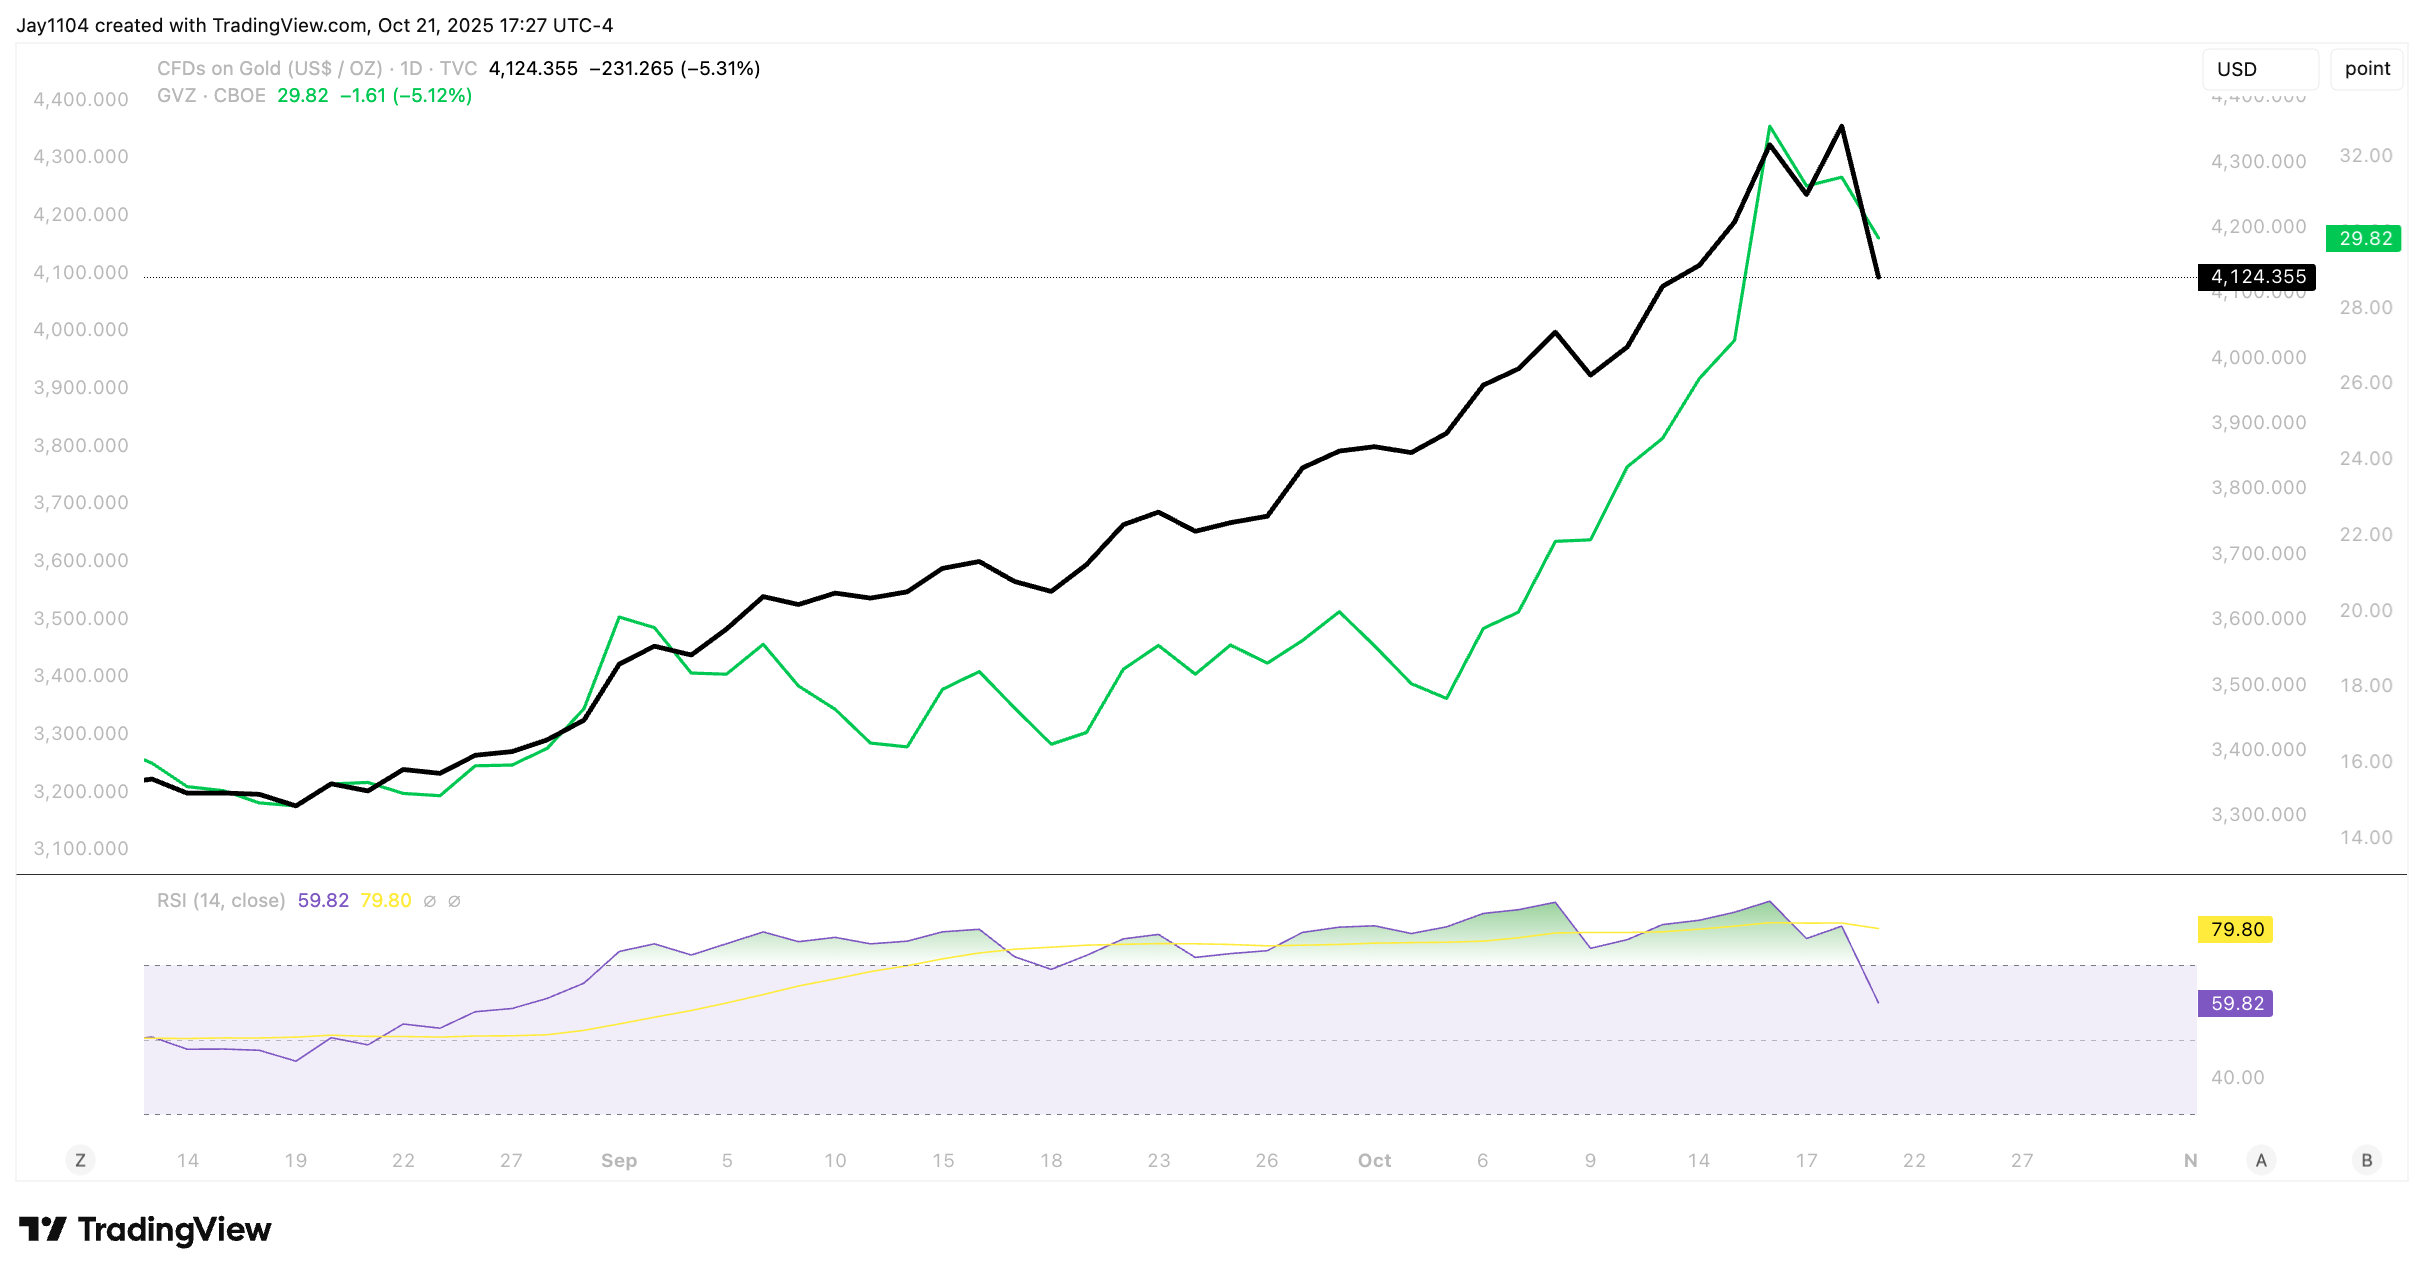
The move in gold has largely appeared speculative, with the price rising alongside implied volatility. Typically, these are characteristics seen in options markets during a gamma squeeze, when heavy options activity forces market makers to buy more of the underlying asset. While it is difficult to confirm whether this is indeed the case, if it proves to be so, the rally in gold is likely over, and a return to lower prices may be on the cards.
What adds support to this thesis is that implied volatility fell today, along with the price of gold.
(Source: TradingView)
(Past performance is not a reliable indicator of future results)
Bitcoin
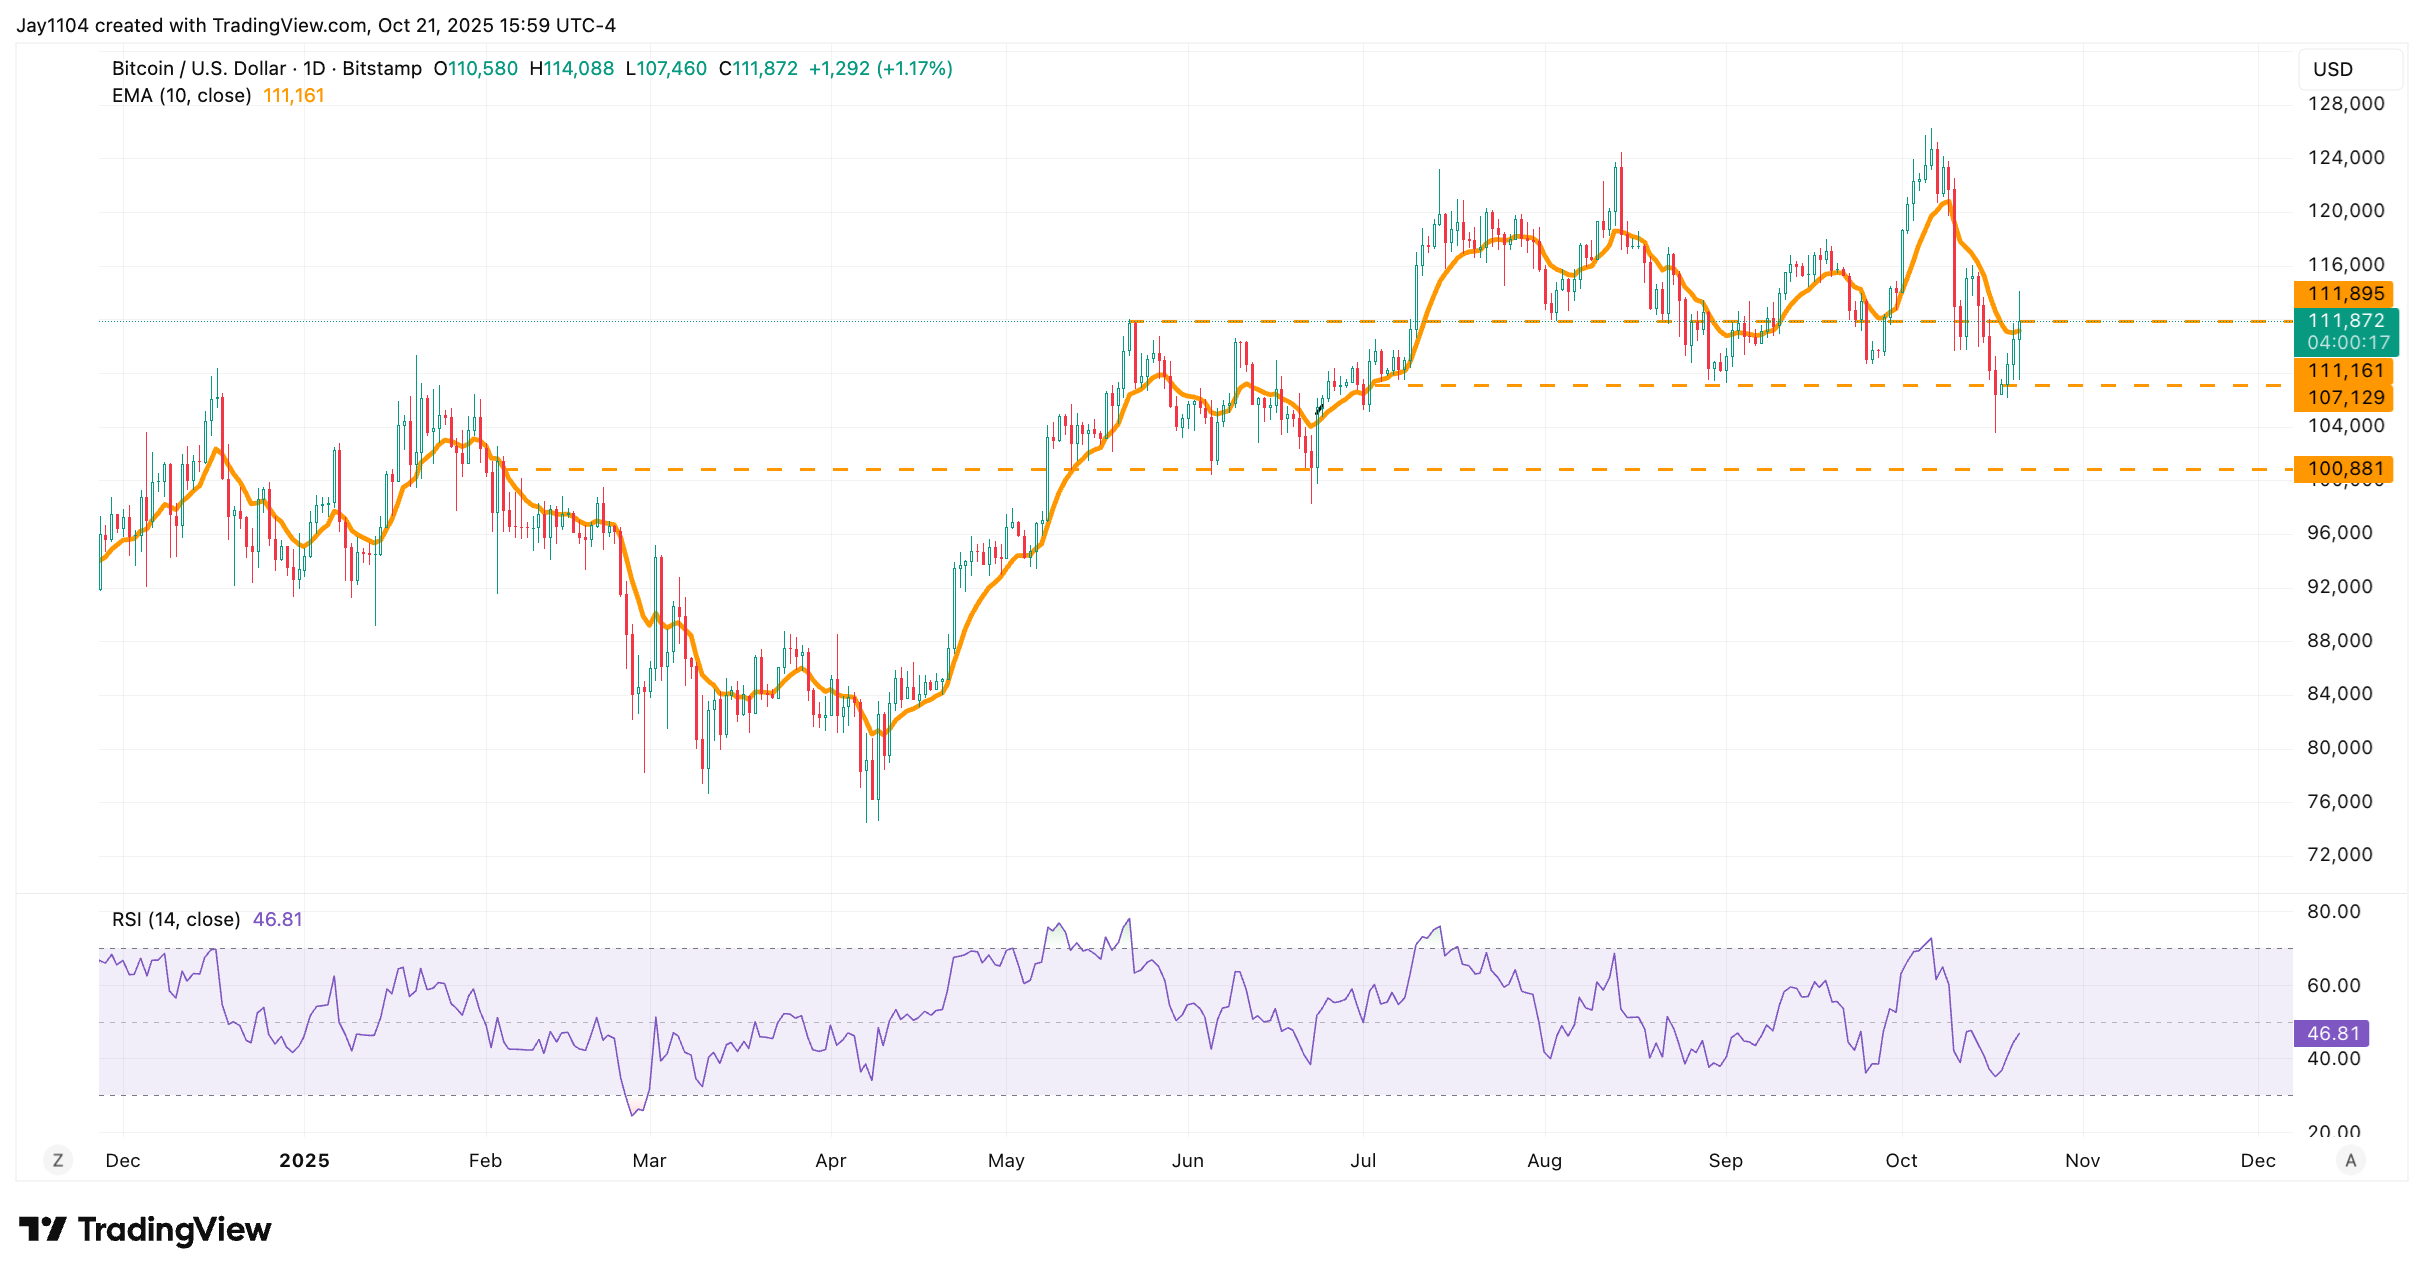
With gold prices falling sharply, Bitcoin saw a modest recovery, rising by around 1.5% to $112,000, moving just barely above the 10-day exponential moving average as of 4 PM ET on 21 October. Bitcoin attempted to break above this moving average but failed on 20 October.
(Source: TradingView)
(Past performance is not a reliable indicator of future results)
More importantly, the area between $108,000 and $112,000 has been a notable resistance zone for some time. It previously acted as a support level, but since May, it has repeatedly served as resistance. This range, therefore, remains a key pivot point for Bitcoin.
If Bitcoin can sustain a move above this resistance band, it might pave the way for a return to the previous highs and possibly even a push towards $128,000. However, if it fails to break through, the broader trend is likely to remain lower, with the risk of a move below $100,000.
WTI Oil
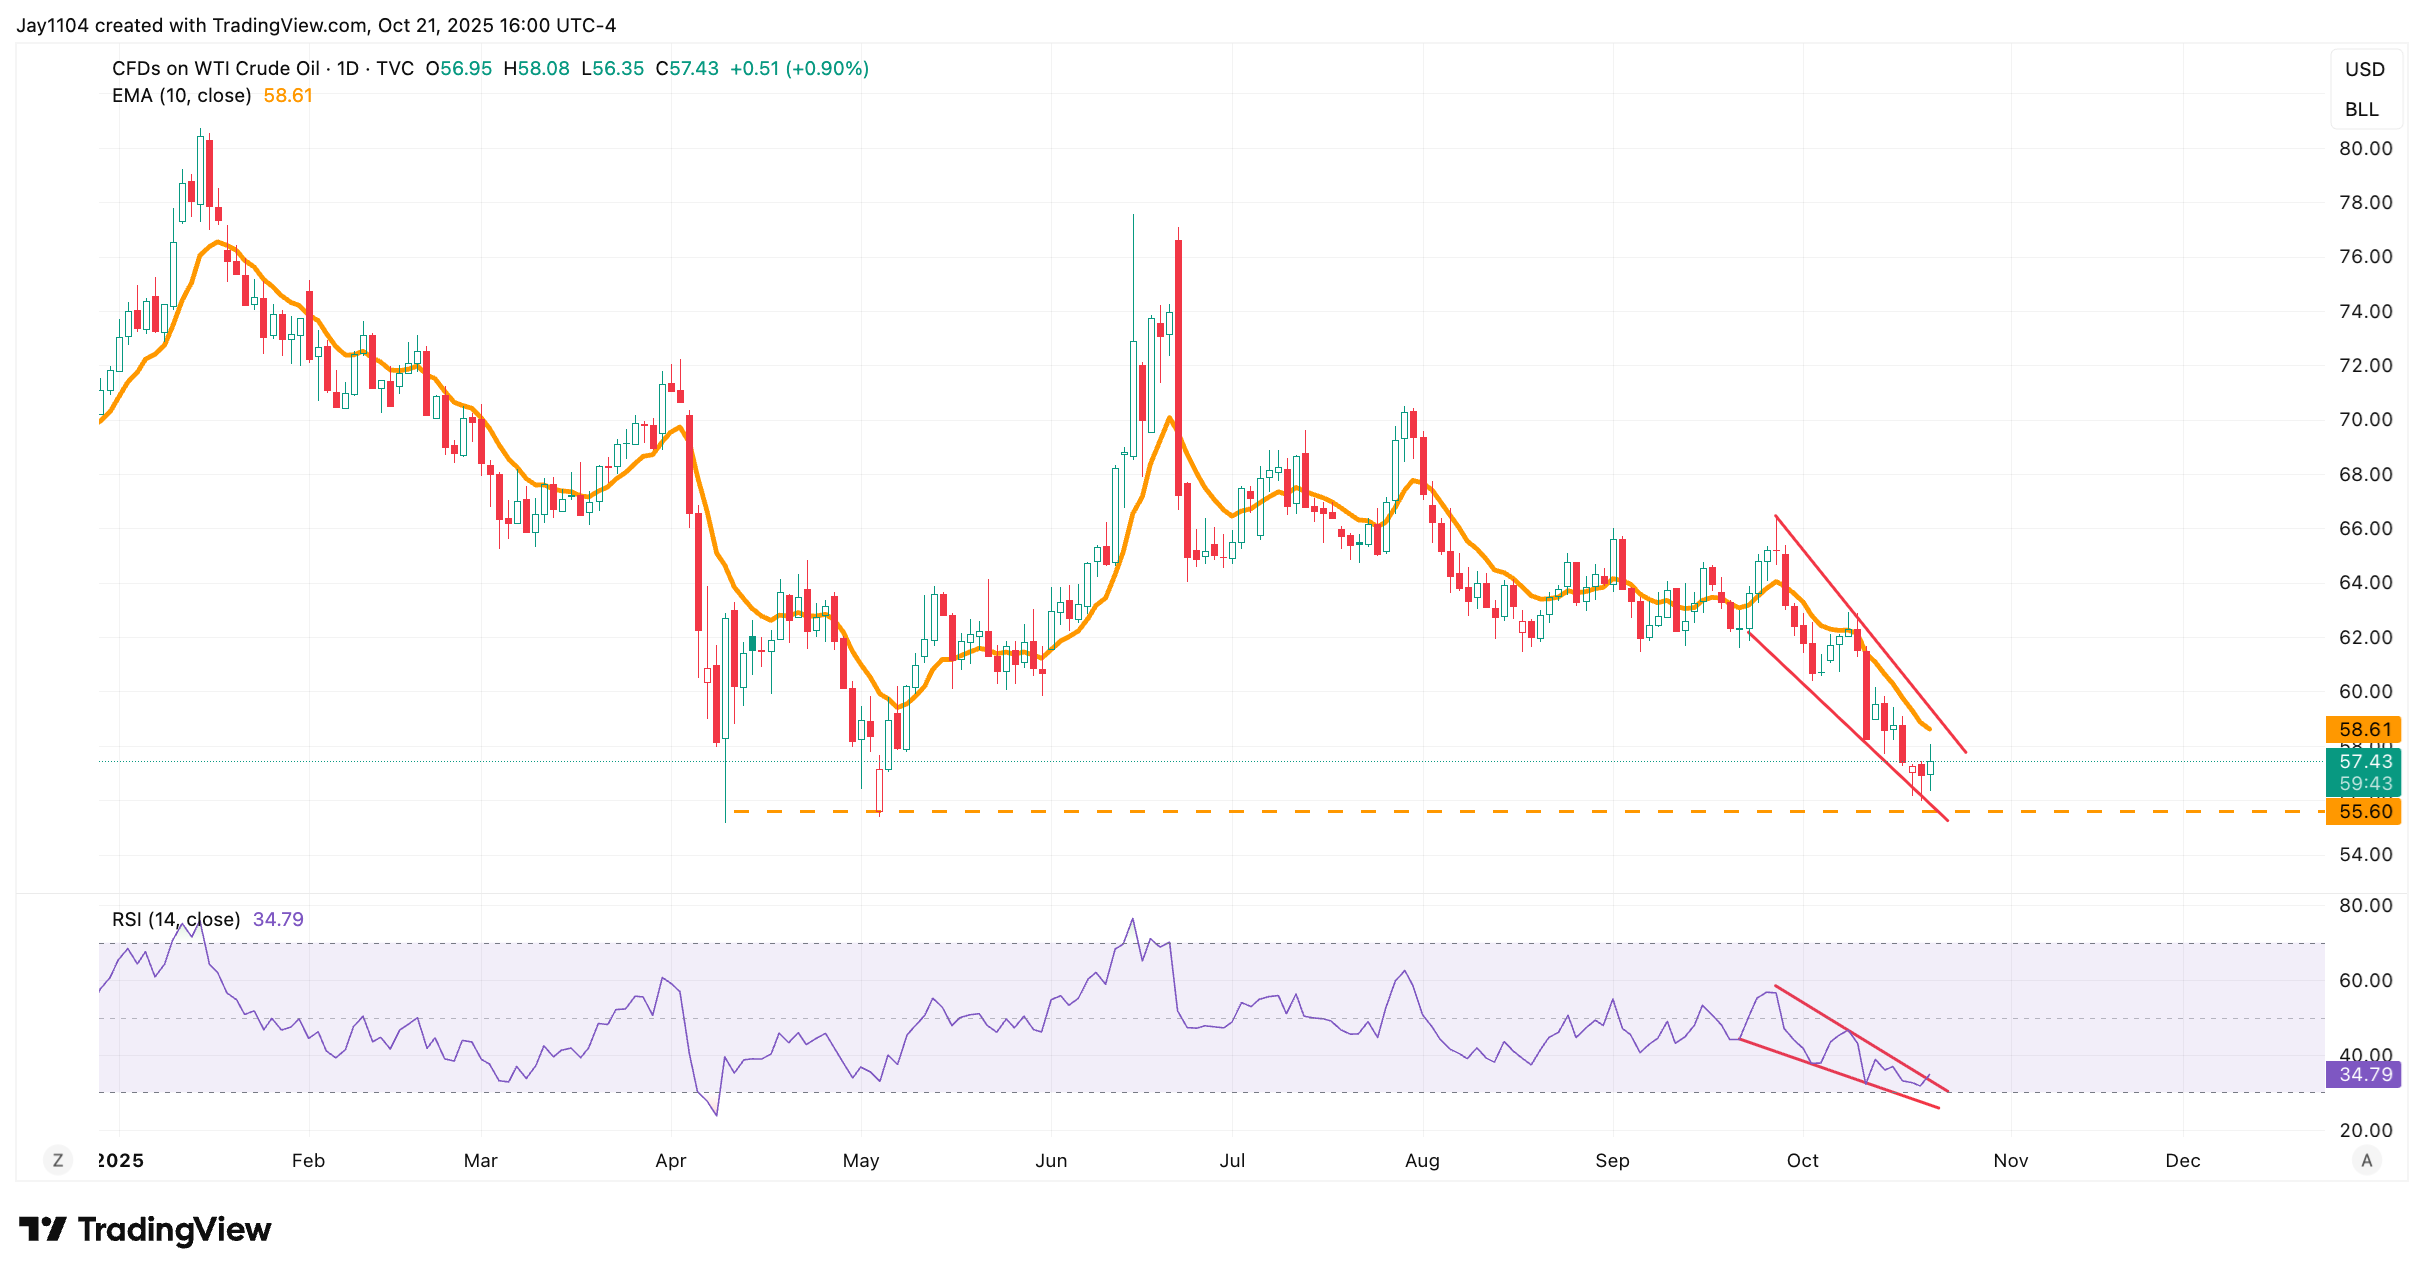
Oil prices edged higher today after reports that the U.S. Strategic Petroleum Reserve plans to add barrels of oil. This lifted prices by about 90 basis points. However, oil has yet to break below key support around $54, and there are emerging signs that momentum could be shifting, as suggested by what may represent a developing falling wedge pattern on the RSI.
(Source: TradingView)
(Past performance is not a reliable indicator of future results)
It’s also possible that oil has formed a bullish divergence, with a lower low in price but a higher low on the RSI — a commonly interpreted reversal signal. Alongside this, the broader price action itself seems to be tracing out a falling wedge pattern, reinforcing the potential for a change in trend.
As long as oil holds above its recent lows around $55, a move higher remains plausible, with a possible retest of $62 in the not-too-distant future. For that scenario to play out, though, oil would likely need to break decisively above $58.
US 10-Yr Yields
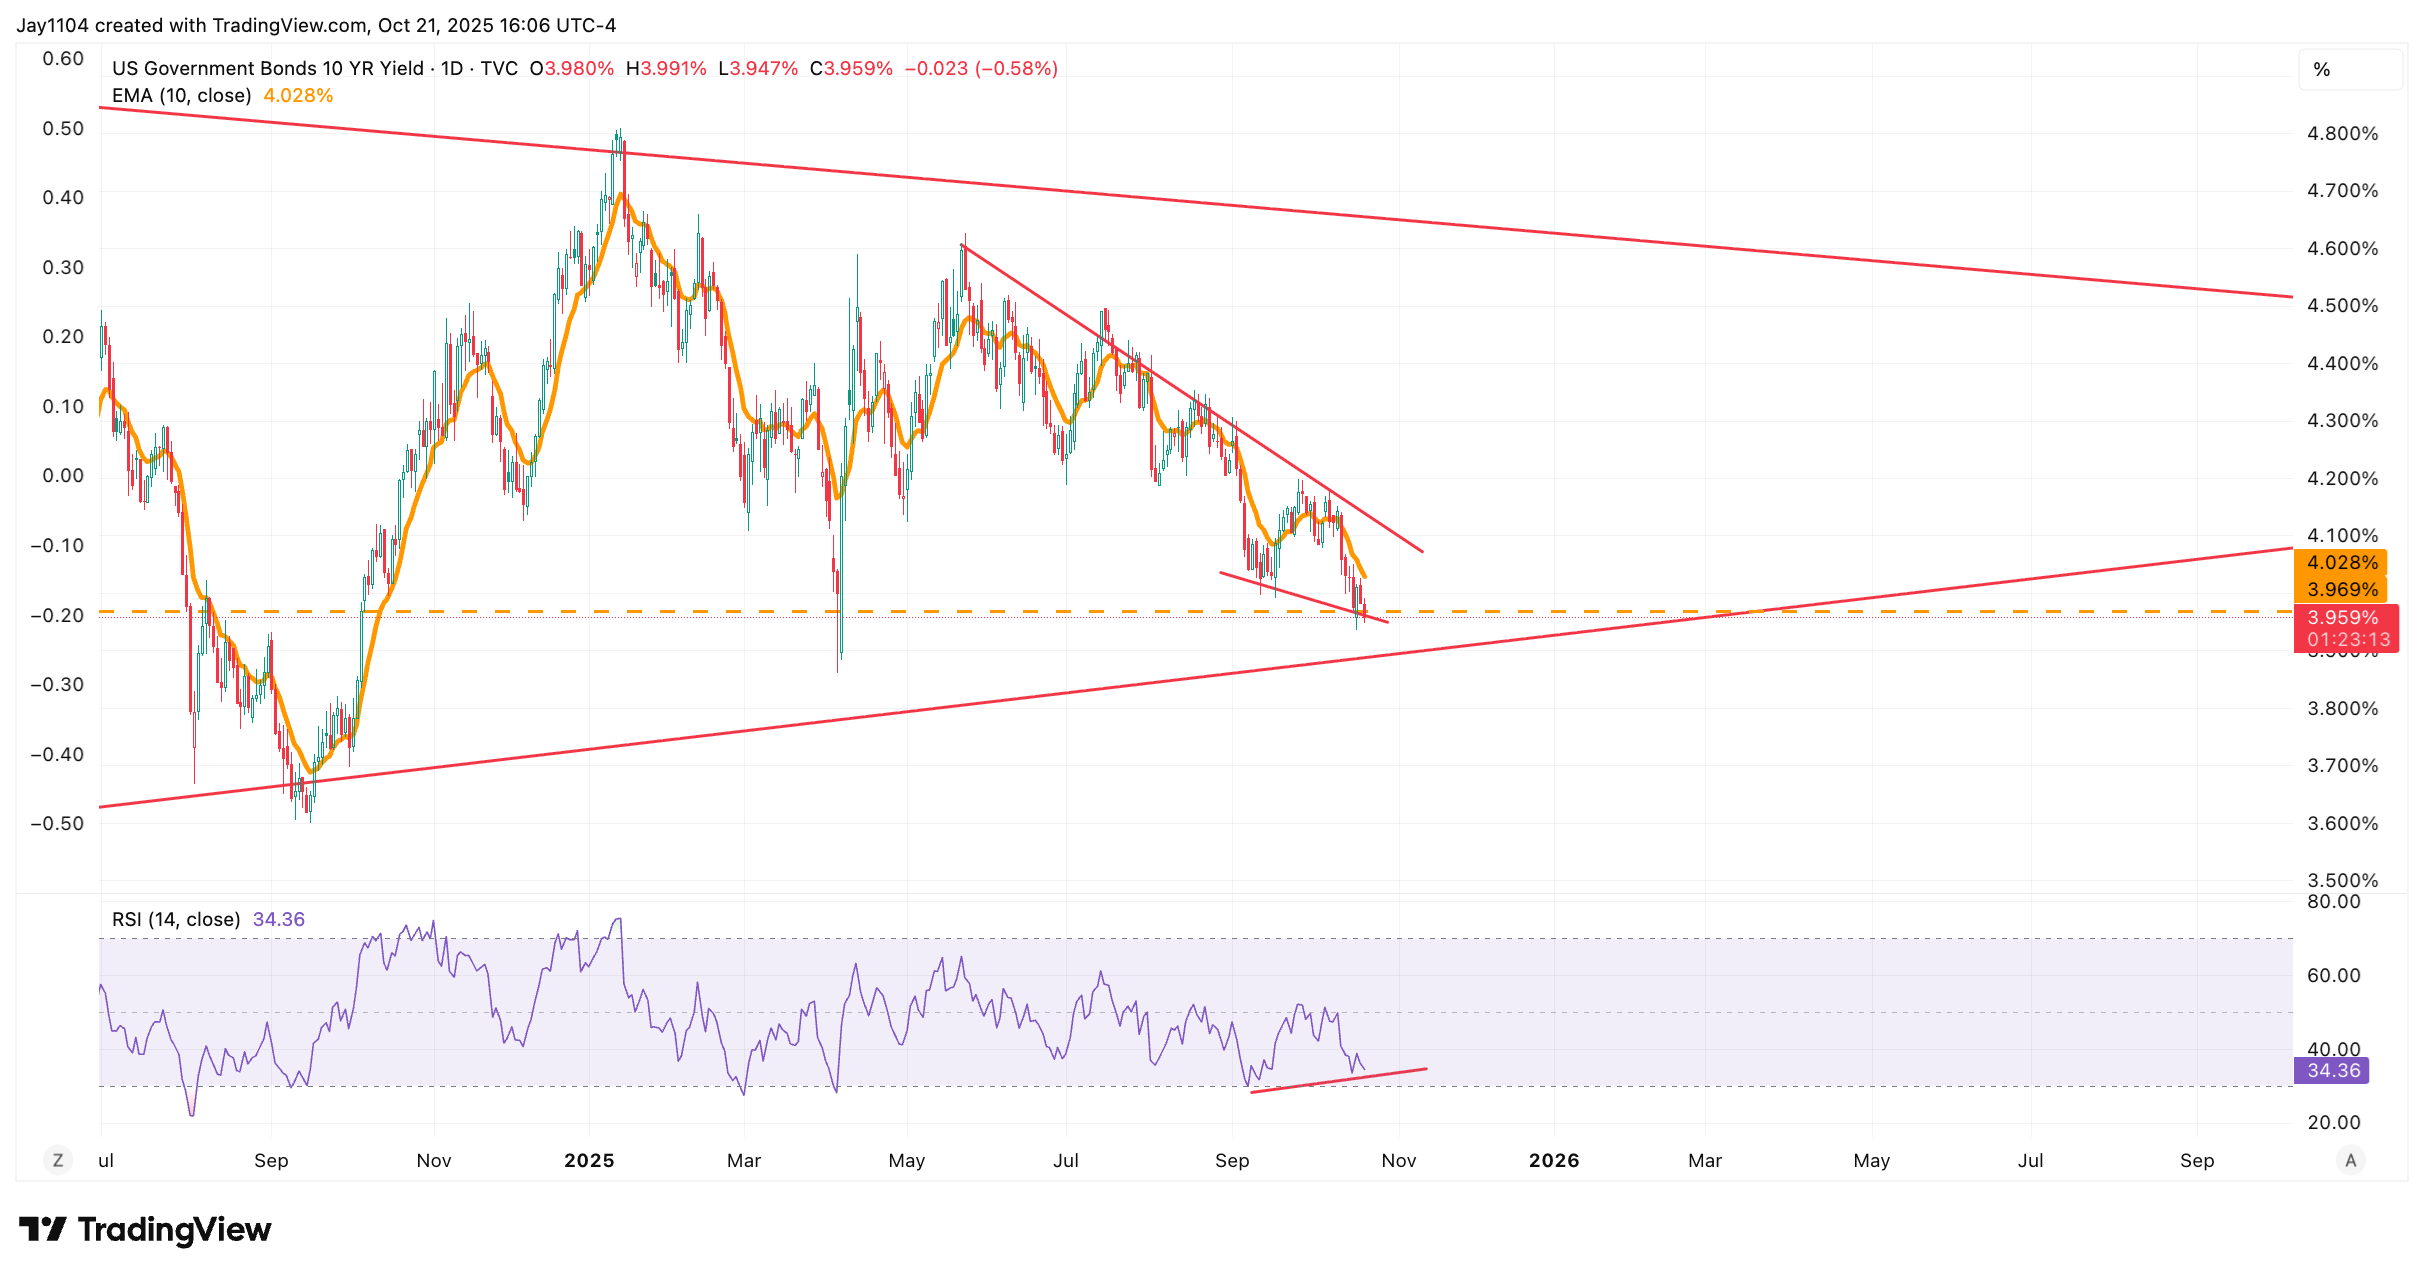
U.S. 10-year yields have been trading lower alongside oil prices, and it’s possible that if oil is forming a low, Treasury yields could be doing the same. The area around 3.95% is particularly important for the 10-year. Similar to oil, we’re seeing a lower low in yields but a higher low on the RSI — a potential signal that rates may be preparing to reverse and move higher.
That said, a move above 4.20% would be needed to provide more convincing evidence of a turn in trend. Still, this could prove to be an interesting development, particularly if oil prices continue to climb.
(Source: TradingView)
(Past performance is not a reliable indicator of future results)