Implied Volatility Collapse Drives Equity Rally After Fed’s 25 bp Cut
The S&P 500 finished on 10 December higher by approximately 70 basis points.
The move higher in the equity market followed the highly anticipated decision by the Fed to cut overnight rates by 25 basis points. The rally in the index appears to have been driven by hedges unwinding and a sharp fall in volatility.

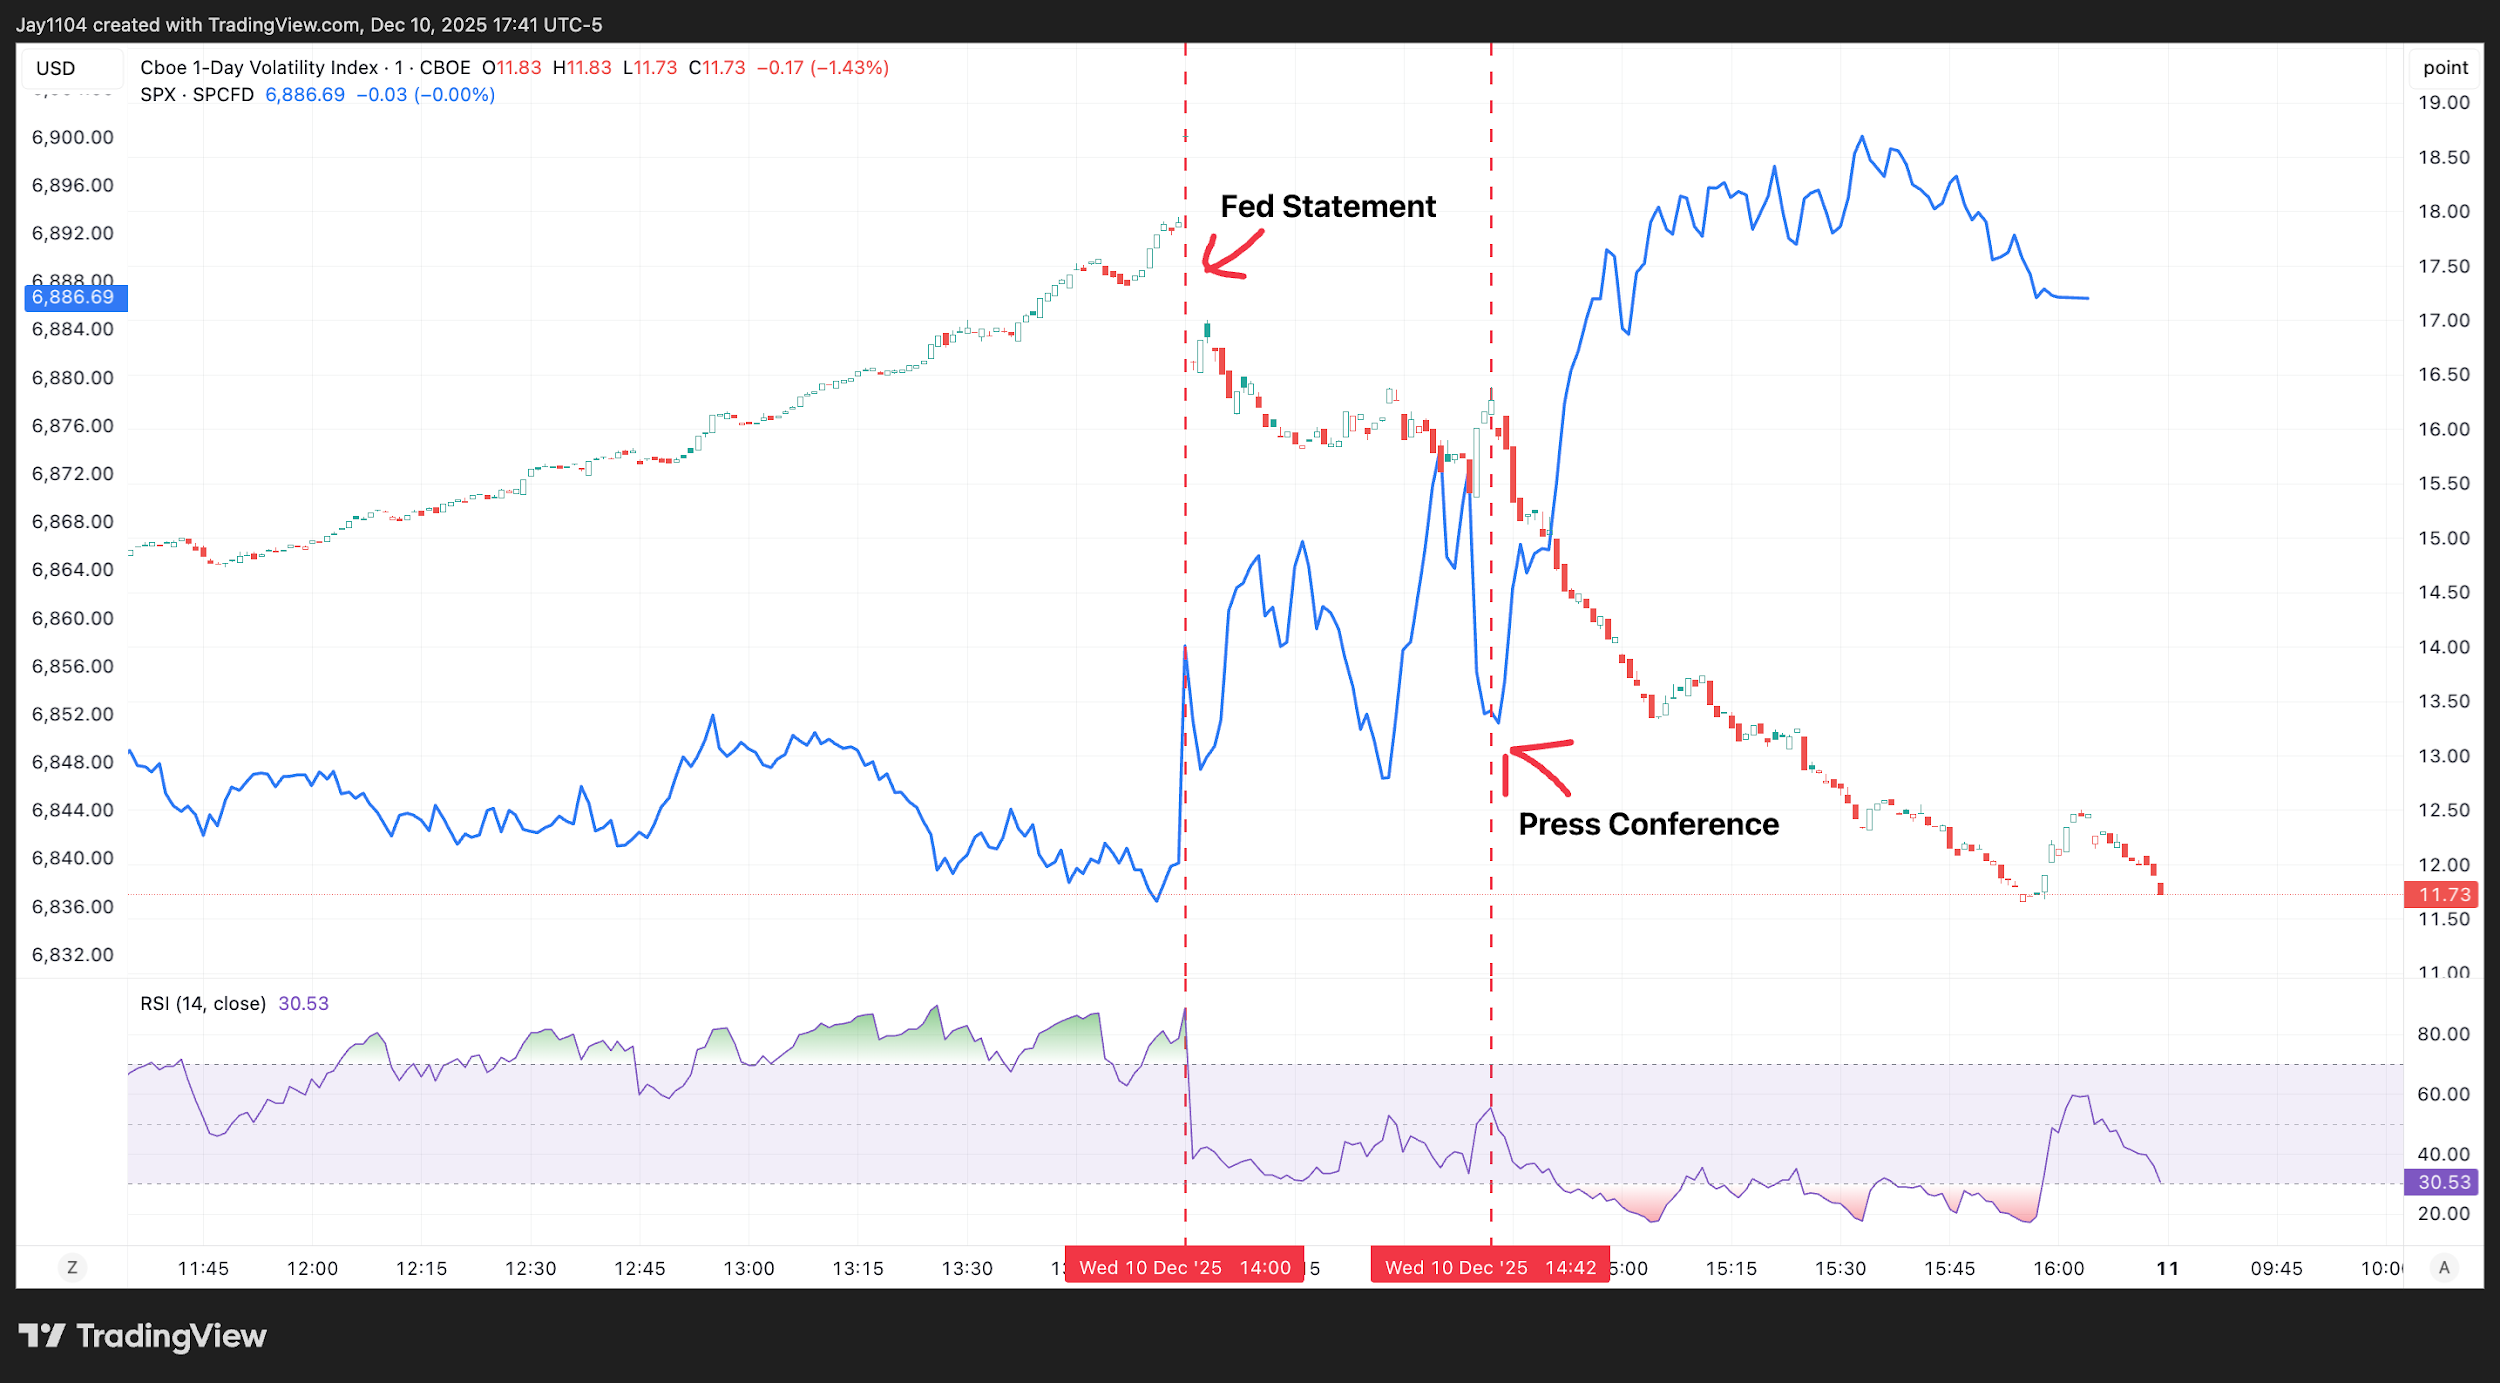
Implied volatility, as measured by the VIX 1-day, rose to around 18 ahead of the release of the Fed statement and Summary of Economic Projections. As anticipated, implied volatility started to decline right after the release of the statement, then, after a brief pause, declined further, starting around 2:45 PM ET, following the initial moments of Powell’s press conference. [Chart1]
(Source: TradingView)
(Past performance is not a reliable indicator of future results)
[Chart1]
The decline in implied volatility ultimately caused the S&P 500 to rise, as implied volatility exited the market, option premiums decayed, and hedges were unwound. The challenge for the stock market on 11 December is that the VIX 1-Day has dropped back below 12, indicating that it is unlikely for there to be the same level of volatility selling to help lift the S&P 500 higher, leaving the market back in the same low “energy” position it was at the start of the week.
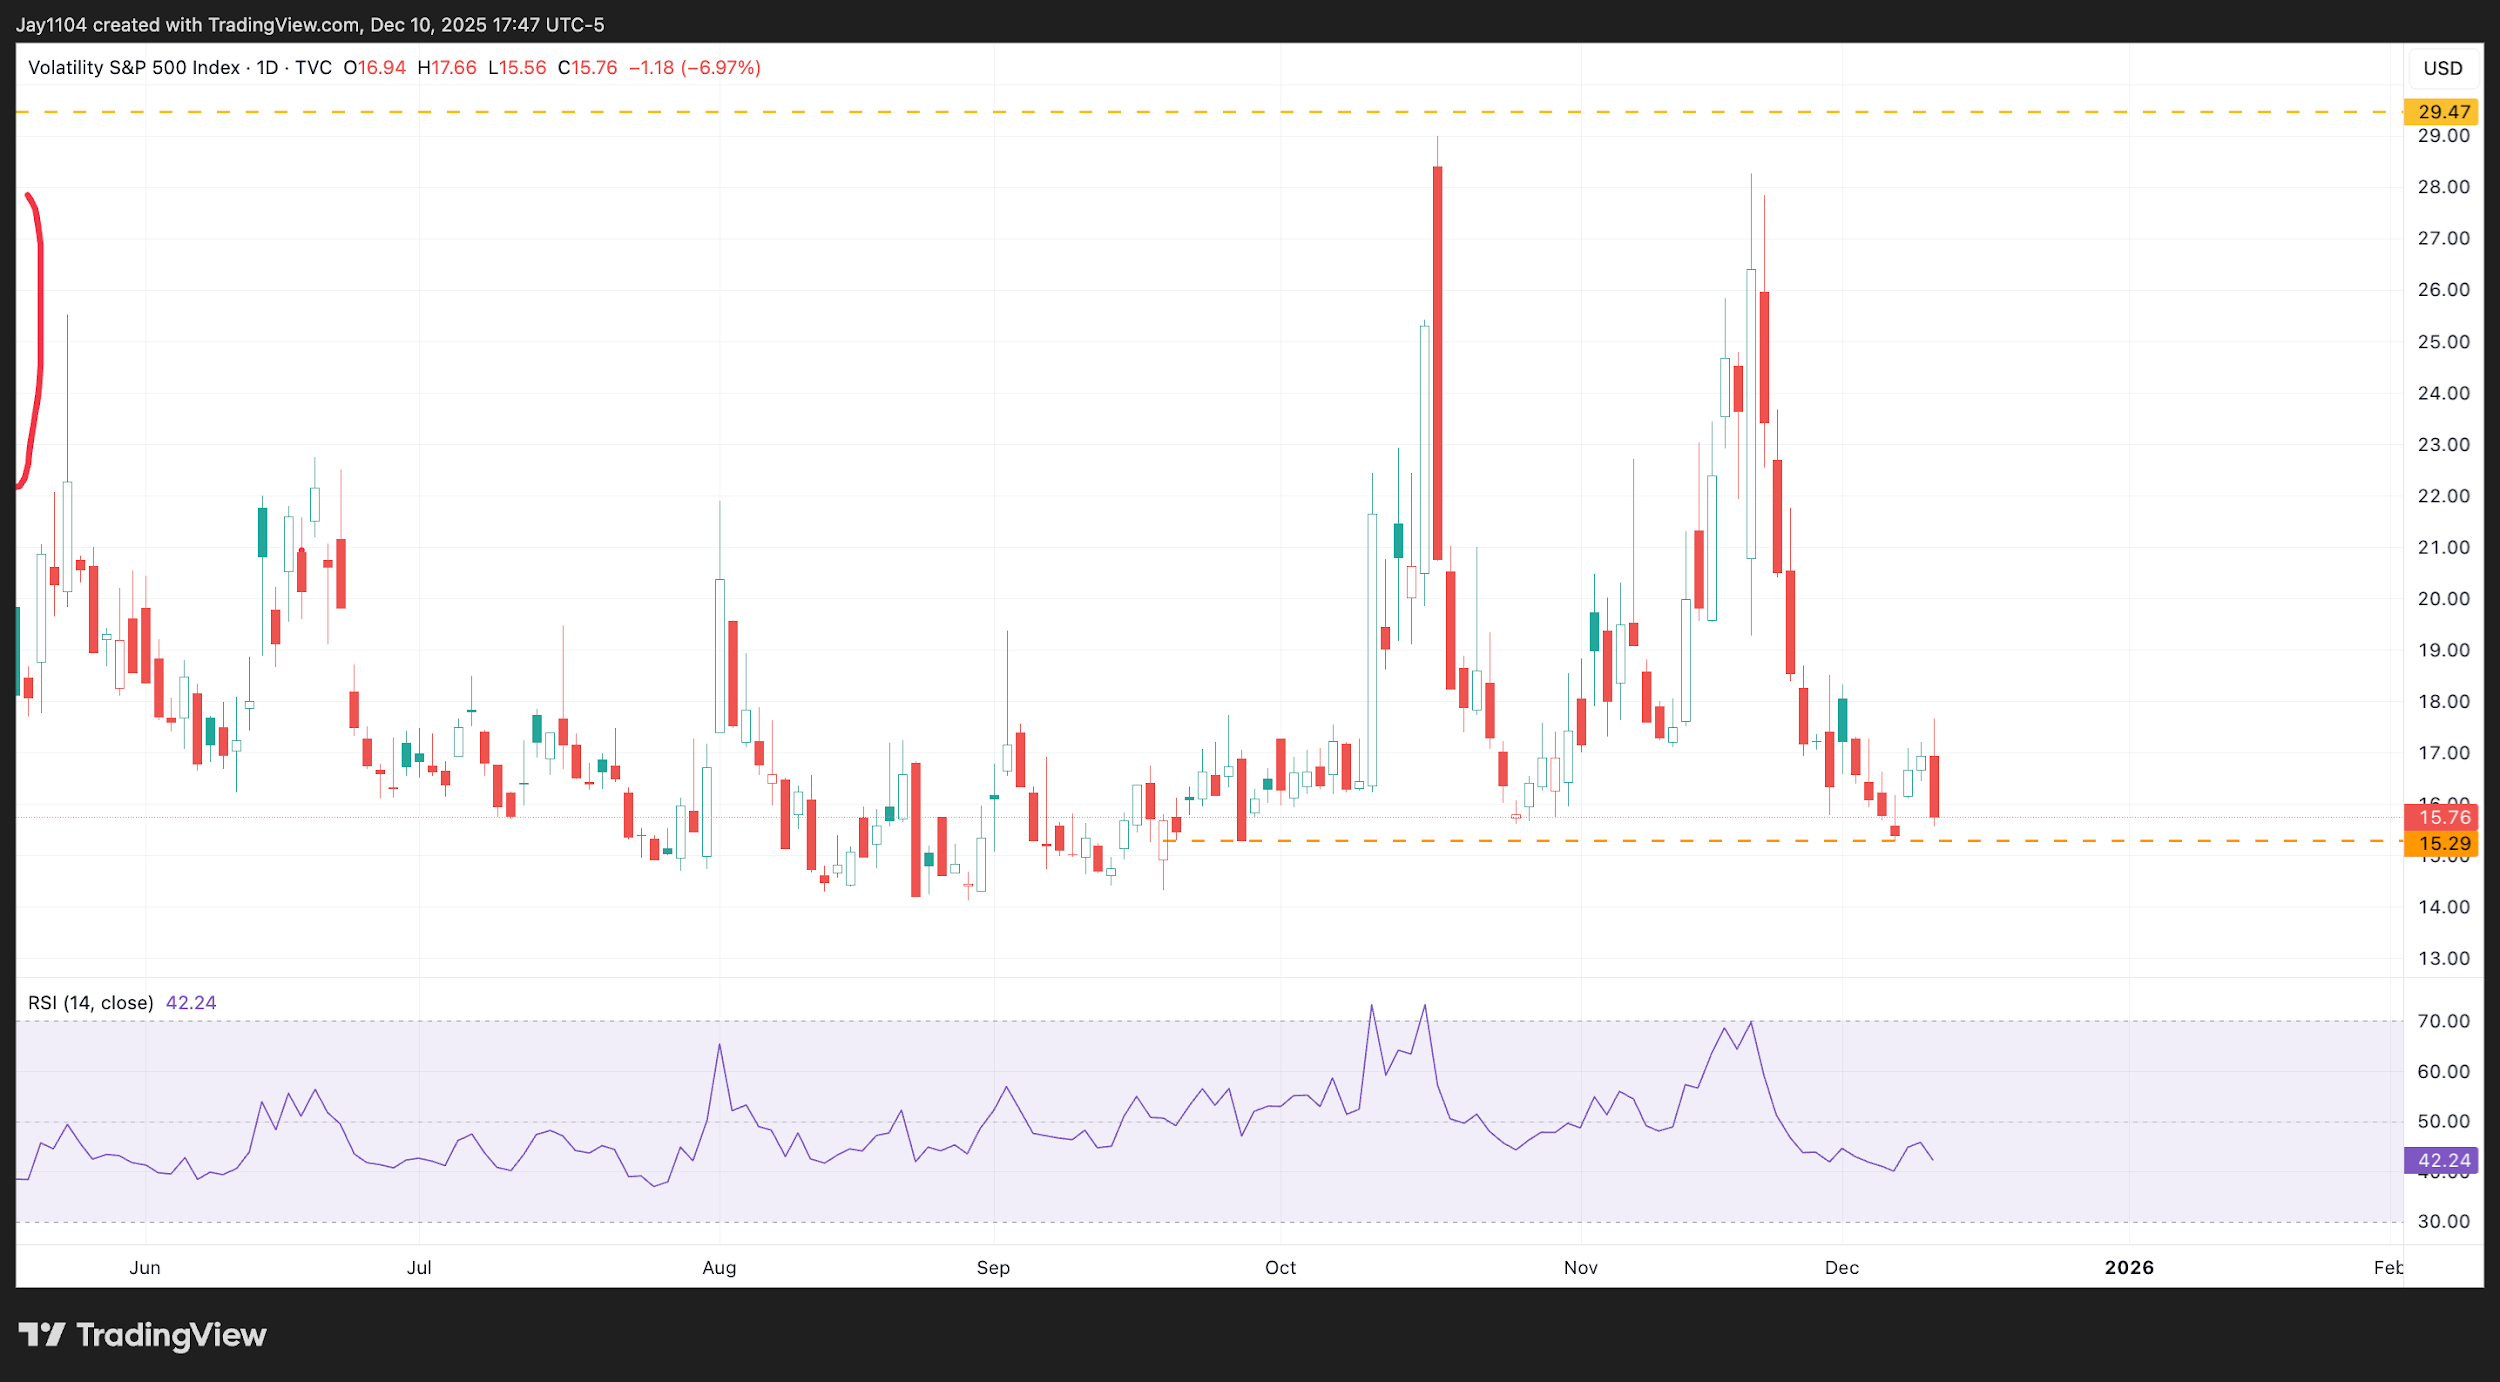
Even the VIX index itself reached an intraday high of about 17.5 and closed below 16. [Chart2] The technical charts show that 16 has been at the lower end of the recent trading range, which may act as a near-term reference point for equity market movement, including the S&P 500.The week of 15 December is a busy one, with a US jobs report, a US CPI report, and interest rate decisions from the Bank of Japan and the ECB. All these events are likely to keep volatility elevated. Therefore, while today’s price movement was easily anticipated, it may not carry through in the remaining days of the week.
(Source: TradingView)
(Past performance is not a reliable indicator of future results)
[Chart2]
Rates and the Dollar Fall
Additionally, the Summary of Economic Projections continues to suggest that the Fed’s neutral rate is around 3% to 3.5%, as the Fed appears to have upgraded its 2026 growth outlook. That would imply that the Fed, at its 2026 projection of 3.4%, is not acting as a restrictive force on the growth and overall health of the US economy. The Fed also reduced its outlook for the unemployment rate and inflation for 2026.
Chair Powell alluded to this idea at the press conference as well, noting that the Committee believes it is currently near the upper end of the neutral interest rate range with the present Fed funds target rate. This could be particularly important for Treasury bonds, especially at the back end of the curve, given that the yield curve has historically remained relatively flat. If we are approaching a point where rates are likely to bottom somewhere between 3.1% and 3.4%, then perhaps that suggests that most of the steepening of the curve will need to come from the 10-year and 30-year yields rising further from current levels.
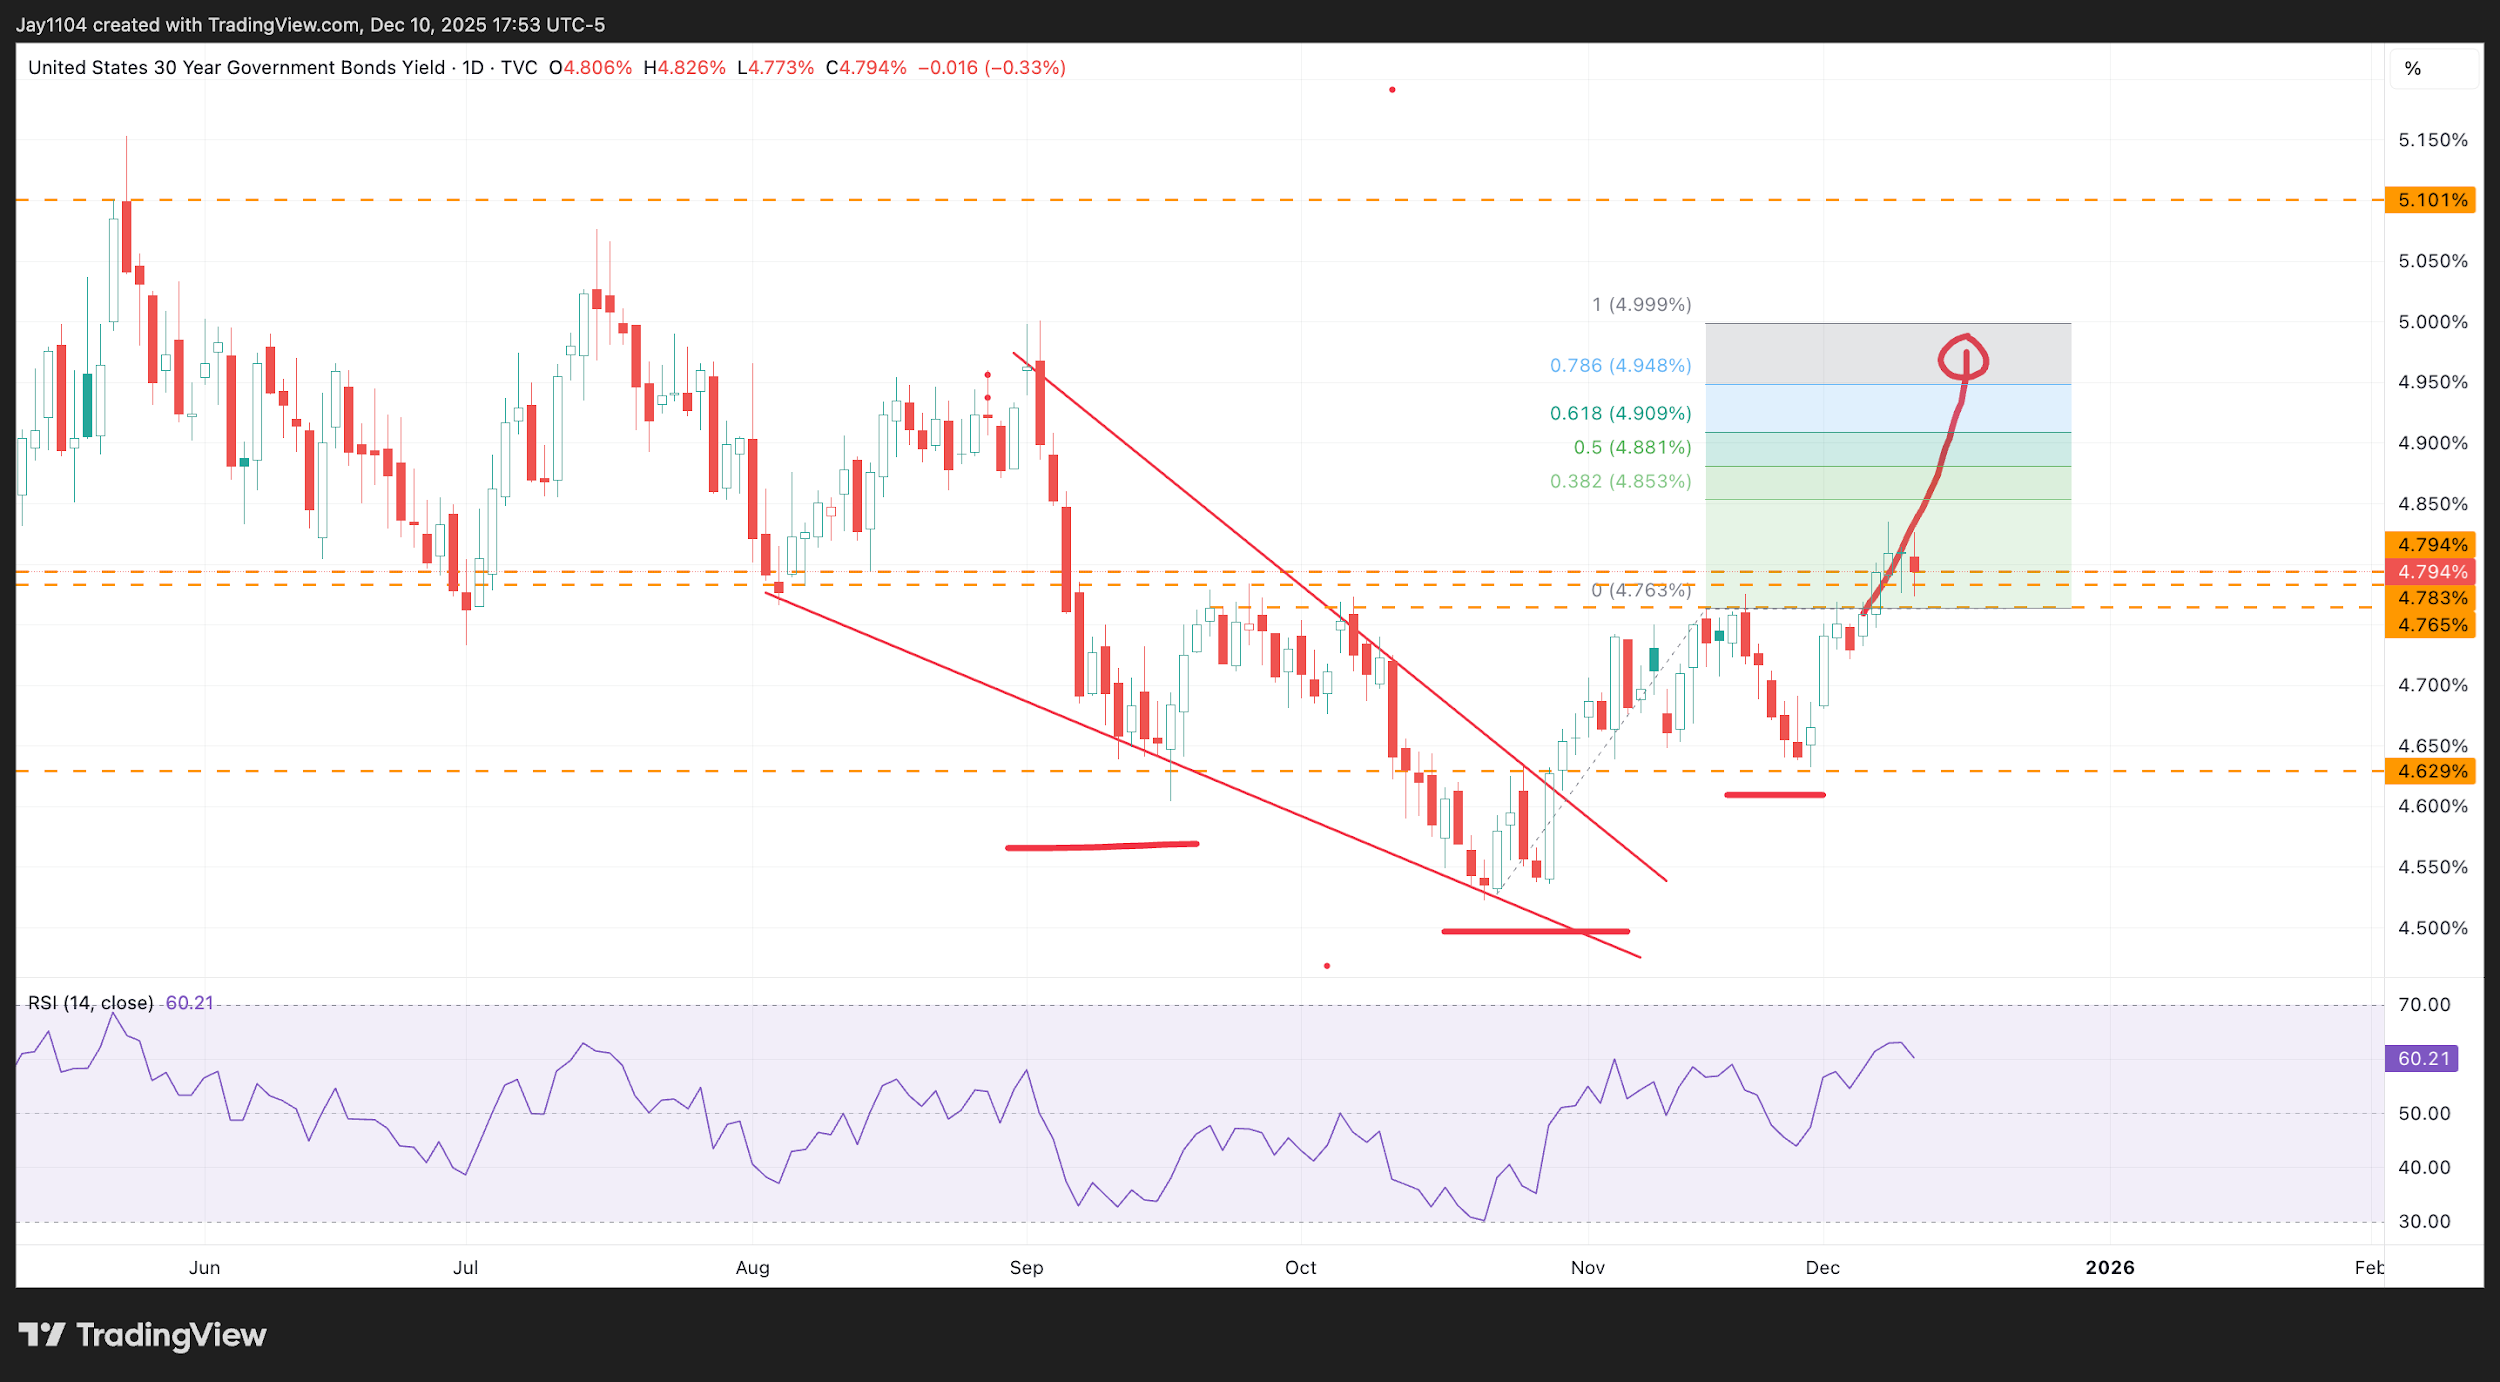
The 30-year rate fell by roughly two basis points on the day, finishing around 4.8%. This has been a key area of support and resistance for the 30-year Treasury between 4.75% and 4.80%. If the 30-year rate remains near or above this support zone, it may face upward pressure towards the 5% level. However, a move below this range could instead open the door to further downside. [Chart3] In either scenario, shifts in long-term yields can continue to influence the shape of the yield curve — particularly as markets respond to the Fed’s clearer short-term policy outlook.
(Source: TradingView)
(Past performance is not a reliable indicator of future results)
[Chart3]
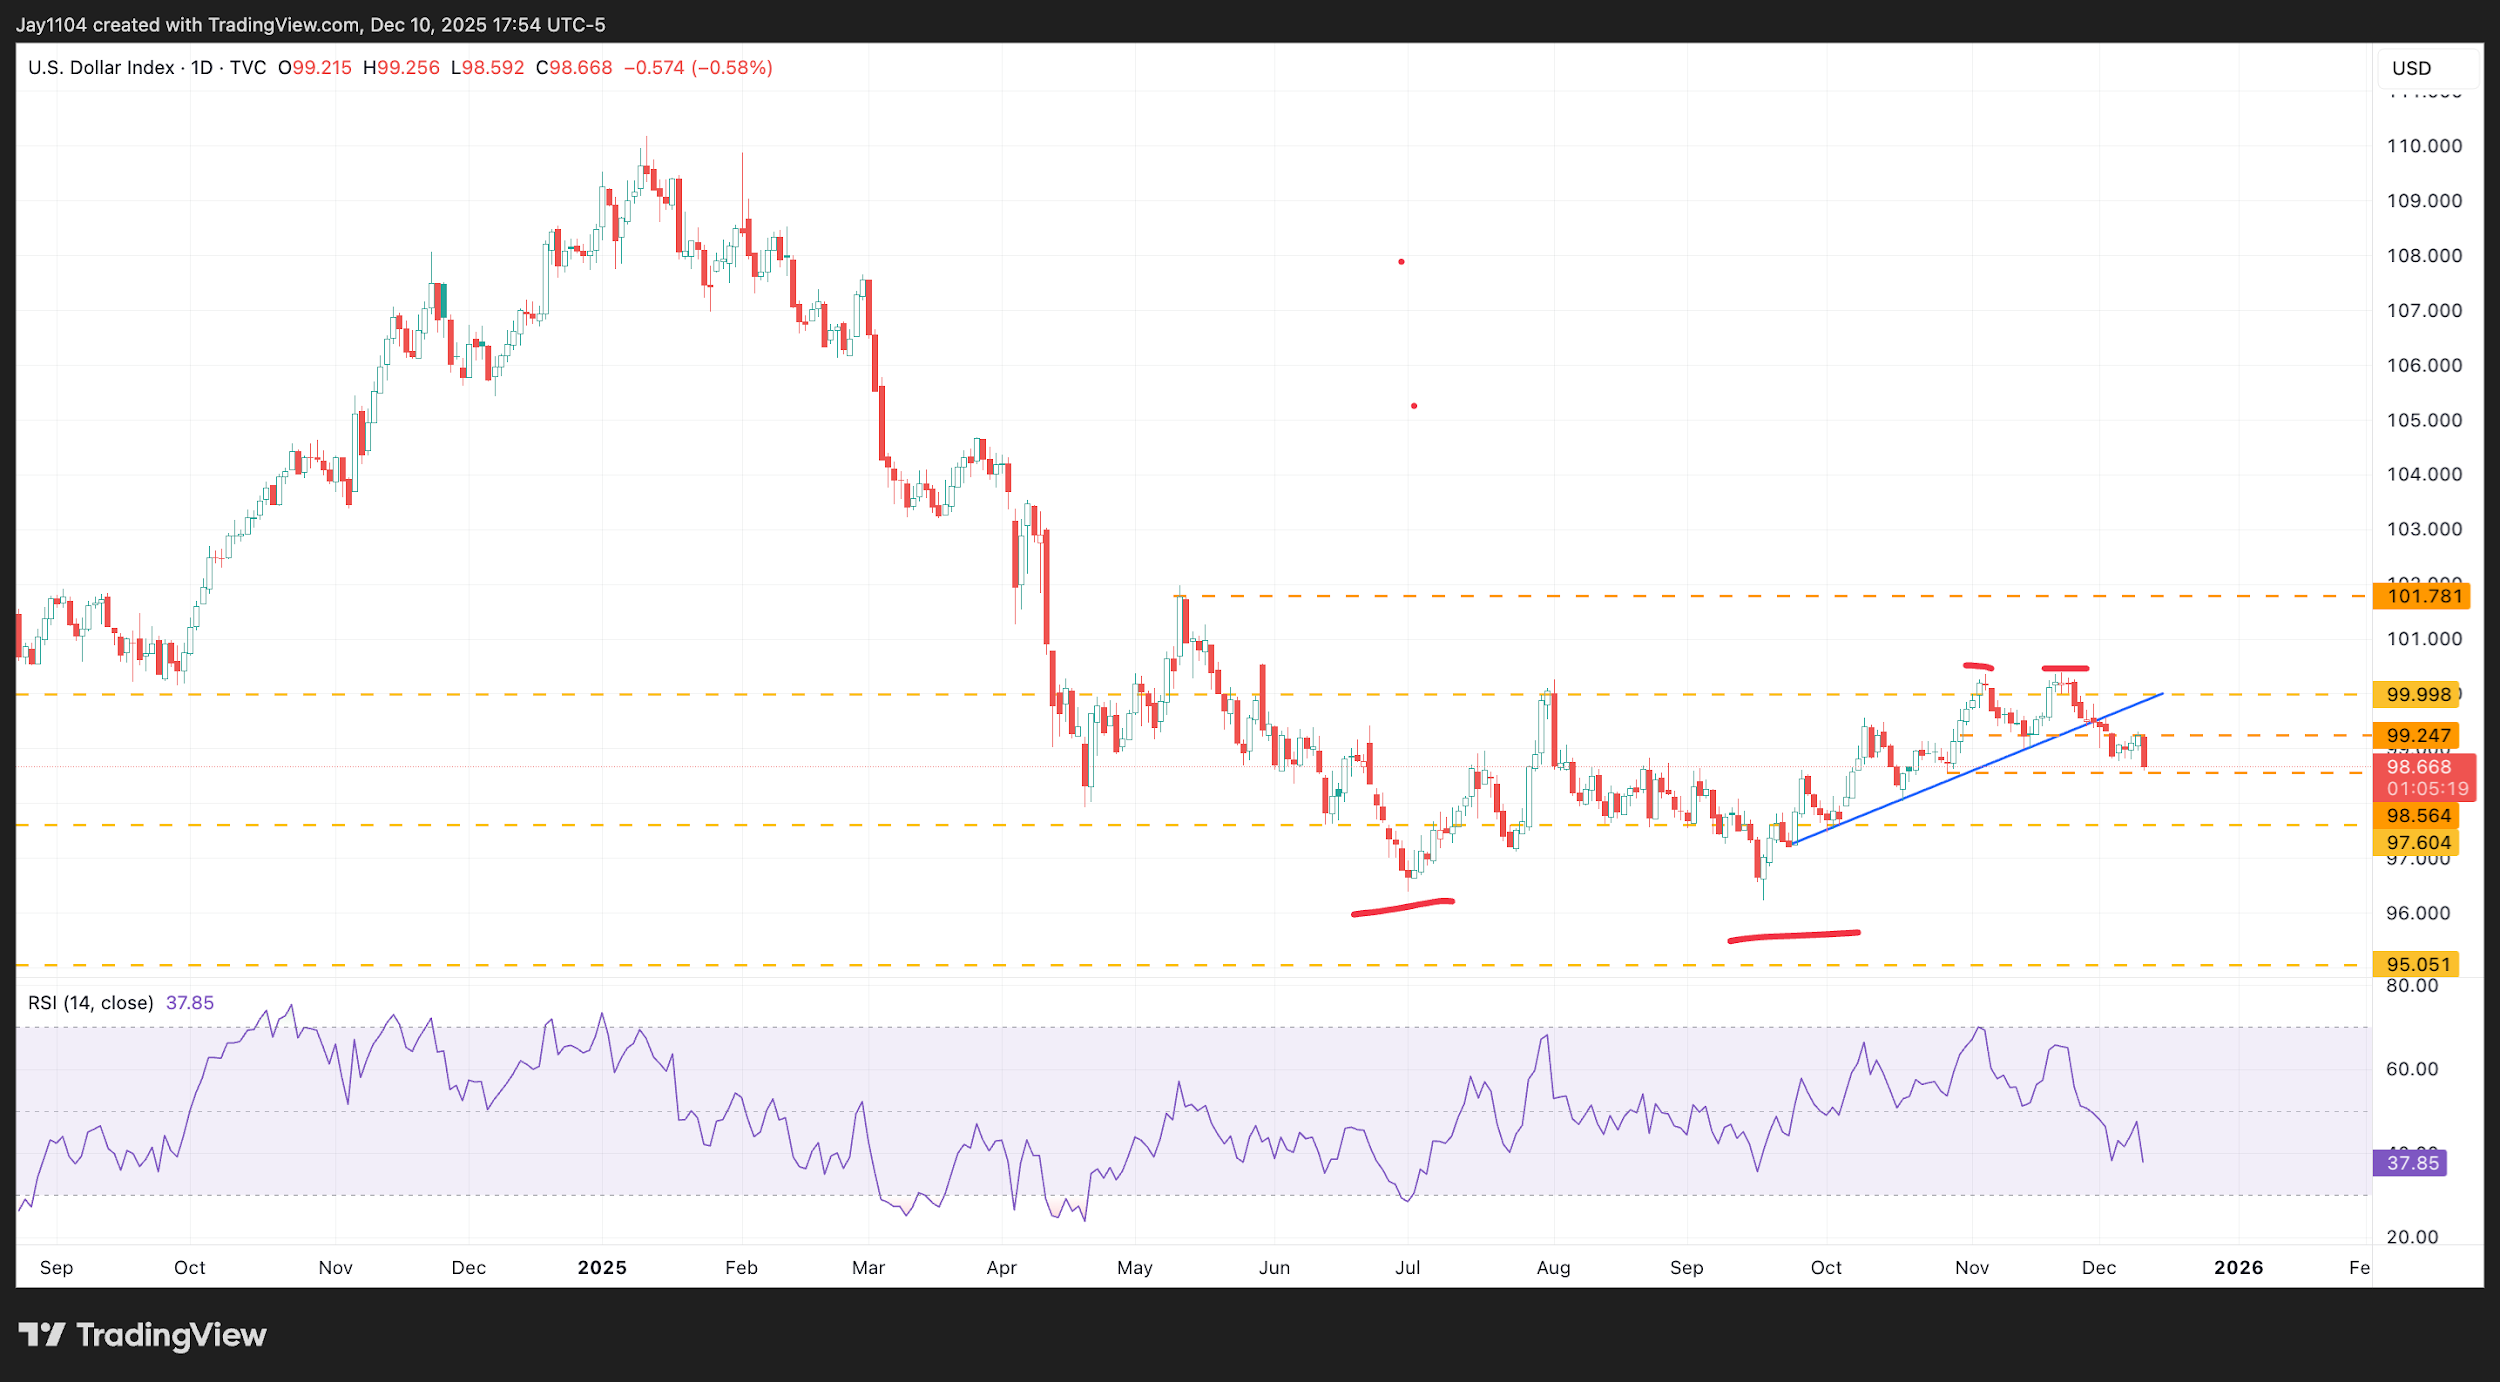
Meanwhile, the dollar index fell by roughly 60 basis points on the day. The technical chart suggests the dollar index is approaching a critical support level around 98.5. As long as the dollar index can hold that level and rebound from it, there remains potential for the dollar to continue rising. The chart also indicates that a break of support at 98.5 would likely see the dollar index move back down towards 97.60, which sits near the lower end of the range and represents a critical support level that needs to hold to prevent the dollar from falling to new lows for the year. [Chart4]
(Source: TradingView)
(Past performance is not a reliable indicator of future results)
[Chart4]