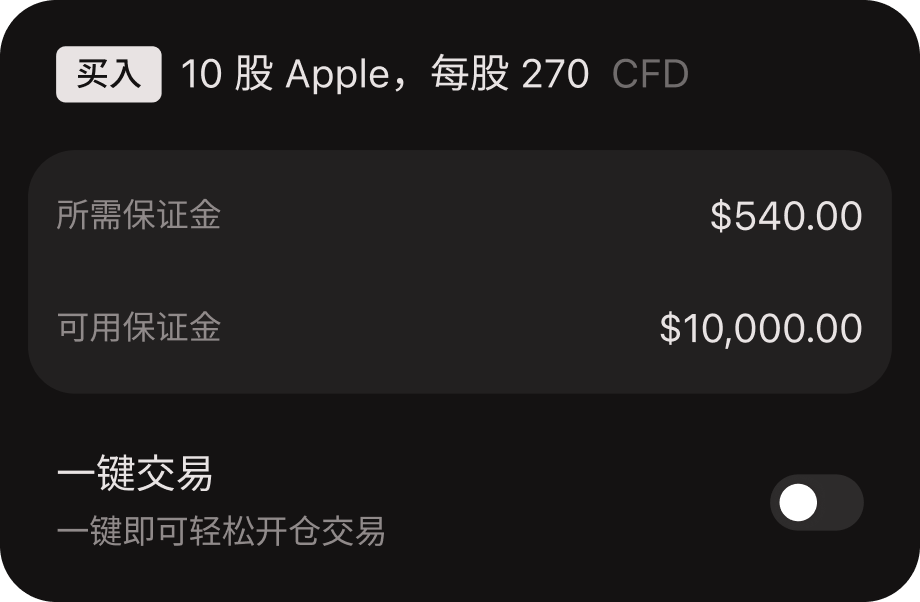
CFD 属于复杂的高风险金融工具,其杠杆作用可能导致投资者迅速亏损。 84% 的散户投资者因进行 CFD 交易遭受资金损失。 请您谨慎考虑自己是否了解 CFD 操作,以及是否能够接受高额亏损的风险。

交易 Perficient - PRFT CFD

76.38
1.52%
  • 概括
  • 历史数据
  • 活动
  • 收入报表
  • 资产负债表
  • 现金流
  • 所有权
交易条件
价差 0.15
多头隔夜费

Long position overnight fee


Margin. Your investment $1,000.00
隔夜费用 -0.025457 %
Charges from borrowed part ($-1.02)
Trade size with leverage ~ $5,000.00
Money from leverage ~ $4,000.00

前往平台
-0.025457%
空头隔夜费

Short position overnight fee


Margin. Your investment $1,000.00
隔夜费用 0.003235 %
Charges from borrowed part ($0.13)
Trade size with leverage ~ $5,000.00
Money from leverage ~ $4,000.00

前往平台
0.003235%
隔夜费时间 21:00 (UTC)
最小交易量 1
货币 USD
保证金 20%
上市交易所 United States of America
交易费 0%

*Information provided by Capital.com

Perficient Inc ESG Risk Ratings

High Medium Low Negligible

‘B’ score indicates good relative ESG performance and above average degree of transparency in reporting material ESG data publicly.

关键数据
前收盘价* 77.56
开仓* 77.51
1 年变化* -22.66%
日范围* 75.93 - 77.51
52 周范围 59.79-110.28
平均交易量(10 天) 200.45K
平均交易量(3 个月) 4.69M
市值 2.74B
市盈率 27.18
流通股 34.84M
收入 914.36M
EPS 2.90
股息(收益率 %) N/A
贝塔 1.54
下一个财报发布日期 Aug 2, 2023

所有数据都是由Refinitiv提供的, 除了标有星号的数据, 这是*由 Capital.com 提供的数据

  • Last Week
  • Last Month
  • Last Year
  • Last two Years
  • Max
  • Daily
  • Weekly
  • Monthly
Date 平仓 Change Change (%) 開倉 High Low
May 30, 2023 77.56 -1.15 -1.46% 78.71 79.10 77.53
May 26, 2023 78.70 0.91 1.17% 77.79 79.23 77.44
May 25, 2023 77.96 3.02 4.03% 74.94 78.30 74.94
May 24, 2023 76.87 0.43 0.56% 76.44 78.22 76.16
May 23, 2023 78.19 0.00 0.00% 78.19 79.99 77.78
May 22, 2023 78.74 2.57 3.37% 76.17 79.00 76.16
May 19, 2023 77.29 -0.66 -0.85% 77.95 78.47 76.74
May 18, 2023 77.74 3.40 4.57% 74.34 77.92 74.34
May 17, 2023 76.14 1.53 2.05% 74.61 76.38 74.21
May 16, 2023 74.68 1.14 1.55% 73.54 75.21 73.42
May 15, 2023 74.40 2.95 4.13% 71.45 74.80 71.45
May 12, 2023 73.68 1.99 2.78% 71.69 74.96 71.45
May 11, 2023 74.45 1.14 1.56% 73.31 74.51 72.20
May 10, 2023 73.78 1.24 1.71% 72.54 73.83 72.07
May 9, 2023 72.52 1.07 1.50% 71.45 72.83 71.45
May 8, 2023 72.62 -0.41 -0.56% 73.03 73.85 71.53
May 5, 2023 73.80 0.34 0.46% 73.46 75.10 73.35
May 4, 2023 74.57 0.11 0.15% 74.46 75.62 72.61
May 3, 2023 74.45 5.50 7.98% 68.95 74.52 68.95
May 2, 2023 69.41 6.15 9.72% 63.26 70.12 63.26

Perficient Events

时间(协调世界时) (UTC) 国家/地区 事件
Wednesday, June 7, 2023

时间(协调世界时) (UTC)

15:00

国家/地区

US

事件

Perficient Inc Annual Shareholders Meeting

Forecast

-

Previous

-
Wednesday, August 2, 2023

时间(协调世界时) (UTC)

12:30

国家/地区

US

事件

Q2 2023 Perficient Inc Earnings Release

Forecast

-

Previous

-
Wednesday, October 25, 2023

时间(协调世界时) (UTC)

12:30

国家/地区

US

事件

Q3 2023 Perficient Inc Earnings Release

Forecast

-

Previous

-
查看所有活動
  • 年度
  • 每季度
2022 2021 2020 2019 2018
总收入 905.062 761.027 612.133 565.527 498.375
收入 905.062 761.027 612.133 565.527 498.375
收入成本,共计 552.703 468.813 380.723 354.213 319.831
毛利 352.359 292.214 231.41 211.314 178.544
总营业费用 760.787 684.091 561.416 510.195 462.431
销售/一般/行政费用,总计 171.128 152.419 134.675 134.187 118.484
Depreciation / Amortization 33.036 29.851 28.287 20.598 20.428
异常费用(收入) 3.653 32.81 8.212 0.896 1.872
Other Operating Expenses, Total 0.267 0.198 9.519 0.301 1.816
营业收入 144.275 76.936 50.717 55.332 35.944
利息收入(费用),非经营净值 -3.154 -14.052 -10.128 -7.418 -3.56
其他,净值 -0.16 -0.401 -0.26 0.027 -0.012
税前净收入 140.961 62.483 40.329 47.941 32.372
税后净收入 104.392 52.091 30.181 37.125 24.559
未计算非常项目前的净收益 104.392 52.091 30.181 37.125 24.559
净收入 104.392 52.091 30.181 37.125 24.559
普通股股东可获收益 (不含非经常性项目) 104.392 52.091 30.181 37.125 24.559
普通股股东可获收益 (含非經常性項目) 104.392 52.091 30.181 37.125 24.559
摊薄净收入 106.653 52.091 30.181 37.125 24.559
摊薄后加权平均股 36.731 34.67 32.516 32.243 33.502
扣除特别项目的每股摊薄盈利 2.90362 1.50248 0.92819 1.15141 0.73306
每股正常摊薄盈利 2.97728 2.29144 1.11719 1.17293 0.77545
非常规项目总计
摊薄调整 2.261
Mar 2023 Dec 2022 Sep 2022 Jun 2022 Mar 2022
总收入 231.408 232.599 227.614 222.738 222.111
收入 231.408 232.599 227.614 222.738 222.111
收入成本,共计 144.212 141.007 136.416 136.762 138.518
毛利 87.196 91.592 91.198 85.976 83.593
总营业费用 194.307 195.253 194.394 183.199 187.941
销售/一般/行政费用,总计 43.92 43.744 44.273 40.86 42.251
Depreciation / Amortization 8.122 8.739 8.442 8.003 7.852
异常费用(收入) 0.079 1.145 2.148 0.061 0.299
Other Operating Expenses, Total -2.026 0.618 3.115 -2.487 -0.979
营业收入 37.101 37.346 33.22 39.539 34.17
利息收入(费用),非经营净值 -0.505 -0.846 -0.616 -0.805 -0.887
其他,净值 -0.075 0.246 -0.02 -0.153 -0.233
税前净收入 36.521 36.746 32.584 38.581 33.05
税后净收入 26.8 26.459 23.015 27.782 27.136
未计算非常项目前的净收益 26.8 26.459 23.015 27.782 27.136
净收入 26.8 26.459 23.015 27.782 27.136
普通股股东可获收益 (不含非经常性项目) 26.8 26.459 23.015 27.782 27.136
普通股股东可获收益 (含非經常性項目) 26.8 26.459 23.015 27.782 27.136
摊薄净收入 26.8 28.72 23.015 27.782 27.136
摊薄后加权平均股 36.697 36.635 36.663 36.785 36.839
扣除特别项目的每股摊薄盈利 0.7303 0.78395 0.62774 0.75525 0.73661
Dividends per Share - Common Stock Primary Issue 0 0 0 0
每股正常摊薄盈利 0.73188 0.80645 0.66913 0.75645 0.74327
摊薄调整 2.261
  • 年度
  • 每季度
2022 2021 2020 2019 2018
流动资产总额 255.616 214.708 226.51 211.897 177.804
现金和短期投资 30.13 24.41 83.204 70.728 44.984
现金等价物 30.13 24.41 83.204 70.728 44.984
应收账款总额,净额 202.298 177.602 133.085 129.118 122.446
Accounts Receivable - Trade, Net 202.298 177.602 133.085 129.118 122.446
Prepaid Expenses 6.432 5.4 5.575 4.647 4.663
Other Current Assets, Total 16.756 7.296 4.646 7.404 5.711
Total Assets 995.888 882.572 785.761 640.492 570.544
Property/Plant/Equipment, Total - Net 45.058 48.1 50.441 39.918 6.677
Property/Plant/Equipment, Total - Gross 77.639 73.202 70.725 55.572 27.251
Accumulated Depreciation, Total -32.581 -25.102 -20.284 -15.654 -20.574
Goodwill, Net 565.161 515.229 427.928 335.564 327.992
Intangibles, Net 88.937 81.277 63.571 37.953 48.092
Other Long Term Assets, Total 41.116 23.258 17.311 15.16 9.979
Total Current Liabilities 129.131 119.951 128.88 84.584 74.823
Accounts Payable 24.351 26.074 25.613 23.081 24.437
Accrued Expenses 49.661 58.418 46.727 43.733 29.098
Notes Payable/Short Term Debt 0 0 0 0 0
Other Current Liabilities, Total 55.119 35.459 56.54 17.77 21.288
Total Liabilities 585.761 517.807 391.683 259.477 216.86
Total Long Term Debt 394.587 326.126 183.624 124.664 120.067
Long Term Debt 394.587 326.126 183.624 124.664 120.067
Deferred Income Tax 8.686 13.075 20.911 11.108 9.253
Other Liabilities, Total 53.357 58.655 58.268 39.121 12.717
Total Equity 410.127 364.765 394.078 381.015 353.684
Common Stock 0.053 0.053 0.05 0.049 0.048
Additional Paid-In Capital 403.866 423.235 459.866 455.465 437.25
Retained Earnings (Accumulated Deficit) 378.263 271.732 219.641 189.775 152.65
Treasury Stock - Common -354.536 -324.412 -289.225 -261.624 -233.676
Other Equity, Total -17.519 -5.843 3.746 -2.65 -2.588
Total Liabilities & Shareholders’ Equity 995.888 882.572 785.761 640.492 570.544
Total Common Shares Outstanding 34.0718 33.8812 32.0741 31.687 31.7709
Preferred Stock - Non Redeemable, Net 0 0 0
Mar 2023 Dec 2022 Sep 2022 Jun 2022 Mar 2022
流动资产总额 240.821 255.616 225.039 251.333 225.129
现金和短期投资 40.995 30.13 20.845 38.868 24.175
现金等价物 40.995 30.13 20.845 38.868 24.175
应收账款总额,净额 183.455 202.298 192.903 196.62 186.368
Accounts Receivable - Trade, Net 183.455 202.298 192.903 196.62 186.368
Prepaid Expenses 6.822 6.432 6.536 7.02 5.992
Other Current Assets, Total 9.549 16.756 4.755 8.825 8.594
Total Assets 981.855 995.888 948.737 926.943 902.821
Property/Plant/Equipment, Total - Net 43.034 45.058 47.886 52.362 46.323
Property/Plant/Equipment, Total - Gross 76.449 77.639 78.168 80.661 73.108
Accumulated Depreciation, Total -33.4 -32.581 -30.282 -28.299 -26.785
Goodwill, Net 569.39 565.161 545.842 512.716 518.95
Intangibles, Net 83.746 88.937 82.384 69.211 76.527
Other Long Term Assets, Total 44.864 41.116 47.586 41.321 35.892
Total Current Liabilities 82.12 129.131 104.015 94.072 94.757
Accounts Payable 14.529 24.351 19.3 20.588 22.241
Accrued Expenses 37.8 49.661 43.925 43.373 38.516
Notes Payable/Short Term Debt 0 0 0 0 0
Other Current Liabilities, Total 29.791 55.119 40.79 30.111 34
Total Liabilities 543.676 585.761 564.467 560.212 559.271
Total Long Term Debt 395.159 394.587 394.05 393.478 392.907
Long Term Debt 395.159 394.587 394.05 393.478 392.907
Deferred Income Tax 8.5 8.686 8.051 10.743 14.317
Other Liabilities, Total 57.897 53.357 58.351 61.919 57.29
Total Equity 438.179 410.127 384.27 366.731 343.55
Preferred Stock - Non Redeemable, Net 0 0 0 0 0
Common Stock 0.053 0.053 0.053 0.053 0.053
Additional Paid-In Capital 410.959 403.866 393.101 383.987 377.927
Retained Earnings (Accumulated Deficit) 405.063 378.263 351.804 328.789 301.007
Treasury Stock - Common -362.149 -354.536 -346.471 -337.237 -333.4
Other Equity, Total -15.747 -17.519 -14.217 -8.861 -2.037
Total Liabilities & Shareholders’ Equity 981.855 995.888 948.737 926.943 902.821
Total Common Shares Outstanding 34.159 34.0718 33.9478 33.9927 34.0176
  • 年度
  • 每季度
2022 2021 2020 2019 2018
净收入/起跑线 104.392 52.091 30.181 37.125 24.559
经营活动产生的现金 118.068 84.916 117.96 77.965 68.58
经营活动产生的现金 8.518 6.398 5.43 4.447 4.072
Amortization 24.518 23.453 22.857 16.151 16.356
Deferred Taxes -7.945 -12.662 -1.588 2.041 1.378
非现金物品 26.393 61.762 40.057 22.393 18.982
Cash Taxes Paid 39.974 16.122 5.256 7.405 5.127
已付现金利息 1.034 3.988 3.411 3.674 1.399
营运资金的变化 -37.808 -46.126 21.023 -4.192 3.233
投资活动产生的现金 -81.75 -119.052 -98.614 -20.399 -31.288
资本支出 -9.899 -10.204 -6.731 -9.256 -4.648
其他投资现金流量项目,总计 -71.851 -108.848 -91.883 -11.143 -26.64
融资活动产生的现金 -29.078 -23.839 -7.476 -32.051 1.919
融资现金流项目 -11.662 -104.344 -59.792 -11.617 -29.785
股票的发行(报废),净额 -17.381 2.315 2.955 -20.434 -52.214
债务的发行(退还),净额 -0.035 78.19 49.361 0 83.918
外汇效应 -1.52 -0.819 0.606 0.229 -0.534
现金净变化 5.72 -58.794 12.476 25.744 38.677
Mar 2023 Dec 2022 Sep 2022 Jun 2022 Mar 2022
Net income/Starting Line 26.8 104.392 77.933 54.918 27.136
Cash From Operating Activities 41.331 118.068 71.441 33.98 11.174
Cash From Operating Activities 2.305 8.518 6.233 3.878 1.873
Amortization 5.817 24.518 18.064 11.977 5.979
Deferred Taxes -1.885 -7.945 -7.353 -0.389 4.087
Non-Cash Items 5.256 26.393 19.204 9.435 5.335
Cash Taxes Paid 1.553 39.974 25.912 17.453 2.363
Cash Interest Paid 0.136 1.034 0.697 0.523 0.226
Changes in Working Capital 3.038 -37.808 -42.64 -45.839 -33.236
Cash From Investing Activities -1.315 -81.75 -52.413 -6.728 -2.714
Capital Expenditures -1.343 -9.899 -7.697 -6.661 -2.647
Other Investing Cash Flow Items, Total 0.028 -71.851 -44.716 -0.067 -0.067
Cash From Financing Activities -29.422 -29.078 -21.227 -12.25 -8.706
Financing Cash Flow Items -27.267 -11.662 -9.007 -9.007 -8.988
Issuance (Retirement) of Stock, Net -2.155 -17.381 -12.22 -3.243 0.282
Foreign Exchange Effects 0.271 -1.52 -1.366 -0.544 0.011
Net Change in Cash 10.865 5.72 -3.565 14.458 -0.235
Issuance (Retirement) of Debt, Net 0 -0.035 0
投资者名称 投资者类型 流通股百分比 持有股份 股份变动 持有日期 换手率
BlackRock Institutional Trust Company, N.A. Investment Advisor 14.4929 5049061 -99898 2023-03-31 LOW
The Vanguard Group, Inc. Investment Advisor/Hedge Fund 11.4255 3980433 -26464 2023-03-31 LOW
Wellington Management Company, LLP Investment Advisor/Hedge Fund 5.0094 1745181 364215 2023-03-31 LOW
State Street Global Advisors (US) Investment Advisor/Hedge Fund 3.5941 1252110 33388 2023-03-31 LOW
Geneva Capital Management LLC Investment Advisor 2.7478 957298 17919 2023-03-31 LOW
Dimensional Fund Advisors, L.P. Investment Advisor/Hedge Fund 2.6506 923418 12697 2023-03-31 LOW
Victory Capital Management Inc. Investment Advisor/Hedge Fund 2.5719 895987 763360 2023-03-31 LOW
Silvercrest Asset Management Group LLC Investment Advisor/Hedge Fund 2.298 800582 -20270 2023-03-31 LOW
Geode Capital Management, L.L.C. Investment Advisor/Hedge Fund 1.9149 667119 23917 2023-03-31 LOW
abrdn Inc. Investment Advisor/Hedge Fund 1.8538 645844 -65282 2023-03-31 LOW
Blue Grotto Capital, LLC Hedge Fund 1.8328 638523 -29239 2023-03-31
Atlanta Capital Management Company, L.L.C. Investment Advisor 1.8142 632035 -2199 2023-03-31 LOW
Fidelity Management & Research Company LLC Investment Advisor 1.6476 573982 -21285 2023-03-31 LOW
Southpoint Capital Advisors LP Hedge Fund 1.4352 500000 100000 2023-03-31 LOW
Davis (Jeffrey S) Individual Investor 1.2918 450026 49 2023-04-10 LOW
Fidelity Institutional Asset Management Investment Advisor 1.2688 442044 42237 2023-03-31 LOW
RBC Global Asset Management (U.S.) Inc. Investment Advisor/Hedge Fund 1.2323 429294 13588 2023-03-31 LOW
T. Rowe Price Associates, Inc. Investment Advisor 1.1872 413589 -953 2023-03-31 LOW
Emerald Advisers LLC Investment Advisor 1.1524 401460 -328169 2023-03-31 MED
Schroder Investment Management North America Inc. Investment Advisor 1.1157 388687 10632 2023-03-31 LOW

为什么选择 Capital.com?让我们的数字来说话。

Capital.com Group

530K+

交易者

87K+

每月活跃客户

$46M+

每月投资额

$31M+

每月提取金额

交易计算器

如果您在特定日期(选择一个日期)开立差价合约交易并在不同日期(选择一个日期)关闭交易,计算您的假设盈亏。

交易佣金
0
  • 1:1
杠杆
1:1
  • 20
  • 100
  • 500
  • 1000
  • 10000
投资
交易规模(杠杆 x 投资):
開倉

平仓

做空 做多

Perficient Company profile

关于 Perficient

Perficient, Inc.是一家全球数字咨询公司。 公司提供各种解决方案,使其客户能够运营一个实时的企业,调整业务流程和支持这些流程的系统,以满足全球竞争性市场不断变化的需求。 该公司提供的解决方案组合被归入六个主要解决方案领域。 战略与咨询、数据与智能、平台与技术、客户体验与数字营销、创新与产品开发以及优化的全球交付。 其解决方案包括数字战略、技术战略、分析、人工智能、大数据、商业智能、区块链、客户关系管理、内容架构和转换率优化等等。 它为医疗保健、金融服务、消费市场、汽车、生命科学、制造业、能源+公用事业和电信市场提供服务。

Industry: IT Services & Consulting (NEC)

555 Maryville University Dr Ste 600
ST. LOUIS
MISSOURI 63141-5844
US

收入报表

  • Annual
  • Quarterly

人们也观看

US100

14,236.50 Price
-0.950% 1D Chg, %
多头隔夜费 -0.0255%
空头隔夜费 0.0032%
隔夜费时间 21:00 (UTC)
价差 1.8

Oil - Crude

68.41 Price
-1.840% 1D Chg, %
多头隔夜费 -0.0209%
空头隔夜费 -0.0010%
隔夜费时间 21:00 (UTC)
价差 0.03

Gold

1,965.75 Price
+0.250% 1D Chg, %
多头隔夜费 -0.0089%
空头隔夜费 0.0006%
隔夜费时间 21:00 (UTC)
价差 0.30

BTC/USD

27,121.15 Price
-2.370% 1D Chg, %
多头隔夜费 -0.0616%
空头隔夜费 0.0137%
隔夜费时间 21:00 (UTC)
价差 60.00

还在找一位您可以信任的经纪商吗?

加入成为全球530,000万多名交易者的一份子,选择利用Capital.com进行交易吧。

1. 创建和验证您的账户 2. 进行存款 3. 找到适合您的交易