USD/JPY forecast 2026–2030: Third-party price targets
USD/JPY is trading around 155.70 in intraday action on 8 December 2025, close to the top of its session range between 154.41 and 155.71 as of 2:44pm UTC. The pair remains near levels seen over the past week, with external data showing fluctuations between roughly 154.5 and 156.0, suggesting relatively contained day-to-day volatility. Past performance is not a reliable indicator of future results.
The latest USD/JPY moves come amid a softer US dollar as markets position for the upcoming Federal Reserve meeting (Reuters, 8 December 2025). Benchmark US 10-year Treasury yields sit near 4.1% after easing in recent sessions (CNBC, 8 December 2025). On the Japanese side, the yen continues to respond to expectations that the Bank of Japan may adjust its ultra-loose policy later in December (FXStreet, 2 December 2025). Recent comments from Governor Kazuo Ueda and other officials have kept this theme in focus.
USD/JPY forecast 2026–2030: Analyst price target view
Third-party USD/JPY predictions from October to December 2025 shows a wide range of expectations for the pair through late 2025 and into 2026. These views are shaped by assumptions around Federal Reserve rate cuts, potential changes in Bank of Japan policy and evolving political considerations in both economies.
HSBC (bank FX research)
An October research note lowers HSBC’s year-end 2025 USD/JPY projection to around 148. The bank describes this as a gradual adjustment rather than a sharp reversal, citing political uncertainty following Japan’s election and a reassessment of earlier expectations linked to US–Japan trade developments (Investing.com, 10 October 2025).
BNP Paribas Wealth Management (currencies focus)
A November currencies report provides a 3-month forecast around 152 and a 12-month view near 148. The bank notes limited scope for prolonged yen appreciation after recent political developments, while still acknowledging potential medium-term support for the currency if the Federal Reserve cuts rates and the Bank of Japan proceeds cautiously with tightening (BNP Paribas Wealth Management, 13 November 2025).
A December macro scenario sets a longer-term projection of USD/JPY around 160 by Q4 2026. The outlook includes expectations of slower US growth and a degree of yen depreciation, linked to structural factors in fiscal policy and relative growth trends across major economies (BND Paribas Wealth Management, 8 December 2025).
Morgan Stanley (investment bank FX outlook)
Morgan Stanley, as reported by Investing.com, forecasts USD/JPY to decline toward 140 in the near term before recovering to around 147 by year-end, describing this as part of a broader currency outlook rather than a single-point long-run target. The bank cites an increased USD-negative risk premium and expectations for significant declines in front-end US interest rates as key assumptions behind a softer dollar against the yen (Investing.com, 24 November 2025).
MUFG (JPY monthly strategy view)
MUFG’s JPY Monthly report dated 2 December 2025 states that concerns over excessive yen weakness are likely to recede in its main scenario for 2026, with the bank expecting a roughly 10‑yen rise in USD/JPY seen after Japan’s October 2025 leadership race to unwind over time. The bank outlines a framework in which anticipated Federal Reserve easing and continued, but measured, Bank of Japan rate hikes would support a firmer yen, even as fiscal risks are seen preventing a move toward aggressive yen buying (MUFG Research, 3 December 2025).
Predictions and third-party forecasts are inherently uncertain, as they cannot fully account for unexpected market developments. Past performance is not a reliable indicator of future results.
US dollar–Japanese yen: Technical overview
As of 2:44pm UTC on 8 December 2025, USD/JPY trades around 155.70, sitting slightly above the 20-, 50-, 100- and 200-day simple moving-average cluster at roughly 156, 153, 151 and 148 respectively. This keeps the broader trend tilted higher, while the 10-day SMA near 155.8 acts as near-term resistance. The 14-day RSI sits around 56 in an upper-neutral band, and the ADX around 18 indicates a trend that is present but not strongly established on the daily timeframe.
Classic resistance levels appear at R1 around 158.4, followed by R2 near 160.7 should price sustain a close above the first barrier. On the downside, the Classic Pivot at 155.6 forms initial support, ahead of the 100-day SMA near 150.5 and S1 around 153.3 as intermediate markers (TradingView, 8 December 2025).
This analysis is for informational purposes only and does not constitute financial advice.
USD/JPY history
USD/JPY has traded within a broad but orderly range over the past two years, rising from around 141 in late December 2023 to roughly 155.7 by 8 December 2025. During this period, the pair moved through the mid-140s by mid-2024, briefly exceeded 161 in early July 2024 and later eased towards the high-140s before firming again into 2025.
Throughout 2025, USD/JPY has mostly remained above 140, with dips into the low-140s in April followed by a gradual rise into the mid- and high-140s and low-150s through late summer. By October and November, closes were frequently between 147 and 157. On 8 December 2025, the pair ended the session near 155.74, placing it modestly above the late-2024 zone around 149–157 and closer to the upper half of its two-year range.
Past performance is not a reliable indicator of future results. Share prices are indicative and may differ from live market prices.
Capital.com analyst view
USD/JPY has spent much of the past two years moving higher within a broad range, with the pair trading in the mid-150s as of 8 December 2025. This reflects shifting expectations around interest-rate paths in major economies, recurring volatility around central-bank events and data releases, and periods when the yen has alternated between a preferred funding currency and a perceived safe-haven asset.
For some traders, USD/JPY’s liquidity, frequent price moves and tight spreads can make it an actively monitored pair. However, leverage, intraday swings and changes in global sentiment can also increase the speed and scale of potential losses if markets move against a position.
Unexpected policy shifts or data surprises can move the pair sharply in either direction. A softer US dollar or a more assertive stance from the Bank of Japan could support yen strength, while renewed US dollar demand or a return to ultra-loose Japanese policy could put upward pressure on the cross. The same drivers that can support upside can also translate into downside risk, emphasising the need to consider both scenarios.
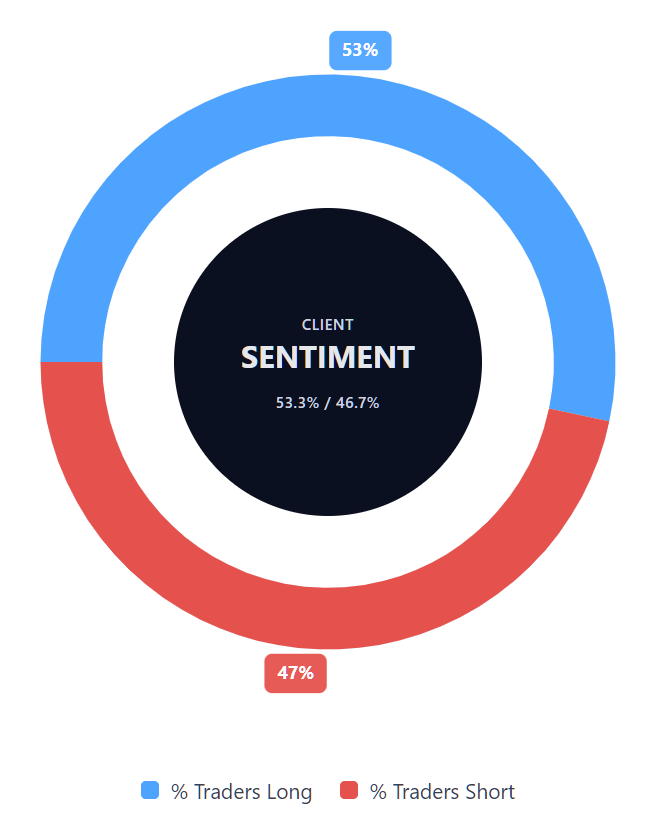
Capital.com’s client sentiment for USD/JPY CFDs
As of 8 December 2025, positioning shows 53.3% buyers and 46.7% sellers, leaving sentiment close to balanced with only a slight lean towards long exposure. This snapshot reflects open USD/JPY CFD positions on the Capital.com platform and may shift as traders respond to intraday news, data releases and market moves.
Summary – USD/JPY 2025
- USD/JPY has traded mostly between the low-140s and high-150s during 2025, with early December closes around 155–156.
- The pair has generally moved higher through the year, rising from the low-140s in April towards the mid-150s by December as macroeconomic expectations evolved.
- Technical indicators show price holding above longer-dated moving averages for much of 2025, with the 100- and 200-day SMAs clustered between the high-140s and low-150s.
- Intraday ranges have been relatively contained recently, with daily highs and lows often within 1–1.5 yen of the close.
- Client sentiment remains close to balanced, with a slight bias towards buyers.
Past performance is not a reliable indicator of future results and does not guarantee how USD/JPY will behave in future periods.
FAQ
What is the US dollar/Japanese yen forecast?
Publicly available forecasts for USD/JPY vary, reflecting different assumptions about interest-rate paths, central-bank communication and political developments in both the US and Japan. Recent projections place the pair anywhere from the high-140s to around 160 through late 2025 and into 2026. Many institutions emphasise the interaction between expected Federal Reserve easing, the Bank of Japan’s gradual shift away from ultra-loose policy and broader macroeconomic conditions.
These views are indicative only and may change as new data or policy signals emerge.Past performance and third-party forecasts aren’t reliable indicators of future results.
Why has USD/JPY been rising or falling?
USD/JPY often responds to changes in expectations for interest rates, inflation and economic growth in both economies. The pair can move higher when US yields rise or when investors anticipate comparatively looser policy in Japan. It may move lower when the US dollar weakens, US yields fall or when markets expect the Bank of Japan to take a more assertive stance.
Short-term fluctuations can also reflect wider shifts in risk sentiment, geopolitical developments and changes in market positioning. These drivers rarely act in isolation, meaning price direction can adjust quickly as conditions evolve.
Could USD/JPY go up or down?
USD/JPY can move in either direction depending on how economic data, central-bank communication and broader sentiment develop. Downward pressure may emerge if the US dollar softens, US data weakens or if the Bank of Japan signals tighter policy. Upward moves may occur if dollar demand strengthens, US yields rise or if Japanese monetary policy remains accommodative.
Because these factors are uncertain and can change at short notice, it’s useful to consider several possible scenarios rather than rely on a single directional expectation.
How can I trade USD/JPY CFDs with Capital.com?
You can trade USD/JPY CFDs with Capital.com using a user-friendly platform that offers live pricing, customisable charts and in-platform news. Contracts for difference (CFDs) let you speculate on price movements in either direction without owning the underlying currencies. However, CFDs are traded on margin, and leverage means both potential profits and losses are magnified. This can result in rapid losses if the market moves against your position. Before trading, ensure you understand how CFDs work and consider using risk-management tools such as stop-losses where appropriate.*
*Standard stop-loss orders are not guaranteed. Guaranteed stop-loss orders (GSLOs) incur a fee if activated.