EUR/JPY forecast: Latest PMI & CPI release
EUR/JPY represents the exchange rate between the euro and the Japanese yen, reflecting relative economic performance, central bank policy expectations and shifts in global capital flows. Explore third-party EUR/JPY forecasts and technical analysis.
Euro–Japanese yen (EUR/JPY) is quoted around 182.569 as of 11:12am (UTC) on 20 February 2026, trading within an intraday range of 182.082–183.039. The cross is holding close to the European Central Bank’s latest euro reference rate for the yen, which stood near 182.05 JPY per EUR on 19 February 2026. Past performance is not a reliable indicator of future results.
The latest flash Eurozone composite PMI for February printed above both forecasts and the prior reading (Reuters, 20 February 2026), while Japan’s national CPI has eased to its slowest pace since early 2022 (MarketScreener, 20 February 2026). This combination has prompted some market participants to reassess the timing and extent of potential BoJ tightening, contributing to a softer yen tone.
EUR/JPY forecast 2026–2030: Analyst price target view
As of 20 February 2026, third-party euro Japanese yen predictions outline a mix of bullish and corrective technical scenarios, with levels clustered around recent trading near 182–185 and mapped against Fibonacci retracements, moving averages, and prior highs. Across these notes, analysts frame targets as conditional paths rather than firm projections, linking them to incoming Eurozone data, Japanese inflation, and the timing of potential Bank of Japan rate moves.
ING Think (quarterly projections)
ING Think sets forecasts for EUR/JPY at 184 in Q1 and Q2 2026, edging to 185 in Q3 and Q4 2026, before moderating to 177 in 2027. This profile implies a relatively stable trajectory through 2026, followed by a projected pullback the following year, based on ING’s macro assumptions for Japan and the broader G10 currency complex. As with other institutional forecasts, these figures reflect scenario-based modelling and remain sensitive to changes in interest-rate differentials, inflation trends, and global risk conditions (ING Think, 20 February 2026).
DailyForex (trend and levels)
DailyForex notes that EUR/JPY is ‘hanging around the 185 yen level’, describing the market as trading within a broader uptrend and holding above its 50-day EMA, with pullbacks characterised as temporary retracements within that structure. The analysis references interest-rate differentials that favour the euro over the yen and identifies potential support zones around 182 and 180. It also highlights the upcoming European Central Bank rate decision as a potential catalyst for volatility, noting that policy surprises could either disrupt the prevailing trend or reinforce it, depending on the outcome (DailyForex, 5 February 2026).
Economies.com (intraday bullish scenario)
Economies.com states that EUR/JPY ‘keeps the positivity’, after reaching 183.15 and consolidating near 182.35. The bullish scenario is described as valid while support at 180.80 holds. The analysis references continued positive signals from technical indicators and suggests that maintaining trade above 180.80 could open the way towards 183.40 and the 61.8% Fibonacci correction level at 184.05, while noting that broader sentiment conditions remain relevant (Economies.com, 20 February 2026).
Predictions and third-party forecasts are inherently uncertain, as they cannot fully account for unexpected market developments. Past performance is not a reliable indicator of future results.
Euro–Turkish lira: Technical overview
One the daily chart, EUR/JPY trades around 182.569 as of 11:12am (UTC) on 20 February 2026, with price oscillating just below a broad moving-average band defined by the 20-, 50-, 100- and 200-day SMAs at roughly 183, 184, 181 and 176. The same-period EMAs cluster nearby, with the 100-day EMA near 180.7 and the 200-day EMA around 176.5. This configuration leaves the longer-term trend structure intact, even as shorter-dated averages lean softer.
The 14-day RSI sits near 46, in neutral territory, while an ADX reading around 20 indicates a modest, non-directional trend backdrop rather than a strong impulse in either direction.
On the topside, the nearest classic pivot resistance stands at R1 around 186.3; a daily close above this level would place R2 near 189.1 into focus as the next reference area. On the downside, the classic pivot at 184.0 remains an overhead marker, while the 100-day SMA near 181.0 forms an initial moving-average shelf. A sustained move below this zone could expose S1 near 181.2 if selling pressure builds (TradingView, 20 February 2026).
This technical analysis is provided for informational purposes only and does not constitute financial advice or a recommendation to buy or sell any instrument.
EUR/JPY history (2024–2026)
Over the two years to 20 February 2026, EUR/JPY has trended higher from the mid-150s to the low-180s, advancing in stages rather than in a straight line. The pair spent much of early 2024 consolidating around 160–165, then moved into the high-160s and low-170s through mid-2024 before pushing above 170 during the summer and closing 2024 near 163–165.
By mid-2025, EUR/JPY was trading around 165–170. A subsequent leg higher produced prices in the high-160s to low-170s during the second half of the year, before the pair finished near 184.
So far in 2026, daily prices have mostly remained within a relatively tight 181–186 band. EUR/JPY traded around 182.58 on 20 February 2026 after briefly moving above 186 earlier in the month. Overall, the cross stands noticeably higher than it did two years ago, while still exhibiting short-term volatility within broader ranges.
Past performance is not a reliable indicator of future results. Share prices are indicative and may differ from live market prices.
Capital.com analyst view
Euro–Japanese yen has climbed steadily over the past two years, moving from the mid-150s to the low-180s by 20 February 2026. Price action has developed through stepwise advances and consolidation phases rather than extended one-way moves. This structure may attract traders who focus on medium- to longer-term trends and range dynamics, yet it also leaves room for abrupt short-term swings as markets respond to data releases, central bank communication, or changes in risk sentiment.
Relative interest rate expectations between the European Central Bank and the Bank of Japan remain a frequently cited driver. For example, higher European yields or softer Japanese inflation can coincide with a firmer cross, while a more hawkish BoJ stance or weaker Eurozone data could weigh on EUR/JPY. Broader risk appetite also plays a role: periods of stronger demand for risk-sensitive assets often align with yen weakness, whereas renewed risk aversion can see the yen appreciate as a perceived haven. These relationships are not fixed and can shift as macroeconomic conditions evolve.
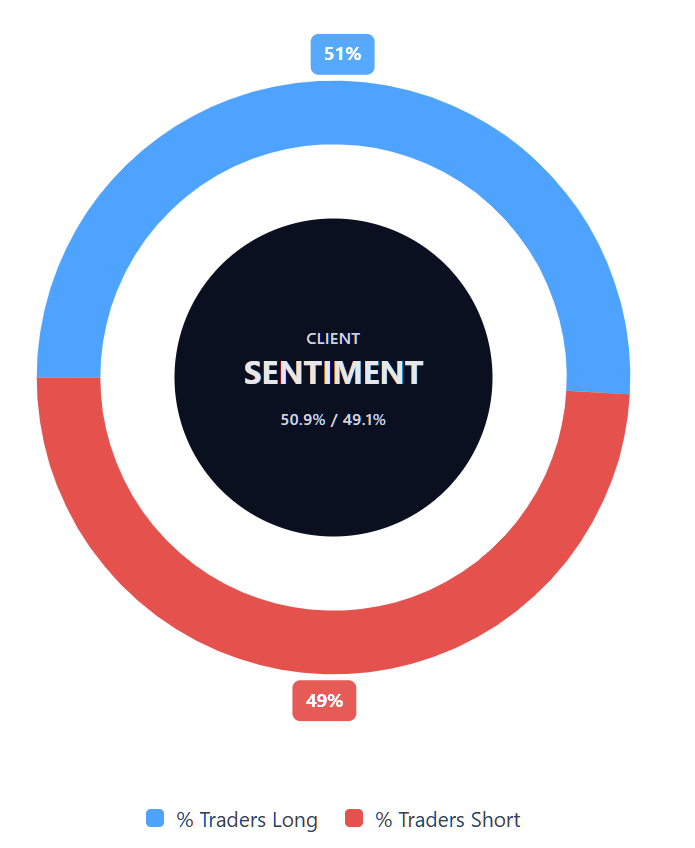
Capital.com’s client sentiment for EUR/JPY CFDs
As of 20 February 2026, Capital.com client positioning in EUR/JPY CFDs shows 50.9% buyers versus 49.1% sellers, leaving sentiment broadly balanced with buyers ahead by around 1.9 percentage points. This snapshot reflects open positions on Capital.com and may change as market conditions develop.
Summary – EUR/JPY 2026
- As of 11:12am UTC on 20 February 2026, EUR/JPY trades near 182.57, within an intraday range of 182.08–183.04 on Capital.com’s feed.
- Daily technical indicators place price close to key short- and medium-term moving averages, with a neutral 14-day RSI and no firmly established directional trend.
- Macro influences include relative ECB–BoJ rate expectations and shifts in global risk appetite, which can either support the euro against the yen or, in a risk-off or more hawkish BoJ scenario, favour yen strength.
- Third-party technical forecasters in February 2026 generally identify support zones around 181–183 and outline upside scenarios towards prior highs in the mid-180 area, while emphasising that projections remain sensitive to economic data and central bank developments.
Past performance is not a reliable indicator of future results.
FAQ
What is the euro–Japanese yen forecast?
The euro–Japanese yen forecast reflects a range of third-party technical and macroeconomic scenarios rather than a single outcome. In February 2026, analysts generally highlighted support zones around 181–183 and referenced upside levels near prior highs in the mid-180s, while stressing that projections remain conditional. Expectations for European Central Bank (ECB) and Bank of Japan (BoJ) policy, alongside incoming economic data, continue to shape how forecasters frame potential price paths.
What influences EUR/JPY movements?
EUR/JPY movements typically respond to relative interest rate expectations between the ECB and the BoJ, as well as broader risk sentiment. Stronger Eurozone data or softer Japanese inflation can coincide with euro strength against the yen, while a more hawkish BoJ policy stance or weaker European indicators may weigh on the pair. Global market conditions, including shifts between risk-on and risk-off environments, can also influence demand for the yen, which some participants view as a relative haven during periods of uncertainty.
Could EUR/JPY go up or down?
EUR/JPY can move in either direction, depending on how macroeconomic and technical factors evolve. If markets anticipate relatively tighter policy from the ECB compared with the BoJ, or if risk appetite improves, the cross may find support. Conversely, indications of firmer Japanese policy tightening or rising global uncertainty could strengthen the yen and pressure the pair. As with all currency pairs, price action remains sensitive to economic data releases, central bank communication, and shifts in market positioning.
Can I trade EUR/JPY CFDs on Capital.com?
Yes, you can trade EUR/JPY CFDs on Capital.com. Trading forex CFDs lets you speculate on price movements without owning the underlying currencies, and to take long or short positions. However, contracts for difference (CFDs) are traded on margin, and leverage amplifies both profits and losses. You should ensure you understand how CFD trading works, assess your risk tolerance, and recognise that losses can occur quickly.