Alegeți un broker cu o bază solidă
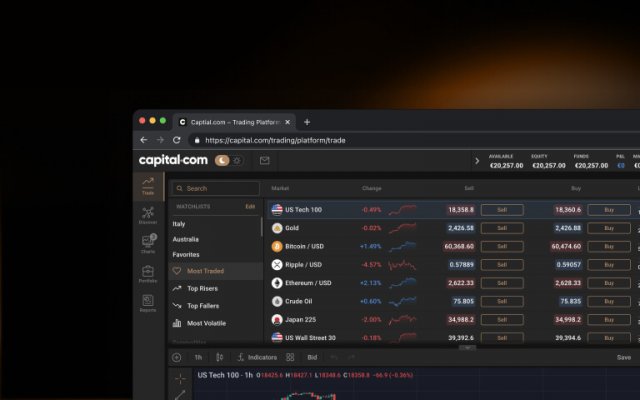
Traderi, știm că securitatea este importantă pentru voi. Alăturați-vă unui broker cu un volum tranzacționat de peste 1 trilion $1, fiind siguri că banii dvs. sunt protejați la bănci de top.
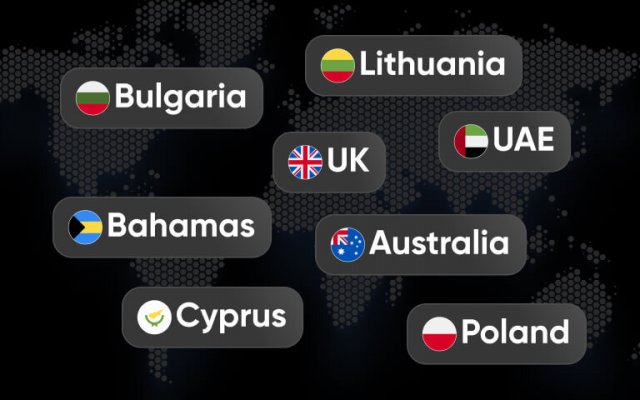
Autorizat și reglementat de Comisia pentru valori mobiliare și burse din Cipru (CySEC)