Ripple price prediction: OCC rule changes, CLARITY markup
XRP is Ripple’s native token, with price action in early April 2026 shaped by Ripple’s OCC trust bank approval process, the pending CLARITY Act markup and broader crypto market pressure. Past performance is not a reliable indicator of future results. Explore third-party XRP price targets.
Ripple (XRP/USD) is trading at $1.3083 in early European trading at 10:29am UTC on 2 April 2026, within an intraday range of $1.3081–$1.3653. Past performance is not a reliable indicator of future results.
Price action reflects several converging drivers. The OCC's revised national trust bank rules, which officially took effect on 1 April 2026, expand the authority of national trust bank charter holders, including Ripple, to conduct non-fiduciary digital asset activities within the US banking system (CoinGape, 31 March 2026); Ripple received conditional OCC charter approval in December 2025 and has separately applied for a Federal Reserve master account (Yahoo Finance)
At the legislative level, the US Senate Banking Committee has confirmed a markup window for the CLARITY Act in the second half of April, which could formally classify XRP as a digital commodity under federal law, though the bill remains subject to ongoing Senate negotiations over stablecoin yield provisions (24/7 Wall St., 18 March 2026). Meanwhile, broader crypto market sentiment has been under pressure following President Trump's reimposition of a 15% global tariff in February 2026 (CNBC, 22 February 2026), which weighed on risk assets, including digital currencies, and contributed to XRP's multi-month drawdown from its January 2026 peak of approximately $2.40 (CoinEdition, 31 March 2026).
Ripple price prediction 2026-2030: Analyst price target view
As of 2 April 2026, third-party XRP price predictions range from near-term consolidation around $1.31–$1.52 to longer-dated institutional projections above $2.80, with diverging assumptions around ETF inflows, the CLARITY Act timeline and broader macro conditions.
CoinCodex (algorithm-based monthly and year-end targets)
CoinCodex models XRP trading within a $1.31–$1.52 range across April 2026, with an average monthly price of $1.39, before projecting a year-end 2026 level of $1.65; the 50-day simple moving average sits at $1.42 and the 14-day RSI registers 42.24 (neutral) as of 1 April 2026. The model flags a bearish technical configuration, with 25 of 31 indicators signalling sell conditions, citing sustained price weakness below the 200-day SMA of $2.08 as the primary structural constraint (CoinCodex, 1 April 2026).
Coinpedia (April 2026 range and breakout scenario)
Coinpedia places XRP in a $1.30–$1.50 consolidation band for April 2026, with a confirmed close above $1.50 opening a path towards $1.70–$1.80 and a failure to hold $1.25 support risking a slide towards $1.10–$1.15. The publication notes that rising exchange outflows indicate distributed accumulation, while inconsistent spot ETF flows suggest that larger market participants are awaiting directional confirmation before adding exposure (Coinpedia, 30 March 2026).
Standard Chartered (revised institutional year-end target)
Standard Chartered, via analyst Geoffrey Kendrick, cut its 2026 XRP year-end target to $2.80, down from a prior $8, after XRP fell to $1.16 in February 2026, while simultaneously lifting its 2028 target to $12.60 and maintaining its 2030 target at $28. Kendrick noted that a recovery in ETF inflows, cited at roughly $200 million per week, alongside easier macro conditions, would be required to support the revised figure (Yahoo Finance, 29 March 2026).
Coinpedia (full-year 2026 model range)
Coinpedia's long-range model sets a 2026 potential low of $3.40, an average of $6.50, and a potential high of $9.50, conditional on Ripple sustaining institutional partnership growth and XRP reclaiming the $2 level as support before a broader market expansion takes hold. The model treats the $1.30–$1.40 zone as the current critical demand floor, with a breakdown below it representing the key downside risk to the broader scenario (Coinpedia, 25 March 2026).
CCN (April 2026 technical and legislative catalyst view)
CCN reports that XRP's technical structure is approaching a potential inflection point in April 2026, with the CLARITY Act Senate Banking Committee markup, scheduled for the second half of April, cited as a near-term legislative variable that could shift positioning, while noting that price action remains compressed in the absence of a confirmed breakout above the $1.45–$1.50 resistance band (CCN, 31 March 2026).
Predictions and third-party forecasts are inherently uncertain, as they cannot fully account for unexpected market developments. Past performance is not a reliable indicator of future results.
XRP price: Technical overview
The XRP/USD price trades at $1.3083 as of 10:29am UTC on 2 April 2026, sitting below a densely stacked moving average shelf where the 20/50/100/200-day SMAs align at $1.40 / $1.40 / $1.63 / $2.02, all of which register sell signals on TradingView's daily reading. The Hull moving average (9) at $1.33 also prints a sell signal, consistent with the prevailing short-term tone.
Momentum is subdued. The 14-day RSI registers 38.45, in lower-neutral territory and short of the oversold threshold, while the average directional index (14) reads 13.05, indicating a weak and largely non-trending environment according to TradingView's oscillator panel.
The classic pivot point sits at $1.41, which represents the nearest overhead reference. A daily close above that level would put the R1 pivot at $1.53 in view, with R2 at $1.73 as the next broader reference beyond it.
On the downside, S1 at $1.22 is the first notable support reference below the current price, with S2 at $1.10 the next level in the classical pivot framework should that level give way (TradingView, 2 April 2026).
This is technical analysis for informational purposes only and does not constitute financial advice or a recommendation to buy or sell any instrument.
Ripple price history (2024–2026)
XRP/USD’s price was trading in the $0.47–$0.63 range through most of April 2024, a period of relative quiet that gave little indication of what was ahead.
That changed sharply in November 2024. XRP closed at $0.70 on 13 November 2024, then surged to $1.13 within three days – a move of roughly 60% in under a week – driven by momentum across the broader crypto market following the US election result. The rally continued into early 2025, with XRP touching a close of $3.04 on 31 January 2025, briefly trading above $3.40 intraday that same month.
After pulling back through spring 2025, XRP regained momentum into the summer, reaching its two-year closing high of $3.56 on 22 July 2025 before fading again through August and into a choppy autumn. By the end of 2025, XRP had settled at $1.84, closing a turbulent year well off its highs.
2026 opened with a short-lived bounce towards $2.31 in early January, but selling pressure returned through the first quarter. XRP closed at $1.31 on 2 April 2026, approximately 30.1% down year to date and 35.2% lower year on year.
Past performance is not a reliable indicator of future results. Share prices are indicative and may differ from live market prices.
Capital.com analyst view: Ripple
XRP's price trajectory since late 2024 has been marked by sharp swings in both directions. The November 2024 surge from below $0.70 to above $3 within weeks reflected a rapid repricing of sentiment around US crypto regulation, with Ripple's partial legal resolution and renewed institutional interest acting as catalysts. However, that pace of ascent also highlights the fragility of momentum-driven moves. XRP shed more than half its value from its July 2025 peak of $3.56 to its current level near $1.31, underscoring how quickly supportive factors can reverse.
On the fundamental side, the OCC's updated national trust bank rules and the pending CLARITY Act markup represent concrete regulatory developments that could reduce uncertainty for XRP over time; however, legislative timelines are unpredictable, and any delay or dilution of those measures could weigh on sentiment. Broader macro conditions, including tariff-driven risk-off pressure, add another layer of complexity, as that same macro environment could also shift if conditions ease.
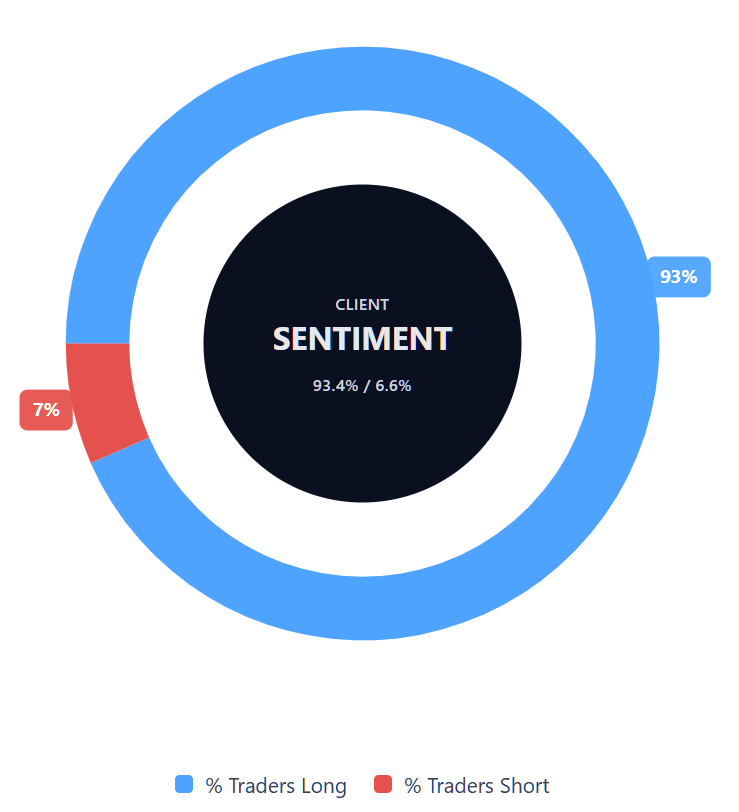
Capital.com’s client sentiment for Ripple CFDs
As of 2 April 2026, Capital.com client positioning in Ripple CFDs shows 93.4% buyers and 6.6% sellers, putting buyers ahead by 86.8 percentage points and placing sentiment firmly in one-sided long territory. This snapshot reflects open positions on Capital.com and can change.
Summary – Ripple (2026)
- XRP trades at $1.3083 as of 10:29am UTC on 2 April 2026, down approximately 30.1% year to date and 35.2% year on year. Technical indicators are broadly bearish: all major moving averages sit above the current price, the 14-day RSI reads 38.45 in lower-neutral territory, and the average directional index at 13.05 indicates a weak, non-trending environment.
- Classic pivot resistance sits at $1.41, with the R1 resistance level at $1.53; S1 at $1.22 represents the first notable downside reference below the current price.
- Key price drivers include the OCC's updated national trust bank rules, effective 1 April 2026, the pending CLARITY Act Senate markup, and ongoing macro headwinds from US tariff policy weighing on risk assets.
Past performance is not a reliable indicator of future results.
FAQ
What is the latest Ripple crypto price prediction?
Who owns the most Ripple?
Ripple, the company closely associated with XRP, has historically been the largest holder of XRP because a substantial share of the token supply was allocated to it at launch. However, ownership changes over time as tokens are sold, released from escrow or redistributed across the market. Large holdings are also associated with founders, exchanges and institutional custodians. Exact rankings can shift, so ownership concentration should be treated as dynamic rather than fixed.
How many Ripple coins are there?
XRP has a maximum supply of 100 billion tokens, created when the network launched. That does not mean all tokens circulate freely in the market at the same time. Some remain locked in escrow, while others are held by Ripple, institutions, exchanges or individual wallets. As a result, traders often distinguish between total supply and circulating supply. This matters because available supply can affect liquidity, market behaviour and how price moves are interpreted.
Could Ripple’s price go up or down?
Should I invest in Ripple?
Whether XRP is suitable for you depends on your objectives, risk tolerance, time horizon and understanding of the market. This article is for information only and does not provide investment advice or a recommendation. XRP has shown significant price volatility, and both gains and losses can be substantial. Before making any decision, it’s important to assess the risks, understand how the asset works, and consider whether speculative crypto exposure fits your broader financial circumstances.
Can I trade Ripple CFDs on Capital.com?
Yes, you can trade Ripple CFDs on Capital.com. Trading crypto CFDs lets you speculate on price movements without owning the underlying asset and to take long or short positions. However, contracts for difference (CFDs) are traded on margin, and leverage amplifies both profits and losses. You should ensure you understand how CFD trading works, assess your risk tolerance, and recognise that losses can occur quickly.