XPeng stock forecast: Third-party price targets
XPeng is a China-based electric vehicle manufacturer listed in Hong Kong, with its share price influenced by company performance, sector trends, and broader market conditions. Explore third-party 9868 price targets and technical analysis.
XPeng, Inc. (9868) was trading around $66.80 HKD as of 9:52am UTC on 3 February 2026, near the top of its intraday range between $64.65 HKD and $66.90 HKD. Past performance is not a reliable indicator of future results.
The stock is moving amid continued focus on China’s electric vehicle sector, where industry associations expect slower growth in new-energy vehicle sales in 2026 as domestic subsidies fade, even as overall volumes remain elevated (Bloomberg, 9 January 2026). More broadly, Hong Kong equities have experienced periodic volatility, with the Hang Seng Index pulling back from multi-year highs (Bloomberg, 3 February 2026).
XPeng stock forecast 2026–2030: Third-party price targets
As of 3 February 2026, third-party XPeng stock predictions reflect a wide range of expectations for the stock over the coming 12 months. These forecasts, expressed in HKD, are typically based on assumptions around deliveries, margins, and competitive dynamics within China’s electric vehicle market.
Investing.com (consensus snapshot)
Investing.com’s 9868 stock forecast consensus shows that, according to projections from 29 analysts (covering the prior three months), the average 12-month price target for the Hong Kong-listed shares stands at around $113.33 HKD. Estimates range from a high of $200.78 HKD to a low of $75.35 HKD, alongside what it describes as a broadly ‘Buy’-tilted analyst stance (Investing.com, 3 February 2026).
TradingView (analyst forecast summary)
TradingView’s forecast page for XPeng Inc. Class A (9868) indicates that 19 analysts providing one-year forecasts reported a mean price target of around $115.20 HKD, with estimates ranging between $82 HKD and $195 HKD. These targets are presented alongside earnings and revenue projections for 2026, within a ratings distribution that TradingView characterises as predominantly ‘Strong buy’ (TradingView, 3 February 2026).
Fintel (target range overview)
Fintel’s coverage of XPeng Inc. (9868) shows that the average one-year price target across covering analysts is $107.37 HKD. Individual forecasts span a wide range, from $70.17 HKD at the low end to $202.62 HKD at the high end. Fintel highlights that this dispersion reflects differing assumptions around execution risk and broader sector pressures (Fintel, 31 January 2026).
Predictions and third-party forecasts are inherently uncertain, as they cannot fully account for unexpected market developments. Past performance is not a reliable indicator of future results.
9868 stock price: Technical overview
The 9868 stock price last traded at $66.80 HKD as of 9:52am UTC on 3 February 2026. On the daily chart, price sits below a cluster of moving averages, with the 20-, 50-, 100- and 200-day SMAs grouped around approximately 77 / 77 / 82 / 80 HKD. Against this backdrop, the 14-day RSI near 27.7 remains in lower-neutral territory rather than signalling oversold conditions, while an ADX reading around 17.8 suggests relatively weak trend strength at present.
On the upside, the classic R1 pivot near 80.45 HKD represents an initial area to watch, with R2 around 89.25 HKD only coming into focus if price can secure a sustained daily close above that first resistance zone. On pullbacks, the classic pivot near 75.80 HKD marks initial support. Below this, the 100-day SMA near 82 HKD and the 200-day SMA around 79 HKD form a broader moving-average band, with a sustained break lower potentially opening the way towards the S1 area around 67 HKD (TradingView, 3 February 2026).
This technical analysis is for informational purposes only and does not constitute financial advice or a recommendation to buy or sell any instrument.
XPeng share price history
9868’s stock price has experienced choppy price action into early 2026, with the stock sliding from the low-$80s HKD in late 2025 to the mid-$60s HKD by 3 February 2026. The shares closed 2025 at $79.25 HKD on 31 December and initially pushed higher, reaching $83.35 HKD on 1 December and $84.25 HKD on 28 November, before momentum faded and prices eased back through December into the mid-$70s HKD range.
In January 2026, XPeng briefly returned to the low-$80s HKD, closing at $82.25 HKD on 14 January. Subsequent pullbacks, however, saw the price retreat towards the low-$70s HKD, with a close at $71.85 HKD on 30 January. By 3 February 2026, the shares were trading around $66.80 HKD, leaving the stock below its late-2025 highs but above the intraday low of $64.75 HKD recorded the same day.
Past performance is not a reliable indicator of future results. Share prices are indicative and may differ from live market prices.
XPeng (9868): Capital.com analyst view
XPeng’s Hong Kong-listed shares (9868) have moved from the low-$80s HKD in late 2025 to the mid-$60s HKD area by early February 2026, reflecting a period of uneven, two-way trading rather than a sustained directional trend. This pattern aligns with shifting sentiment across China’s electric vehicle sector, where market participants continue to weigh XPeng’s growth ambitions and technology positioning against competitive intensity, pricing pressure, and broader macro uncertainty. Past performance is not a reliable indicator of future results.
From one perspective, stronger delivery momentum, further progress in overseas expansion, or improving risk appetite towards Chinese equities could offer support if confidence in XPeng’s execution and balance-sheet position improves. An alternative scenario is that missed sales targets, tighter funding conditions, or renewed risk-off sentiment towards China-linked assets could add pressure to the shares, particularly if competition intensifies or margins remain constrained.
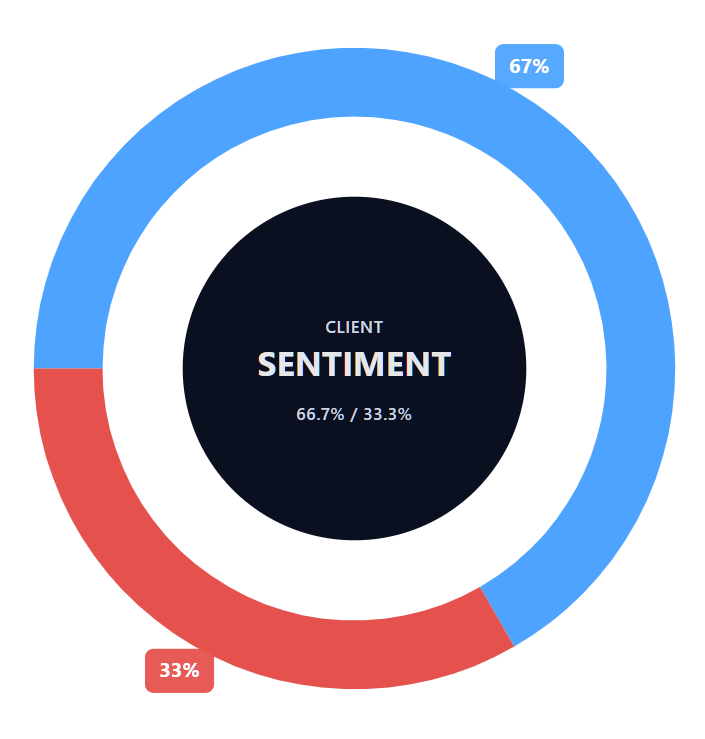
Capital.com’s client sentiment for XPeng CFDs
As of 3 February 2026, Capital.com client positioning in XPeng CFDs currently stands at 66.7% buyers versus 33.3% sellers. This places sentiment in majority-buy territory, though short of extreme levels, with buyers ahead by roughly 33 percentage points. The data reflects open positions held by Capital.com clients and can change as market conditions and trading activity evolve.
Summary – XPeng 2026
- XPeng (9868) ended 2025 in the upper-$70s HKD, after trading within a broad range that included advances into the low-$80s HKD and pullbacks towards the low-$70s HKD.
- Early-2026 price action has remained uneven, with the shares slipping from the low-$80s HKD in mid-January to around $66.80 HKD by 3 February 2026.
- Technical indicators currently show the price trading below a clustered band of medium- and long-term moving averages, with the 14-day RSI in lower-neutral territory and overall trend strength appearing relatively weak.
- XPeng’s share price can be influenced by factors such as Chinese EV demand trends, funding conditions, and overall risk appetite towards China-related equities.
Past performance is not a reliable indicator of future results.
FAQ
Who owns the most XPeng stock?
XPeng’s shareholding structure includes a mix of founders, strategic investors, and institutional shareholders. The company’s founder and senior management hold meaningful stakes, while large global asset managers and investment funds also feature among the major holders through listed shares. Ownership levels can change over time due to share issuance, lock-up expiries, or portfolio rebalancing by institutions, meaning publicly reported data represents a snapshot rather than a fixed or permanent structure.
What is the 5 year XPeng share price forecast?
There is no single, reliable five-year 9868 stock forecast. Most published forecasts focus on shorter horizons, typically around 12 months, while longer-term projections depend heavily on assumptions around EV demand, competition, margins, regulation, and capital requirements. Over multi-year periods, outcomes can diverge materially from earlier estimates, meaning long-term forecasts are best viewed as illustrative rather than predictive and may change as conditions evolve.
Is XPeng a good stock to buy?
Whether XPeng is considered attractive varies by individual circumstances, including risk tolerance and market outlook. Analysts point to potential drivers such as technology development and international expansion, while also highlighting risks linked to competition, pricing pressure, and funding requirements. Share prices can reflect both favourable and adverse developments over time. This information is provided for general market context only and does not constitute investment advice or a recommendation.
Could XPeng stock go up or down?
XPeng’s share price can move in either direction and may be influenced by a range of factors, including vehicle deliveries, cost trends, policy changes, sector sentiment, and broader market conditions. Short-term price movements may also reflect technical factors or shifts in investor positioning. As with any equity, price fluctuations can be significant, and past price behaviour is not a reliable indicator of future performance.
Should I invest in XPeng stock?
Deciding whether to invest in XPeng involves considering personal financial objectives, time horizon, and risk appetite, alongside an understanding of the company and its operating environment. Equity investments can rise or fall in value, and losses are possible. This content does not assess suitability or provide personalised guidance. Individuals may wish to carry out their own research or seek independent financial advice before making any investment decisions.
Can I trade XPeng CFDs on Capital.com?
Yes, you can trade XPeng CFDs on Capital.com. Trading share CFDs lets you speculate on price movements without owning the underlying asset and to take long or short positions. However, contracts for difference (CFDs) are traded on margin, and leverage amplifies both profits and losses. You should ensure you understand how CFD trading works, assess your risk tolerance, and recognise that losses can occur quickly.