GameStop stock forecast: Cohen eyes $8.8bn acquisition move
GameStop is a US-listed video game retailer whose shares are tracking reports that CEO Ryan Cohen is assessing a potential acquisition and the use of its $8.8bn cash reserves. Explore third-party GME price targets and technical analysis.
GameStop Corporation (GME) is trading around $23.94 in Friday’s US session, moving within an intraday range of $23.73–$24.38 as of 4:42pm UTC on 27 February 2026. The price sits close to levels seen in mid-February, when GME was quoted near $23.68 and traded around key moving averages, suggesting relatively contained day-to-day price swings compared with the sharper moves recorded earlier in the month. Past performance is not a reliable indicator of future results. Past performance is not a reliable indicator of future results.
Recent trading continues to track company-specific headlines, including reports that CEO Ryan Cohen is exploring a potential acquisition of a large publicly listed consumer company and considering how to deploy GameStop’s cash reserves of about $8.8bn, as reported at the end of its latest quarter (CNBC, 30 January 2026). The stock also remains sensitive to notable investor activity after Michael Burry disclosed a position in GameStop in late January 2026, while publicly downplaying the likelihood of another large short squeeze (Reuters, 27 January 2026).
GameStop stock forecast 2026–2030: Third-party price targets
As of 27 February 2026, third-party GameStop stock predictions reflect uncertainty around the company’s earnings path, balance-sheet strength and the potential impact of meme-driven volatility. The following forecasts summarise how selected third-party sources frame indicative 12-month or calendar-year price levels for the stock. Predictions and third-party forecasts are frequently inaccurate, as they cannot account for unforeseen market developments.
Public.com (analyst snapshot)
Public.com reports an average 12-month GME stock forecast of $13.50, implying downside from the prevailing market price and an overall Sell rating. The platform adds that analyst coverage remains limited, with the view shaped by concerns over long-term sales trends and the risk that meme-driven rallies may disconnect price from underlying fundamentals (Public.com, 27 February 2026).
Long Forecast (calendar-year projection)
Long Forecast projects that GameStop could end December 2026 around $31.11, having started the year near $22.61 and fluctuated between roughly $19.81 and $33.60 during the period. The service describes these monthly levels as a mechanical extrapolation from historical volatility patterns and trend estimates rather than analyst research, and stresses that long-horizon projections remain highly uncertain (Long Forecast, 14 February 2026).
Intellectia.ai (pattern-correlation model)
Intellectia.ai’s pattern-correlation model forecasts an average GameStop price near $26.37 for December 2026, within an expected range of about $26.27–$26.95 for that month. The provider says this outlook reflects historical correlations between GME and a peer basket, combined with technical signals it characterises as leaning modestly bearish despite positive momentum in some moving-average configurations (Intellectia.ai, 25 February 2026).
Predictions and third-party forecasts are inherently uncertain, as they cannot fully account for unexpected market developments. Past performance is not a reliable indicator of future results.
GME stock price: Technical overview
The GME stock price trades around $23.94 as of 4:42pm UTC on 27 February 2026, near the Classic pivot at 23.02. The 20-, 50-, 100- and 200-day simple moving averages (SMAs) cluster around 24 / 23 / 23 / 24, respectively. The shorter-term 20-day SMA remains above the 50-day SMA, while the 14-day relative strength index (RSI) near 53 sits in neutral territory. An average directional index (ADX) reading around 30 points to an established trend backdrop rather than a purely range-bound environment.
On the topside, traders may monitor the classic R1 pivot near 25.87. A sustained daily close above that area would bring the R2 region around 27.87 into focus as a potential reference zone. On pullbacks, initial support lies near the 23.02 pivot, followed by the 100-day SMA around 22.55 (TradingView, 27 February 2026). A break below that level could expose the S1 area near 21.02 if selling pressure persists.
This technical analysis is provided for informational purposes only and does not constitute financial advice or a recommendation to buy or sell any instrument.
GameStop share price history (2024–2026)
Over the past two years, GME’s stock price has alternated between sharp volatility episodes and more subdued consolidation phases. After trading near $14.30 at the end of February 2024, GME rose into the $60–80 range during the May–June 2024 surge in trading activity, briefly reaching an intraday high above $80 on 14 May. The price then retraced into the low-$20s by late May and ended 2024 around the low-$30s.
During 2025, the stock eased from early-year levels near $30–33, dipping into the low-$20s in April. It later rebounded above $35 in late May before trending lower into the low-$20s by December. By 27 February 2026, GME closed at $23.94, returning to the relatively narrow $20–26 range that has contained much of its trading since late 2025.
Past performance is not a reliable indicator of future results. Share prices are indicative and may differ from live market prices.
GameStop (GME): Capital.com analyst view
As of 4:42pm (UTC) on 27 February 2026, GameStop’s stock price trades well below its 2024 highs, while still reflecting market expectations around the use of its cash position and future business initiatives.
Potential drivers for GME include changes in overall risk appetite, shifts in short interest, and developments in consumer spending or gaming-related demand. Corporate actions, including acquisitions or capital allocation decisions, may also influence sentiment. Positive earnings developments or clearer progress on long-term strategy could support valuations, while weaker-than-expected results, execution risks or broader equity-market weakness could place downward pressure on the share price, particularly given its history of elevated volatility.
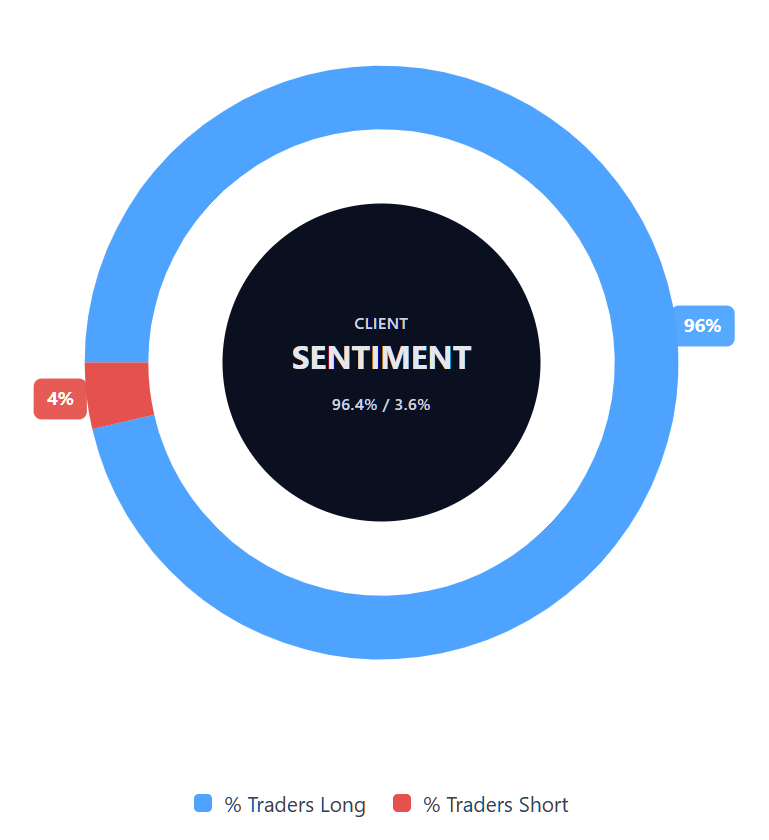
Capital.com’s client sentiment for GameStop CFDs
As of 27 February 2026, Capital.com client positioning in GameStop CFDs shows 96.4% buyers and 3.6% sellers, producing a net long imbalance of 92.8 percentage points. This distribution reflects the proportion of open CFD positions held by Capital.com clients at the time of writing and may change as market conditions evolve.
Summary – GameStop 2026
- As of 4:42pm UTC on 27 February 2026, GameStop trades near $23.94, below its mid-2024 peaks and within a broad $20–30 range that has defined much of the past year.
- Daily moving averages cluster in the low- to mid-$20s, with a 20-over-50 alignment, while the RSI in the mid-50s indicates neutral momentum conditions.
- Key variables include shifts in retail participation, short-interest dynamics, balance-sheet deployment and broader equity-market trends.
- Recent attention has centred on reported acquisition plans, valuation debates and renewed institutional interest, all of which may continue to shape price behaviour alongside earnings releases and macroeconomic developments.
Past performance is not a reliable indicator of future results.
FAQ
Who owns the most GameStop stock?
GameStop’s shareholder base includes a mix of institutional investors, retail traders and company insiders. Large asset managers and index funds often rank among the biggest holders due to passive investment strategies, while individual investors have historically played a visible role in overall trading activity. Ownership levels can change as funds rebalance portfolios or as retail participation shifts over time. Investors can review the latest regulatory filings to access the most recent publicly available breakdown of major shareholders.
What is the 5-year GameStop share price forecast?
There is no single, reliable five-year GME stock forecast. Long-term projections vary widely depending on assumptions about revenue growth, profitability, capital allocation and broader market conditions. As shorter-term analyst targets illustrate, estimates can diverge significantly even over a 12-month period. Over a five-year horizon, uncertainty typically increases, as forecasts cannot fully account for economic cycles, competitive dynamics or unforeseen corporate developments.
Is GameStop a good stock to buy?
Whether GameStop is considered suitable for purchase depends on an individual’s objectives, risk tolerance and investment horizon. The company has experienced periods of elevated volatility, driven by both fundamental developments and retail trading flows. While some market participants focus on its cash position and restructuring efforts, others point to earnings uncertainty and competitive pressures. Any decision to invest or trade should weigh potential returns against the risk of capital loss and align with your broader financial strategy.
Could GameStop stock go up or down?
GameStop’s share price can move in either direction, including over short timeframes. Factors that may influence price action include earnings releases, strategic announcements, changes in short interest, broader equity-market trends and shifts in retail participation. Technical levels and market sentiment may also affect shorter-term fluctuations. Given its history of volatility, price swings can be pronounced, and future outcomes remain uncertain.
Should I invest in GameStop stock?
Deciding whether to invest in GameStop requires careful consideration of your financial circumstances, experience and risk appetite. The stock has shown the capacity for sharp rallies as well as rapid pullbacks. Investors should assess the company’s financial position, competitive environment and longer-term strategy, while recognising that past performance is not a reliable indicator of future results. If you are unsure, you may wish to seek independent financial advice before making investment decisions.
Can I trade GameStop CFDs on Capital.com?
Yes, you can trade GameStop CFDs on Capital.com. Trading share CFDs lets you speculate on price movements without owning the underlying asset and to take long or short positions. However, contracts for difference (CFDs) are traded on margin, and leverage amplifies both profits and losses. You should ensure you understand how CFD trading works, assess your risk tolerance, and recognise that losses can occur quickly.