Xiaomi stock forecast: Annual results, EV focus
Xiaomi is a Hong Kong-listed technology group due to report its 2025 annual results on 24 March 2026, with investors focused on slower Q4 revenue growth and EV segment performance. Past performance is not a reliable indicator of future results. Explore third-party 1810 price targets and technicals.
Xiaomi Corporation (1810) is trading at $32.70 HKD as of 4:07pm UTC on 24 March 2026, within an intraday range of $31.60–$32.86 HKD. Past performance is not a reliable indicator of future results.
Price action comes ahead of Xiaomi's 2025 annual results announcement and investor conference call scheduled for 24 March 2026, with consensus estimates compiled by S&P Global Market Intelligence pointing to Q4 revenue of approximately 118.5 billion CNY, up roughly 9% year on year, a marked deceleration from the 22% growth recorded in Q3 2025, amid expected weakness in the smartphone and IoT/lifestyle segments (Xiaomi, 24 March 2026). The broader Hong Kong equity market also weighed on the session, with the Hang Seng Index trading around 25,063 on 24 March 2026, down from the 25,920 area seen in mid-March, while the index has declined approximately 5.8% over the past month (Yahoo Finance, 14 March 2026).
Xiaomi stock forecast 2026–2030: Third-party price targets
As of 24 March 2026, third-party Xiaomi stock predictions reflect a broadly cautious reset across the street, driven by rising upstream component costs, EV margin uncertainty ahead of the 2025 annual results, and a modest deceleration in smartphone shipment growth expectations.
Goldman Sachs (target cut, Buy maintained)
Goldman Sachs cuts its 12-month 1810 stock forecast to $41 HKD from $47.50 HKD, while retaining a Buy rating. The bank cites rising upstream costs across consumer electronics and automotive supply chains, the gradual phase-out of national EV subsidies, and resulting margin pressure across the smartphone, AIoT, and smart EV divisions as the basis for the revision (Longbridge, 10 March 2026).
Morgan Stanley (smartphone outlook trimmed)
Morgan Stanley cuts its 2026 global smartphone shipment forecast, flagging tariff-related demand disruption and slowing upgrade cycles as key headwinds for handset-exposed names including Xiaomi. The revision implies downside risk to Xiaomi's mobile segment revenue assumptions, with the broker pointing to macro uncertainty in key emerging markets as an additional dampener on unit volumes (AAStocks, 23 March 2026).
Simply Wall St (DCF valuation, undervalued flag)
Simply Wall St applies a two-stage discounted cash flow model to 1810, arriving at an estimated intrinsic value of $51.64 HKD against a closing price of $33.30 HKD, implying a 35.5% discount based on the model's assumptions. The analysis draws on analyst-based free cash flow projections through 2030, anchored to a latest-12-month figure of 43.5 billion CNY, while noting that Xiaomi's P/E of 17.16x sits below the tech industry average of 22.27x (Simply Wall St, 13 March 2026).
Investing.com (analyst consensus, 32 contributors)
Investing.com aggregates 12-month price targets from 32 analysts, with an average target of $67.12 HKD, a high estimate of $80.35 HKD, and a low estimate of $34.18 HKD, as compiled in March 2026. The consensus rating stands at Strong Buy, with 34 analysts recommending a buy, 2 recommending a hold, and 2 recommending a sell, amid expectations centred on EV segment ramp-up, AIoT expansion, and overseas smartphone growth (Investing.com, March 2026).
MarketBeat (earnings-day analyst snapshot)
MarketBeat tracks analyst estimates and ratings in the context of Xiaomi's 2025 annual results announced, noting that the street's forward expectations have been subject to meaningful downward revision over the preceding four weeks as cost headwinds materialised. The snapshot reflects a tightening of the consensus range, with the most recently revised targets clustering in the $37–$45 HKD band among brokers that updated their models in March (MarketBeat, 24 March 2026).
Predictions and third-party forecasts are inherently uncertain, as they cannot fully account for unexpected market developments. Past performance is not a reliable indicator of future results.
1810 stock price: Technical overview
On the daily chart, the 1810 stock price trades at $32.70 HKD as of 4:07pm UTC on 24 March 2026, sitting below every key moving average in TradingView's summary, with the 20/50/100/200-day simple moving averages (SMAs) stacked at approximately $33.76 / $35.20 / $38.20 / $46.23 HKD respectively. Price trades beneath the Hull moving average (9) at $32.84 HKD and the volume weighted moving average (20) at $33.70 HKD, reinforcing the uniformly bearish moving average signal across all tenors. The 20-day SMA sits below the 50-day SMA, so no constructive short-term alignment is in place.
Momentum is subdued but not collapsed: the 14-day relative strength index (RSI) reads 41.92, sitting in neutral territory and pointing to a lack of directional conviction in either direction in the current session. The average directional index (ADX) reading at 14 stands at 16.82, below the conventional 20 threshold, indicating that the prevailing trend lacks statistical strength at this stage.
On the topside, the classic pivot point (P) at $35.24 HKD represents the first overhead reference; a daily close back through that level would put R1 at $37.16 HKD in view, with R2 near $39.42 HKD as the next reference beyond that.
On the downside, the classic S1 at $32.98 HKD sits just above the current print, with S2 at $31.06 HKD as the next meaningful reference if S1 gives way; the Fibonacci support band clusters near $33.64–$32.66 HKD across the S1–S2 zone. Losing S2 would leave the S3 area near $26.88 HKD on the classic pivot framework in focus, though the Camarilla and Woodie models show a tighter near-term floor in the $34.13–$32.11 HKD range (TradingView, 24 March 2026).
This is technical analysis for informational purposes only and does not constitute financial advice or a recommendation to buy or sell any instrument.
Xiaomi share price history (2024–2026)
Xiaomi's 1810 shares listed on the Hong Kong Stock Exchange in July 2018 and have since tracked the company's evolution from a smartphone maker into a diversified technology and electric vehicle group.
Over the past two years, 1810’s stock price traded as low as $14.85 HKD in late March 2024 before staging a substantial recovery. Momentum built steadily through the second and third quarters of 2025, with 1810 reaching a multi-year high of $59.46 HKD on 25 September 2025, lifted by enthusiasm around Xiaomi's EV ramp-up and strong AIoT segment growth. The stock then drifted lower through the final quarter of 2025, closing the year at $39.22 HKD on 31 December 2025.
2026 opened at $40.21 HKD on 2 January, but selling pressure resumed through January and into March, with the stock slipping below its end-2025 level as broader Hang Seng weakness and rising component cost concerns weighed on sentiment. 1810 closed at $32.70 HKD on 24 March 2026, leaving it approximately 18.7% down year to date and 42.7% lower year on year.
Past performance is not a reliable indicator of future results. Share prices are indicative and may differ from live market prices.
Xiaomi (1810): Capital.com analyst view
Xiaomi's 1810 shares delivered a striking recovery through the first three quarters of 2025, climbing from multi-year lows near $14.85 HKD in early 2024 to a peak of $59.46 HKD in September 2025, underpinned by growing confidence in the company's electric vehicle rollout, expanding AIoT ecosystem, and overseas smartphone growth. That said, the rally has since reversed sharply, with the stock shedding roughly 45% from its September high to trade near $32.70 HKD as of 24 March 2026, as rising upstream component costs, the phasing out of EV subsidies, and a broader Hang Seng correction have weighed on sentiment.
Looking at the current landscape, Xiaomi's forthcoming 2025 annual results represent a potential catalyst in either direction: stronger-than-expected EV profitability or AIoT margins could support a reappraisal of the stock's valuation, while further evidence of smartphone margin compression or slowing unit growth could sustain selling pressure. The wide spread between the lowest and highest analyst price targets, from approximately $30.45 HKD to $80.35 HKD, reflects uncertainty over how these competing forces may develop.
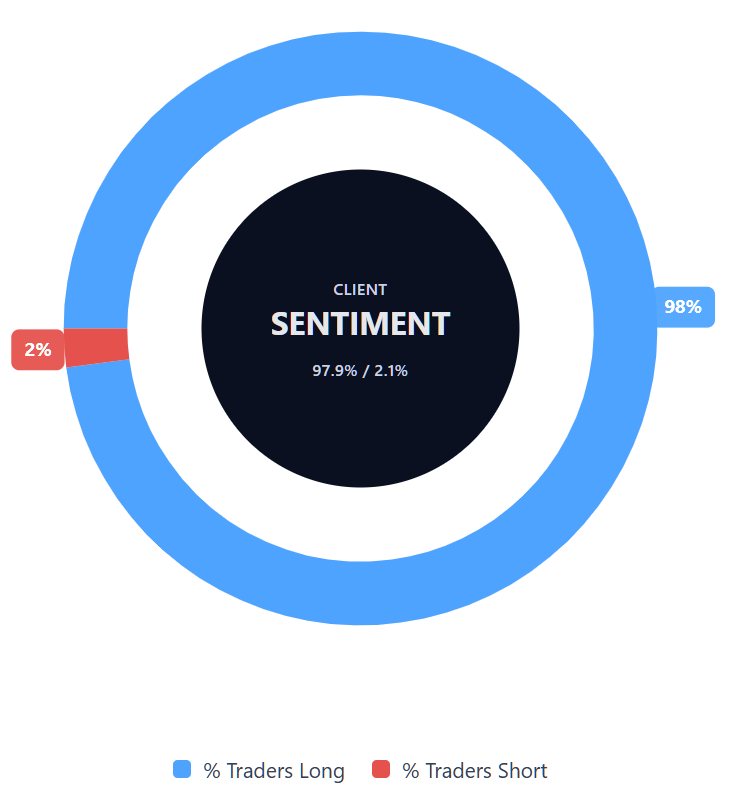
Capital.com’s client sentiment for Xiaomi CFDs
As of 24 March 2026, Capital.com client positioning in Xiaomi CFDs is skewed toward longs: 97.9% buyers vs 2.1% sellers, putting buyers ahead by 95.8 percentage points and placing sentiment firmly in one-sided territory toward longs. This snapshot reflects open positions on Capital.com and can change.
Summary – Xiaomi 2026
- Xiaomi (1810) trades at $32.70 HKD as of 4:07pm UTC on 24 March 2026, down 18.7% year to date and 42.7% year on year.
- The 14-day RSI reads 41.92 (neutral) and the ADX at 16.82 indicates a weak, directionless trend in the current session.
- Classic pivot support sits at $35.24 HKD, with S1 at $32.98 HKD just above the current print; R1 resistance stands at $37.16 HKD.
- Key drivers include rising upstream storage and component costs weighing on smartphone margins, EV subsidy phase-out, and a broader Hang Seng decline in March 2026.
- Xiaomi announced its 2025 annual results on 24 March 2026, with analysts expecting Q4 net profit of approximately 6.41 billion CNY, below prior-quarter levels.
Past performance is not a reliable indicator of future results.
FAQ
Who owns the most Xiaomi stock?
What is the 5 year Xiaomi share price forecast?
Is Xiaomi a good stock to buy?
Could Xiaomi stock go up or down?
Should I invest in Xiaomi stock?
Can I trade Xiaomi CFDs on Capital.com?
Yes, you can trade Xiaomi CFDs on Capital.com. Trading share CFDs lets you speculate on price movements without owning the underlying asset and to take long or short positions. However, contracts for difference (CFDs) are traded on margin, and leverage amplifies both profits and losses. You should ensure you understand how CFD trading works, assess your risk tolerance, and recognise that losses can occur quickly.