Uniswap price prediction: Third-party outlook
Uniswap is a decentralised exchange protocol on the Ethereum blockchain, with its UNI token used for governance and influenced by protocol activity and wider crypto market conditions. Explore third-party UNI price targets and technical analysis.
Uniswap (UNI/USD) is trading around $3.54 against the US dollar as of 9:40am on 16 February 2026 (UTC), holding within an intraday range of $3.40-3.67 on Capital.com’s feed. The move follows recent daily fluctuations between roughly $3.47 and $3.58, keeping the token close to levels seen over the past few sessions. Past performance is not a reliable indicator of future results.
Price action is unfolding amid elevated on-chain activity for the Uniswap protocol. Recent reports highlight a 24-hour spot trading volume spike to about $13.4bn and a related UNI price jump earlier in February (AInvest, 12 February 2026). At the same time, broader crypto sentiment remains fragile after sharp drawdowns in major assets such as bitcoin, with risk appetite still sensitive to flows and liquidity conditions across digital asset markets (Forbes, 16 February 2026).
Uniswap price prediction 2026-2030: Analyst price target view
As of 16 February 2026, third-party UNI price predictions reflect differing assumptions about technical conditions, macroeconomic data and overall crypto sentiment. These projections rely on varied methodologies – including volatility-based modelling, resistance-band mapping and scenario analysis – and they should be viewed as illustrative scenarios rather than predictions of future performance.
Changelly (short-term model path)
Changelly states in its Uniswap price prediction update that its near-term UNI forecast envisages a minimum of $3.56, an average around $3.65 and a maximum near $3.74 for February 2026, with a stepwise path into the $3.90-$4.20 area in early March. The platform says it derives this path from historical volatility, recent trend behaviour and sentiment gauges such as an ‘Extreme Fear’ reading on its index, within what it characterises as a fragile market environment (Changelly, 17 February 2026).
CoinGape (price range view)
CoinGape’s February 2026 UNI outlook outlines a scenario in which the token ‘could rise to a new high’ near $6.05 for the month, while a corrective phase might see prices gravitate towards roughly $6.02. The article links this range to expectations of firmer crypto risk appetite following January’s recovery, while also noting that macro uncertainty and sector-specific developments could generate renewed pressure (CoinGape, 15 February 2026).
Mitrade (macro-linked rebound narrative)
Mitrade highlights that Uniswap rose by more than 7% intraday after US January CPI data came in softer than expected, and places that move within a broader rebound narrative. The broker states that its analysts see scope for further gains if inflation continues to ease and rate-cut expectations support risk assets. At the same time, it points out that UNI futures open interest has cooled and that liquidity conditions remain a key factor for any sustained follow-through (Mitrade, 13 February 2026).
Predictions and third-party forecasts are inherently uncertain, as they cannot fully account for unexpected market developments. Past performance is not a reliable indicator of future results.
UNI price: Technical overview
The UNI price is trading around $3.54 as of 9:40am on 16 February 2026 (UTC), holding just above its short-term moving average band, with the 10-day simple moving average (SMA) near 3.45 and the 20-day SMA closer to 3.70. The broader backdrop remains skewed lower on a longer-term view, as the 50-, 100- and 200-day SMAs cluster higher at approximately 4.73, 5.46 and 6.96 respectively, leaving price below key medium- and long-term trend markers.
The 14-day relative strength index (RSI) sits near 39, in lower-neutral territory, while the average directional index (ADX) around 36 suggests an established trend rather than range-bound conditions. On the upside, the first classic pivot level to monitor is R1 near 5.73, with R2 around 7.51 only coming into focus on a sustained daily close above that area. On pullbacks, the classic pivot at 4.67 provides an initial reference point. A sustained move below nearby support zones could bring the S1 area near 2.89 into consideration (TradingView, 16 February 2026).
This technical analysis is provided for informational purposes only and does not constitute financial advice or a recommendation to buy or sell any instrument.
Uniswap price history (2024–2026)
The UNI price has undergone a marked repricing over the past two years, moving from double-digit levels in early 2024 and 2025 to single digits by late 2025, and into the mid-$3 area by mid-February 2026. The token closed 2024 at about $13.25 on 31 December, after peaking above $17 in mid-December 2024 and trading around $15-16 in early January 2025.
By late January 2025, UNI was still changing hands near $12-13. The tone then shifted, with price moving below $10 in late February 2025 and subsequently trading in the $6-8 zone during the middle of the year.
Volatility increased again into the second half of 2025. UNI traded around $11-12 in August 2025 before trending lower towards $6 by year-end. The decline extended into early 2026, with the token moving from about $6.05 on 2 January 2026 to close near $3.56 on 16 February 2026.
Past performance is not a reliable indicator of future results. Share prices are indicative and may differ from live market prices.
Capital.com analyst view: Uniswap
Uniswap’s UNI token has retreated in early 2026, trading around $3.54 on 16 February and remaining well below the double-digit levels observed through much of 2024 and early 2025. Recent on-chain metrics and news flow present a mixed picture. The protocol has recorded episodes of elevated trading activity and announced collaborations, which may influence participation and fee dynamics. However, the broader environment reflects a wider crypto drawdown and tighter liquidity conditions across several altcoins.
From a drivers perspective, structural developments such as the activation of Uniswap’s ‘fee switch’ and partnerships linked to tokenised assets have been cited as factors that could strengthen the relationship between protocol usage, fee generation and the UNI token. At the same time, greater institutional involvement and fee-linked token structures may increase sensitivity to macroeconomic developments, regulatory changes and shifts in overall risk appetite. These factors can amplify both upside and downside price movements. Past performance is not a reliable indicator of future results.
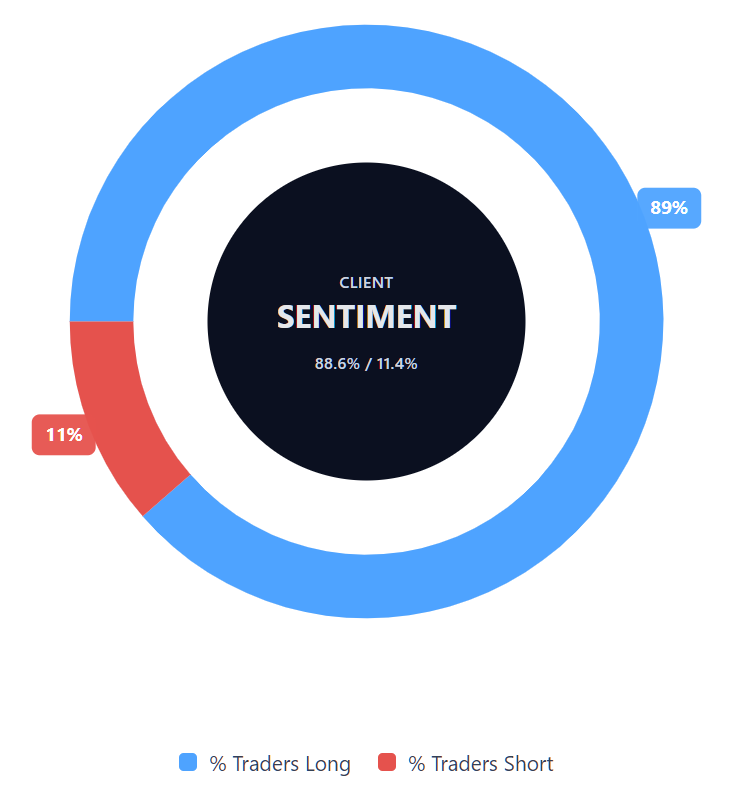
Capital.com’s client sentiment for Uniswap CFDs
As of 16 February 2026, Capital.com client positioning in Uniswap CFDs currently shows 88.6% of clients holding long positions, compared with 11.4% holding short positions, leaving buyers ahead by 77.2 percentage points. This distribution indicates a pronounced long skew in open positions at the time of writing.
This data reflects open CFD positions on Capital.com’s platform and can change as market conditions evolve.
Summary – Uniswap (2026)
- Uniswap (UNI) is trading around $3.54 as of 9:40am (UTC) on 16 February 2026, after moving lower from double-digit levels seen during 2024 and early 2025.
- Technical indicators place price below its 50-, 100- and 200-day moving averages, with the 14-day RSI near 39 and ADX around 36, pointing to a downward-skewed trend with lower-neutral momentum.
- Recent third-party coverage references a combination of elevated protocol volumes, fee-switch developments and tokenisation initiatives, set against a backdrop of softer liquidity and cautious crypto sentiment.
- UNI remains exposed to macroeconomic conditions, regulatory developments and shifts in digital asset risk appetite, all of which may influence price dynamics in either direction.
Past performance is not a reliable indicator of future results.
FAQ
What is the latest Uniswap crypto price prediction?
Recent third-party forecasts for Uniswap (UNI) in early 2026 outline a broad range of short-term scenarios, generally clustering between the mid-$3 area and the mid-$6 region, depending on methodology and assumptions. Analysts base these projections on technical indicators, volatility models and macroeconomic developments. These estimates reflect scenario analysis rather than confirmed outcomes, and actual price movements may differ materially as market conditions evolve.
Who owns the most Uniswap?
Uniswap is a decentralised protocol, and UNI tokens are distributed across founders, team members, early investors, liquidity providers and public holders. A portion of the supply was allocated to the founding team and venture backers at launch, subject to vesting schedules. On-chain data indicates that several large wallet addresses hold significant balances; however, wallet concentration does not necessarily correspond to single beneficial owners. Holdings can change over time as tokens move between addresses or platforms.
How many Uniswap coins are there?
UNI has a fixed total supply of 1 billion tokens, as defined at launch. The circulating supply remains below the maximum cap and increases gradually in line with the token’s emission schedule and vesting arrangements. Circulating figures can vary depending on unlock events and on-chain transfers. While blockchain explorers allow public verification of supply data, they may not fully capture tokens held in custodial or exchange wallets.
Could Uniswap’s price go up or down?
UNI’s price can move in either direction and often displays elevated volatility. Price dynamics typically reflect a combination of protocol usage, trading volumes, broader crypto market sentiment, macroeconomic developments and regulatory updates. Technical factors, including support and resistance levels, may also influence short-term movements. As with other cryptoassets, rapid price swings are possible, and past performance does not provide a reliable guide to future results.
Should I invest in Uniswap?
Whether to gain exposure to UNI depends on your individual financial situation, objectives and risk tolerance. Cryptoassets are highly volatile and can experience significant price fluctuations over short periods. You should assess the risks carefully and consider seeking independent financial advice if you are unsure. This content is for informational purposes only and does not constitute investment advice or a recommendation to buy or sell any instrument.
Can I trade Uniswap CFDs on Capital.com?
Yes, you can trade Uniswap CFDs on Capital.com. Trading crypto CFDs lets you speculate on price movements without owning the underlying asset and to take long or short positions. However, contracts for difference (CFDs) are traded on margin, and leverage amplifies both profits and losses. You should ensure you understand how CFD trading works, assess your risk tolerance, and recognise that losses can occur quickly.