TUI stock forecast: Q1 EBIT and 2026 guidance
TUI AG is a Germany-based travel and tourism group listed in Frankfurt, recently reporting Q1 underlying EBIT of about €77m on €4.9bn revenue and reaffirming its 2026 growth guidance amid steady booking trends. Explore third-party TUI1 price targets and technical analysis.
TUI AG (TUI1) is trading around €8.11 in late European dealings on 26 February 2026, moving within an intraday range of approximately €7.82–€8.17 on Capital.com’s feed as of 4:29pm UTC. The price sits in the lower half of the €8–€9 range it has broadly occupied in February 2026, following a period of increased volatility after January’s move above €9.50. Past performance is not a reliable indicator of future results.
The move comes amid continued focus on TUI’s recent quarterly statement and guidance. The group reported what it described as its best-ever first quarter, including underlying EBIT of about €77m on revenue of roughly €4.9bn, and reaffirmed its forecast for revenue growth of 2–4% and underlying EBIT growth of 7–10% in the 2026 financial year (MarketScreener, 10 February 2026). Trading activity also reflects commentary that winter 2025–26 and summer 2026 bookings remain broadly in line with expectations, supported by reported demand but tempered by a later booking curve and some recent softness attributed to wintry weather in key source markets (Reuters, 10 February 2026).
TUI stock forecast 2026–2030: Third-party price targets
As of 26 February 2026, third-party TUI stock predictions show a cluster of 12-month estimates around the low- to mid-€11 area, framed by differing views on European travel demand, booking patterns and TUI’s earnings momentum. The summaries below outline six February 2026 broker and consensus snapshots for TUI1 shares.
MarketScreener (Xetra consensus)
MarketScreener’s Xetra-listed TUI AG consensus shows an average 12-month target price of €11.36, based on 14 analyst estimates, alongside an 'Outperform'-type consensus stance – from a €8.20 low estimate to a €16 high estimate. The service notes that this level implies upside from the prevailing spot price and reflects expectations for continued revenue growth and underlying EBIT improvement following TUI’s Q1 2026 results and reiterated FY 2026 guidance (MarketScreener, 26 February 2026).
Yahoo Finance (Frankfurt snapshot)
Yahoo Finance reports a TUI1 stock forecast consensus of around €11.36, presented as a 12-month price objective compiled from covering analysts. The snapshot links this figure to analyst models that incorporate TUI’s dividend resumption, scheduled earnings on 13 May 2026 and recent performance in travel services (Yahoo Finance, 25 February 2026).
Deutsche Bank (broker rating)
Deutsche Bank maintains a Buy rating on TUI AG with a 12-month price target of €12. The note cites an encouraging FY 2026 outlook, with the broker highlighting operational leverage and demand trends while acknowledging macroeconomic and booking-pattern risks (The Globe and Mail, 11 February 2026).
Barclays (broker view)
Barclays maintains a Buy rating on TUI with a 12-month target price of €12. According to the summary, Barclays links this stance to expectations for a further recovery in travel volumes and pricing into summer 2026, while pointing to uncertainties around booking timing and consumer confidence (MarketScreener, 16 February 2026).
Predictions and third-party forecasts are inherently uncertain, as they cannot fully account for unexpected market developments. Past performance is not a reliable indicator of future results.
TUI1 stock price: Technical overview
As of 4:29pm UTC on 26 February 2026, the TUI1 stock price trades around €8.11 on the intraday chart, below its short- and medium-term moving average cluster, with the 20-, 50-, 100- and 200-day SMAs sitting near €8.60, €8.87, €8.27 and €8.01 respectively. The 14-day RSI at around 39 points indicates lower-neutral momentum, while an ADX reading near 29 signals an established trend backdrop rather than a range-bound phase.
On the topside, the first area to watch is the classic R1 pivot around €9.49, with R2 near €9.96 coming into view only if the price records a sustained move above that initial barrier. On pullbacks, initial support sits near the classic pivot at approximately €9.04, while the 200-day SMA around €8.01 marks a key longer-term reference level. A break below that zone could open the way towards S1 near €8.57 (TradingView, 26 February 2026).
This technical analysis is for informational purposes only and does not constitute financial advice or a recommendation to buy or sell any instrument.
TUI share price history (2024–2026)
TUI1’s stock price has spent much of the past two years trending higher from the mid-single digits, with a notable leg up through 2024 as it climbed from around €5.80–€6 in September 2024 to the low-€7s by early 2025. The move gathered pace into mid-2025, with the stock breaking above €7.50 in March and then moving through €8 in late August, before spending most of autumn 2025 consolidating in a broad €7.30–€8.30 range.
Into 2026, TUI extended that move, trading more consistently above €8.50 and briefly touching levels around €9.50–€9.60 in early February before easing back. By 26 February 2026, the share price closed near €8.14, leaving it modestly below this month’s highs but still above where it traded a year earlier, at around €7.16 on 26 February 2025.
Past performance is not a reliable indicator of future results. Share prices are indicative and may differ from live market prices.
TUI (TUI1): Capital.com analyst view
TUI’s share price has been choppy into late February 2026, with the stock easing from early-month highs near €9.50–€9.60 to trade closer to €8.10–€8.20 on 26 February. This follows a strong move over the past year from levels around €7.15 in February 2025 and below €6 in mid-2024. Periods of consolidation often follow sustained advances, although shorter-term swings can amplify gains and losses for traders using leverage.
On the fundamental side, the price moves against a backdrop of what TUI describes as its ‘best start to a financial year’, with underlying EBIT in Q1 2026 improving and bookings for winter 2025–26 and summer 2026 described as robust. The group has also reinstated a dividend, declaring a €0.10 per share payment for the 2025 financial year. These factors may support investor confidence if markets focus on earnings momentum, cash generation and shareholder returns. However, participants may also take a more cautious view if attention shifts to softer forward bookings in some segments, competitive pressures, the later booking curve and broader macroeconomic risks that could weigh on discretionary travel demand.
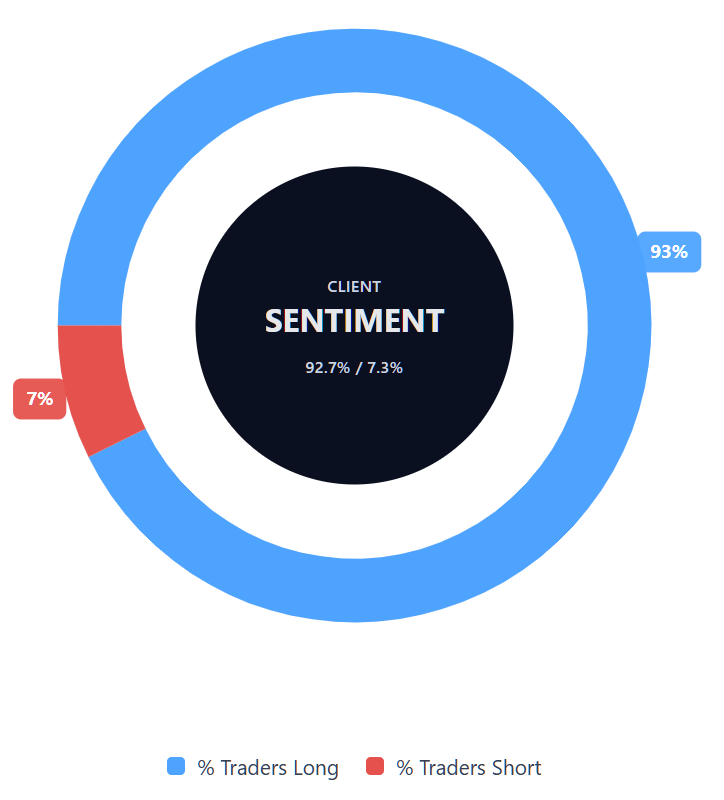
Capital.com’s client sentiment for TUI CFDs
As of 26 February 2026, Capital.com client positioning in TUI CFDs currently shows 92.7% of tracked accounts holding net long positions, compared with 7.3% net short, leaving a gap of around 85 percentage points. This indicates that positioning is concentrated on the long side rather than evenly balanced. The data reflect open positions on the Capital.com platform and can change over time.
Summary – TUI 2026
- As of 4:29pm UTC on 26 February 2026, TUI (TUI1) trades near €8.11, below early-February highs around €9.50 but above late-2024 levels near €6–€7.
- Technical indicators show the price below its 20- and 50-day moving averages but above the 200-day reference, with the 14-day RSI in lower-neutral territory and the ADX pointing to an established trend.
- Key variables include reported booking trends for winter 2025–26 and summer 2026 holidays and cruises, fuel costs, consumer confidence and broader European travel and leisure sentiment.
- Recent news has focused on TUI’s record Q1 start, described by the company as its best first quarter on record, and the AGM decision to resume dividends with a €0.10 payment for the 2025 financial year.
Past performance is not a reliable indicator of future results.
FAQ
Who owns the most TUI stock?
TUI AG’s shareholder base includes a mix of institutional investors, asset managers and retail shareholders. Large global investment firms and funds typically account for significant portions of the free float, based on public filings and exchange disclosures. Ownership levels can change over time as funds adjust their positions, so no single holder remains dominant on a permanent basis. For the most up-to-date breakdown, traders can refer to TUI’s investor relations updates and regulatory shareholding notifications.
What is the 5 year TUI share price forecast?
There is no single, agreed five-year TUI1 stock forecast, as most published analyst targets focus on a 12-month horizon rather than multi-year projections. Longer-term expectations depend on variables such as travel demand, fuel costs, consumer spending, competition and the company’s execution of strategy. Macroeconomic conditions and geopolitical developments may also influence performance. Investors often view long-term forecasts as scenarios rather than precise predictions.
Is TUI a good stock to buy?
Whether TUI is considered a ‘good’ stock depends on an individual’s objectives, risk tolerance and time horizon. Some analysts highlight earnings recovery, booking trends and dividend resumption, while others point to macroeconomic sensitivity and late booking patterns as risk factors. Travel and leisure shares can be cyclical and sensitive to external shocks, which may result in periods of heightened volatility. This information is for educational purposes only and does not constitute investment advice.
Could TUI stock go up or down?
TUI’s share price can move in either direction, depending on company performance, booking data, fuel costs, consumer confidence and broader market conditions. Earnings updates, analyst revisions and macroeconomic developments can influence short-term volatility, while longer-term trends may reflect changes in demand and cost structures. As with any listed equity, price movements reflect evolving expectations and risk assessments. When trading CFDs, leverage can amplify both profits and losses.
Should I invest in TUI stock?
The decision to invest in TUI shares depends on your financial situation, goals and tolerance for risk. Shares in travel companies can offer exposure to tourism demand, but they may also experience volatility linked to economic cycles, input costs and external events. Before making any decision, consider conducting your own research and, where appropriate, seeking independent financial advice. This content does not provide a recommendation to buy or sell any instrument.
Can I trade TUI CFDs on Capital.com?
Yes, you can trade TUI CFDs on Capital.com. Trading share CFDs lets you speculate on price movements without owning the underlying asset and to take long or short positions. However, contracts for difference (CFDs) are traded on margin, and leverage amplifies both profits and losses. You should ensure you understand how CFD trading works, assess your risk tolerance, and recognise that losses can occur quickly.