TUI stock forecast: Third-party price targets
TUI AG is a travel and tourism group listed on the Frankfurt Stock Exchange, generating revenue from package holidays, airlines, cruises and hotel operations across Europe and other markets. Explore third-party TUI1 price targets and technical analysis.
TUI AG (TUI1) is trading around €8.42 in intraday European dealing on 12 February 2026, within a session range of approximately €8.19–€8.74 based on Capital.com’s quote feed as of 3:46pm UTC. Past performance is not a reliable indicator of future results.
The stock is moving amid continued focus on TUI’s recently reported record full-year 2025 performance. Underlying Group EBIT rose to about €1.46bn and revenue increased to roughly €24.2bn for the year to 30 September 2025. The company also stated that holiday demand remained robust (TUI, 10 December 2025). Market participants are assessing indications that TUI’s 2025/26 winter and 2026 summer bookings are broadly in line with expectations (TUI, 10 February 2026).
TUI stock forecast 2026–2030: Third-party price targets
As of 12 February 2026, third-party TUI stock predictions show a range of 12-month views shaped by expectations for European travel demand, earnings momentum and balance-sheet progress. Across brokers and data aggregators, targets span from under €10 to the mid-€13s, reflecting differing assumptions on margins and macroeconomic conditions.
MarketScreener (Xetra consensus, brokers)
MarketScreener’s TUI1 consensus reports an average 12-month target price of about €11.36 for TUI AG, based on 14 contributing analysts. The site cites an 'Outperform' consensus stance, linked to expectations for further revenue growth and EBIT improvement following the group’s FY 2025 results and reiterated FY 2026 guidance (MarketScreener, 12 February 2026).
J.P. Morgan (broker research, single-stock view)
J.P. Morgan analyst Karan Puri maintained a Buy rating on TUI AG and set a 12-month price target of €13.50. The broker links this target to expectations for continued EBIT growth and demand into Summer 2026, while highlighting exposure to fuel prices, macroeconomic uncertainty and execution risk on cost measures (Longbridge, 4 February 2026).
Investing.com (consensus estimates)
Investing.com’s consensus estimates page for TUI indicates an average 12-month price prediction of around €11.36. High and low targets stand at €16 and €8.20 respectively, based on 14 analysts. The platform states that this range reflects varying assumptions around revenue trends, profitability and broader sector conditions in travel and leisure (Investing.com, 12 February 2026).
TipRanks (aggregated 12-month forecast)
TipRanks’ TUI1 forecast page shows an average 12-month target price of approximately €10.57. Individual analyst estimates range from about €8.20 to €13.50. The service notes that its aggregation draws on nine Wall Street analysts and updates as they revise models in response to earnings releases, booking trends and macroeconomic indicators relevant to discretionary travel (TipRanks, 12 February 2026).
Predictions and third-party forecasts are inherently uncertain, as they cannot fully account for unexpected market developments. Past performance is not a reliable indicator of future results.
TUI1 stock price: Technical overview
The TUI1 stock price is trading around €8.42 as of 3:46pm UTC on 12 February 2026, sitting below its short- and medium-term moving average band on the daily chart. The simple 20/50/100/200-day moving averages stand at approximately 9.02 / 8.88 / 8.24 / 7.96. The price currently holds below the 20- and 50-day averages but remains above the longer-term 200-day reference. The relative strength index (14) sits near 40, in lower-neutral territory, while the average directional index (14) at around 20.7 suggests a trend is present but not strongly established.
On the topside, the nearest classic pivot resistance (R1) stands around 9.49, with R2 near 9.96 if the price records a sustained daily close above the R1 area. On pullbacks, the classic pivot near 9.04 provides an initial reference level. Below that, the 100-day SMA near 8.24 marks the next technical reference; a clear daily move beneath this zone would bring the S1 area around 8.57 on the classic scale into focus (TradingView, 12 February 2026).
This technical analysis is for informational purposes only and does not constitute financial advice or a recommendation to buy or sell any instrument.
TUI share price history (2024–2026)
TUI1’s stock price has shifted higher over the past two years, moving from the mid-€6 area in early 2024 to trade closer to the €8–€9 band through late 2025 and into 2026. During much of 2024, the stock traded between approximately €5.60 and €7.50. It moved above €7.50 in the second half of the year and finished 2024 at €8.38 on 30 December, before trading mostly in the high-€7 to low-€8 range in early 2025.
Momentum increased again into 2025–26. The price rose from around €6.35 in June 2025 to the low-€9s by January 2026, briefly trading above €9.50 on 9 January. By 12 February 2026, TUI closed at €8.44, leaving it higher compared with levels seen in early 2024, but below the January 2026 highs as short-term volatility returned to daily trading ranges.
Past performance is not a reliable indicator of future results. Share prices are indicative and may differ from live market prices.
TUI (TUI1): Capital.com analyst view
TUI’s share price has moved from the mid-€6 area in early 2024 to trade within an €8–€9 range into February 2026. This shift coincides with a period of stronger reported results and evolving sentiment towards the European travel and leisure sector. The company reported record underlying EBIT for the 2025 financial year and described Q1 2026 as the 'best start' to a financial year in its history, including operating profit of about €77.1m on revenue of roughly €4.9bn.
Looking ahead, market participants may weigh factors such as holiday and cruise demand, booking patterns and sector-wide trends against potential headwinds, including macroeconomic uncertainty, fuel cost sensitivity and changes in consumer confidence. Stronger-than-expected earnings updates or sector data could influence price action in one direction, while weaker guidance or broader risk-off conditions could affect it in another. These factors remain subject to change.
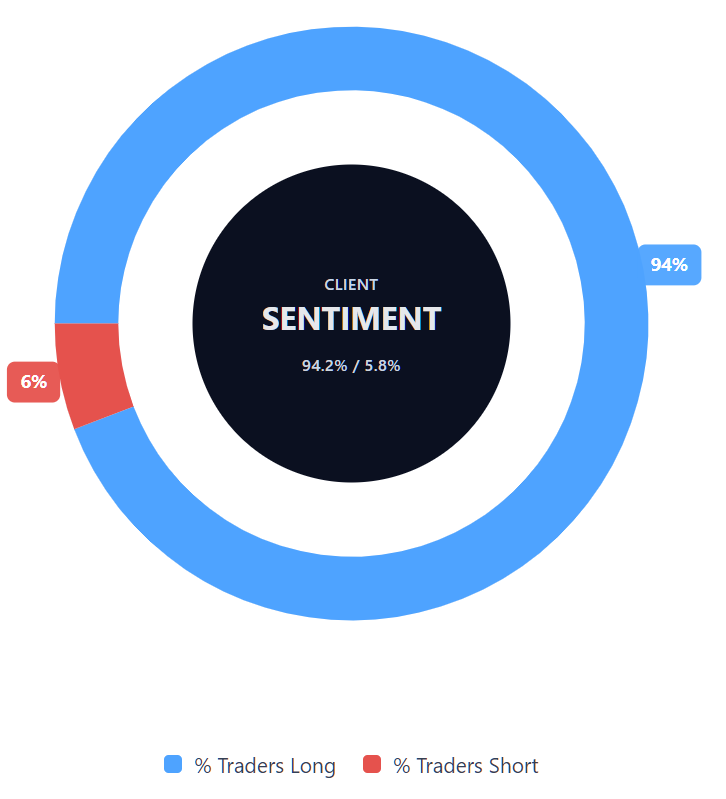
Capital.com’s client sentiment for TUI CFDs
As of 12 February 2026, Capital.com client positioning in TUI CFDs shows 94.2% buyers versus 5.8% sellers, leaving buyers ahead by approximately 88.4 percentage points. This skew indicates that open positions on the platform are concentrated on the long side at the time of writing. This snapshot reflects current open positions on Capital.com and can change.
Summary – TUI 2026
- TUI traded mostly between about €6 and €8.50 through 2024–2025, before moving into an €8–€9 range by late 2025 and early 2026.
- The share price rose from the mid-€6 area in early 2024 to close near €8.44 on 12 February 2026, placing it above year-earlier levels but below the January 2026 peak above €9.50.
- Recent fundamentals include record full-year 2025 results and what the company described as the 'best start' to a financial year in Q1 2026, with higher revenue and a positive operating profit.
- Technical indicators show the price below its 20- and 50-day moving averages but above the 200-day reference, while RSI near 40 signals lower-neutral momentum.
- Key variables that traders monitor include holiday and cruise demand, booking patterns, fuel costs, consumer confidence and broader European travel trends, all of which can influence price movements in either direction.
Past performance is not a reliable indicator of future results.
FAQ
Who owns the most TUI stock?
TUI AG is a publicly listed company, so its shares are held by a mix of institutional investors, asset managers and retail shareholders. The largest stakes are typically disclosed by institutional investors through regulatory filings, and these positions can change over time as funds adjust their holdings. To access the most up-to-date information, traders generally refer to the company’s annual report or official shareholder disclosures.
What is the 5-year TUI share price forecast?
There is no single, definitive five-year TUI1 stock forecast. Most publicly available analyst estimates focus on 12-month price targets, based on assumptions about travel demand, earnings trends and macroeconomic conditions. Longer-term projections tend to differ significantly, as they depend on variables such as sector cycles, cost management, leverage levels and consumer confidence. Forecasts are estimates only and may change as new information emerges.
Is TUI a good stock to buy?
Whether TUI is considered ‘good’ will depend on an individual’s objectives, risk tolerance and time horizon. The company has reported record full-year 2025 results and provided updates on booking trends for 2025/26, yet its share price remains sensitive to travel demand, fuel costs and broader economic conditions. Share prices can rise or fall, and past performance does not guarantee future results. This information is general in nature and does not constitute investment advice.
Could TUI stock go up or down?
Like any listed share, TUI’s stock price can move in either direction. Earnings updates, booking data or sector-wide developments may influence price action, while weaker demand indicators, cost pressures or broader market volatility may also affect performance. Technical factors and investor positioning can contribute to short-term movements. Share prices are inherently uncertain and can change quickly in response to new information.
Should I invest in TUI stock?
Deciding whether to invest in TUI shares depends on your financial circumstances, investment goals and appetite for risk. Equity investments offer potential returns, but they also expose capital to market fluctuations and company-specific risks. This article provides general information only and does not constitute investment advice. You may wish to seek independent financial advice before making any investment decision.
Can I trade TUI CFDs on Capital.com?
Yes, you can trade TUI CFDs on Capital.com. Trading share CFDs lets you speculate on price movements without owning the underlying asset and to take long or short positions. However, contracts for difference (CFDs) are traded on margin, and leverage amplifies both profits and losses. You should ensure you understand how CFD trading works, assess your risk tolerance, and recognise that losses can occur quickly.