TUI stock forecast: Booking hesitation, Gulf-route disruption
TUI is a travel group listed in Frankfurt, with its 2026 share-price weakness linked to softer summer booking trends, Gulf-route disruption and continued full-year guidance despite external pressures. Past performance is not a reliable indicator of future results.
TUI AG (TUI1) is trading at €6.965 as of 12:14pm UTC on 1 April 2026, within a session range of €6.51–€6.945. Past performance is not a reliable indicator of future results.
The pullback reflects a confluence of pressures: ongoing travel disruption stemming from the US-Israeli military conflict with Iran that broke out in late February, which TUI acknowledged caused ‘a short period of hesitation’ in bookings to Gulf-connected routes (Travel Weekly, 17 March 2026); investor caution over summer 2026 booked revenue running approximately 2% below the prior-year level at the time of the February earnings update; and a broader share-price decline of around 23% since the start of the year, despite TUI reporting record Q1 underlying EBIT of approximately €77m on revenue of roughly €4.9bn. TUI reconfirmed full-year 2026 guidance of 2–4% revenue growth and 7–10% underlying EBIT growth (TUI, 10 February 2026).
TUI stock forecast 2026–2030: Third-party price targets
As of 1 April 2026, third-party TUI stock predictions show a spread of €9.20–€13.50, reflecting divergent views on whether the Iran-conflict booking disruption is temporary and how quickly summer 2026 demand normalises. The four broker notes and one consensus snapshot below are ordered from lowest to highest target.
Bernstein (neutral reiteration)
Bernstein reiterates a Neutral rating on TUI with a 12-month price target of €9.20. The bank left its target unchanged, citing continued caution around the pace of bookings recovery and the group’s limited re-rating potential amid ongoing Middle East disruption (MarketScreener, 26 March 2026).
Barclays (downward revision, Buy retained)
Barclays cuts its 12-month price target on TUI to €11 from €12, while retaining a Buy rating. The revision reflects a recalibration of summer 2026 booking assumptions after forward revenue pacing came in softer than the prior-year period (MarketScreener, 9 March 2026).
Deutsche Bank (Buy reiteration)
Deutsche Bank maintains a Buy rating on TUI with a 12-month target of €12. Analyst Andre Juillard keeps the target unchanged, with the note citing TUI’s encouraging FY 2026 operational outlook and ongoing demand resilience in packaged travel despite near-term booking hesitation (The Globe and Mail, 16 March 2026).
MarketScreener (Xetra consensus)
MarketScreener aggregates 13 analyst estimates for TUI AG, arriving at an average 12-month price target of €11.43, within a range of €8.20–€16. The mean consensus rating is Outperform, as the majority of covering brokers retain constructive stances, while the wide spread between individual estimates reflects material disagreement over the pace of booking recovery and geopolitical normalisation (MarketScreener, 26 March 2026).
J.P. Morgan (Overweight, highest target)
J.P. Morgan maintains an Overweight rating on TUI with a 12-month target of €13.50. Analyst Estelle Weingrod notes that TUI has historically responded more weakly than hotel peers to geopolitical shocks before recovering, framing the Iran-related share price decline as consistent with prior episodes rather than a structural impairment (MarketScreener, 3 March 2026).
Predictions and third-party forecasts are inherently uncertain, as they cannot fully account for unexpected market developments. Past performance is not a reliable indicator of future results.
TUI1 stock price: Technical overview
The TUI1 stock price trades at €6.965 as of 12:14pm UTC on 1 April 2026, sitting above the short-term moving average cluster, where the 10-day simple moving average (SMA) prints near €6.72 and the 20-day SMA near €6.83, but below the longer-dated 30-, 50-, 100- and 200-day SMAs at roughly €7.16, €7.87, €8.13 and €7.99, all of which register sell signals on TradingView’s daily technicals as of that snapshot. The Hull moving average (9) at €6.64 and the volume-weighted moving average (20) near €6.81 both return buy signals, consistent with a short-term base forming, while the 20-day EMA at €6.95 registers a sell signal, sitting fractionally above the last price.
Momentum is broadly neutral: the 14-day relative strength index stands at 45.9, placing it in the mid-range and carrying no directional lean. The average directional index (14) reads 28.2, above the 25 threshold that typically indicates a trend with some definition, and the MACD level (12, 26) of -0.305 registers a buy signal on TradingView’s framework, though the negative reading indicates the MACD line remains below the signal line (TradingView, 1 April 2026).
On the topside, the classic R1 pivot at €7.37 represents the nearest overhead reference; a daily close above that level would put the R2 zone near €8.13 – which coincides broadly with the 100-day SMA at €8.13 – back within range. The classic pivot point (P) at €6.88 sits just above the current price and offers an initial reference on any near-term softness, with the Fibonacci pivot S1 near €6.40 and the classic S1 at €6.12 representing the next downside references should the pivot point not hold (TradingView, 1 April 2026).
This is technical analysis for informational purposes only and does not constitute financial advice or a recommendation to buy or sell any instrument.
TUI share price history (2024–2026)
TUI1’s stock price opened April 2024 around €7.78 before pulling back through the summer, touching a two-year intraday low of €5.09 on 5 August 2024 amid a broad equity sell-off. The stock recovered steadily through the second half of 2024, closing the year at €8.38 on 30 December 2024, up materially from that summer trough.
In 2025, TUI carried momentum into the new year, but the shares gave back ground in the spring, sliding to a close of €5.995 on 7 April 2025 – the weakest closing level in the dataset – before recovering to end the year at €8.99 on 30 December 2025.
TUI entered 2026 near its strongest levels in the two-year window, closing at €9.05 on 2 January. The stock extended those gains briefly, reaching an intraday peak of €9.52 on 10 February 2026 after a stronger-than-expected Q1 earnings update, before a sharp reversal driven by the Middle East conflict and softer forward-booking data. By 1 April 2026, TUI was trading at €6.965, approximately 23.0% down year to date and around 26.8% below its February peak, though still 7.8% above where it closed on 1 April 2025.
Past performance is not a reliable indicator of future results. Share prices are indicative and may differ from live market prices.
TUI (TUI1): Capital.com analyst view
TUI’s (TUI1) price trajectory over the past two years reflects the tension between solid operational recovery and an unusually volatile external backdrop. The group’s Q1 2026 results – which beat operating profit expectations and saw management reconfirm full-year guidance – indicated resilience in packaged travel demand, and the stock reached a multi-year high near €9.52 in February 2026 on that basis. However, the subsequent sell-off of roughly 27% from that peak illustrates how quickly sentiment can shift: the outbreak of conflict involving Iran in late February introduced both direct route disruption and broader hesitation among consumers booking forward travel, factors that weighed on the shares even as TUI’s guidance remained intact.
The near-term picture carries arguments in both directions. A faster-than-expected normalisation of Middle East airspace could support a recovery in forward bookings and narrow the gap between TUI’s current share price and analyst consensus targets, which cluster in the €11–€13.50 range. Equally, any escalation in geopolitical tensions, a deterioration in consumer spending across TUI’s core European markets, or further softness in summer 2026 booking pacing could sustain downward pressure on the shares. The wide spread between individual broker targets reflects the degree of uncertainty around the recovery timeline.
Past performance is not a reliable indicator of future results. This commentary is for informational purposes only and does not constitute financial advice or a recommendation to buy or sell any instrument.
Capital.com’s client sentiment for TUI CFDs
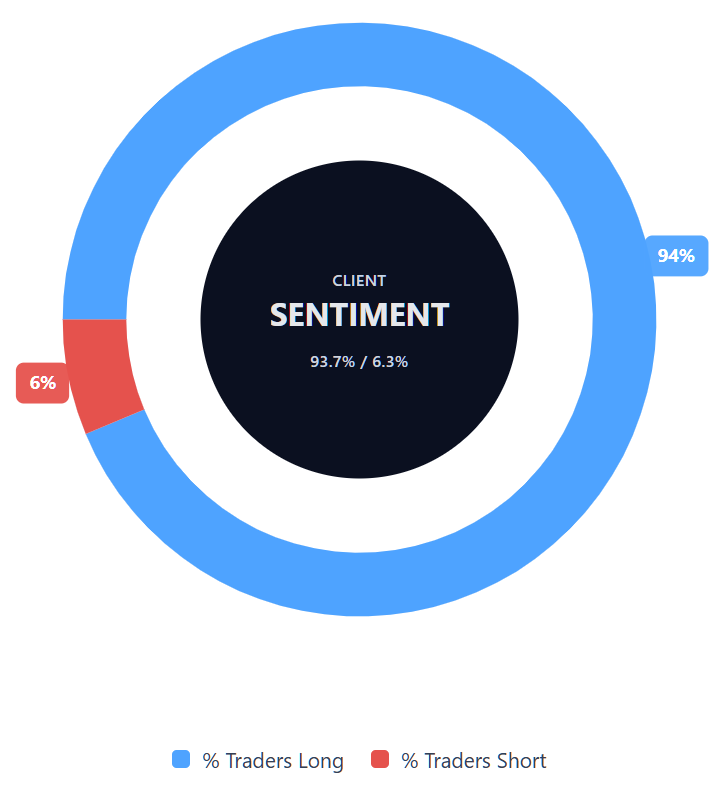
As of 1 April 2026, Capital.com client positioning in TUI CFDs shows 93.7% buyers and 6.3% sellers, putting buyers ahead by 87.4 percentage points and placing sentiment firmly in long-heavy territory. This snapshot reflects open positions on Capital.com and can change.
Summary – TUI 2026
- TUI (TUI1) trades at €6.965 as of 12:14pm UTC on 1 April 2026, down roughly 23.0% year to date and around 26.8% below its February 2026 peak of €9.52.
- Key price drivers include the ongoing Middle East conflict and its impact on European travel routes, TUI’s Q1 2026 earnings beat, and softer-than-prior-year forward booking pacing for summer 2026.
- TUI reported a ‘short period of hesitation’ in bookings following the Iran conflict, though the group reconfirmed full-year 2026 guidance of 7–10% underlying EBIT growth as of February 2026.
- Technical indicators are mixed: short-term moving averages (10- and 20-day SMAs) signal buy, while longer-dated SMAs from the 30-day higher register sell signals; the 14-day RSI sits at 45.9, in neutral territory.
Past performance is not a reliable indicator of future results.
FAQ
Who owns the most TUI stock?
Based on the article content provided, this isn’t established. The piece focuses on TUI’s recent share-price performance, analyst targets, technical levels and booking trends, rather than its shareholder structure. In practice, the answer can change over time as institutional investors, index funds and other large holders adjust their positions. For an accurate view, readers would usually need to consult TUI’s latest shareholder disclosures or regulatory filings rather than price analysis alone.
What is the 5 year TUI share price forecast?
The article does not provide a five-year TUI stock forecast, and the analyst targets cited are 12-month targets rather than long-term projections. That distinction matters, because forecasting a share price over five years involves far more uncertainty around consumer demand, travel patterns, fuel costs, competition and geopolitical developments. In this article, the more relevant takeaway is that even near-term views vary widely, which highlights how uncertain any longer-dated estimate would be.
Is TUI a good stock to buy?
The article does not make that judgement. It presents a balanced view, noting that TUI has reported resilient operating performance and maintained guidance, while also facing geopolitical disruption, softer booking trends and a sharp share-price pullback from its February 2026 high. Whether it is ‘good’ depends on a trader’s objectives, risk tolerance, time horizon and view of the travel sector. That is why the article stays informational and does not make a recommendation.
Could TUI stock go up or down?
Should I invest in TUI stock?
Can I trade TUI CFDs on Capital.com?
Yes, you can trade TUI CFDs on Capital.com. Trading share CFDs lets you speculate on price movements without owning the underlying asset and to take long or short positions. However, contracts for difference (CFDs) are traded on margin, and leverage amplifies both profits and losses. You should ensure you understand how CFD trading works, assess your risk tolerance, and recognise that losses can occur quickly.