Thyssenkrupp stock forecast: Isbergues suspension, Steel Europe sale doubts
Thyssenkrupp is a German industrial group whose shares remain in focus after the planned suspension of production at its Isbergues site and uncertainty over the Steel Europe sale process. Past performance is not a reliable indicator of future results. Explore third-party TKA price targets.
Thyssenkrupp AG (TKA) is trading at €7.89 in early European trading at 11:18am UTC on 1 April 2026, near the top of today's intraday range of €7.11–€7.90. Past performance is not a reliable indicator of future results.
Sentiment on TKA has come under pressure from several concurrent factors. The company announced on 26 March 2026 that it will fully suspend production at its Isbergues site in France from June through September, putting approximately 1,200 jobs at risk in France and Germany, as a surge in low-priced steel imports that are not yet covered by the EU's proposed new safeguard regime continues to compress margins (Reuters, 26 March 2026). Separately, Bloomberg reported on 12 March 2026 that senior Thyssenkrupp officials are increasingly doubtful that a deal to sell the Steel Europe division to India's Jindal Steel International can be concluded, with talks stalling over financing commitments (Bloomberg, 12 March 2026).
Thyssenkrupp stock forecast 2026–2030: Third-party price targets
As of 1 April 2026, third-party Thyssenkrupp stock predictions span a wide range, shaped by the company's ongoing Steel Europe restructuring, stalled Jindal Steel negotiations, and diverging views on a recovery in European industrial demand. The following targets summarise third-party sell-side and consensus assessments for TKA captured within this period.
J.P. Morgan (Neutral downgrade, revised target)
J.P. Morgan downgraded TKA to Neutral, revising its 12-month price target down to €10 from €11.10, after a sector review concluded that the risk-reward profile had become less favourable following recent share price moves. The bank cited continued uncertainty around the timing and financial impact of planned portfolio measures, including the delayed disposal of the Steel Europe division, as the basis for its more cautious stance (MarketScreener, 9 March 2026).
MarketScreener (eight-analyst consensus)
MarketScreener aggregates eight analyst ratings and reports a mean 12-month price target of €9.35, with a low estimate of €6.30 and a high of €13, and an overall consensus rating of Hold. The spread across individual estimates reflects diverging assumptions on balance-sheet repair, portfolio execution timing, and the trajectory of European steel pricing (MarketScreener, 6 March 2026).
TradingView (twelve-analyst consensus)
TradingView aggregates 12 analyst ratings issued in the three months to mid-March 2026 and reports a mean 12-month price target of €8.76, with a low of €4.73 and a high of €13.80. The distribution comprises three Strong Buy, one Buy, five Hold, one Sell, and two Strong Sell ratings, reflecting a broadly neutral aggregate consensus amid persistent uncertainty over portfolio restructuring execution (TradingView, 18 March 2026).
MarketBeat (broker consensus summary)
MarketBeat reports a Hold consensus rating on TKA, with the stock trading at €8.28 in that session while remaining below its 50-day moving average of approximately €10.14 and its 200-day moving average of approximately €10.12. The mixed consensus reflects divergent recent broker actions across Jefferies, J.P. Morgan, and Barclays, with no single directional signal dominating the aggregate rating (MarketBeat, 26 March 2026).
Jefferies (Buy maintained, €13 target reaffirmed)
Jefferies analyst Tommaso Castello reaffirmed a Buy rating and a 12-month price target of €13, implying approximately 67% upside from TKA's then-prevailing close of €7.79. Castello cited the planned exit from the HKM steel joint venture and a recently secured wage agreement with labour unions as operational catalysts, while also flagging renewed potential bidder interest in Steel Europe as a near-term event risk that the broader market was, in the firm's view, discounting (Ad-hoc-news, 17 March 2026).
Predictions and third-party forecasts are inherently uncertain, as they cannot fully account for unexpected market developments. Past performance is not a reliable indicator of future results.
TKA stock price: Technical overview
The TKA stock price trades at €7.89 as of 11:18am UTC on 1 April 2026, sitting just beneath the intraday high of €7.90 and well above the session low of €7.11. Price sits below all medium- and long-term simple moving averages, with the 20/50/100/200-day SMAs at approximately €8.19 / €9.87 / €9.66 / €8.51. The 10-day SMA at €7.78 and the Hull moving average (9) at €7.34 are the only moving average readings currently aligned as buy signals, suggesting that any short-term recovery remains nascent relative to the broader trend structure.
Momentum reads as broadly neutral with early stabilisation cues. The 14-day relative strength index sits at 42.26, within the lower-neutral band and offering no directional confirmation in either direction, while the average directional index (14) at 36.72 indicates that an established trend is in force, per TradingView data. The MACD (12, 26) level at −0.637 and the momentum (10) oscillator carry buy signals, though both operate against an otherwise neutral oscillator backdrop, with the commodity channel index, awesome oscillator, and Williams percent range all reading neutral.
On the topside, the classic R1 pivot at €9.51 represents the nearest overhead reference; a sustained daily close through that level would put the R2 area near €11.62 into view. The classic pivot point at €8.32 provides the first support reference below current price, with the 100-day SMA shelf near €9.66 sitting materially above, meaning price has already broken beneath the principal moving average structure. Should the €8.32 pivot give way, the S1 classic level at €6.21 represents the next reference to the downside (TradingView, 1 April 2026).
This is technical analysis for informational purposes only and does not constitute financial advice or a recommendation to buy or sell any instrument.
Thyssenkrupp share price history (2024–2026)
TKA’s stock price opened April 2024 trading near €5.04, then slid steadily through the summer, closing at around €3.87 in mid-September 2024, its lowest level in the two-year window covered here. A modest recovery through late 2024 lifted the stock to €4.09 by year-end, though it remained well below its April 2024 levels.
The picture shifted considerably in early 2025. TKA pushed above €6 in late February and gathered further momentum through March, climbing into the €9–€10.30 range by mid-March 2025. That rally extended into a peak of €13.03 on 13 October 2025, the highest close in the dataset, before a sharp reversal took hold. By mid-November 2025, the stock had retreated to around €3.27, and it closed the year near €9.33 after recovering from those lows.
In 2026, TKA rose again, reaching €12.36 on 11 February before giving back those gains through March. The stock closed at €7.87 on 1 April 2026, approximately 21.5% down year to date from the 2 January 2026 close of €9.71, and roughly 40% below the October 2025 peak.
TKA closed at €7.87 on 1 April 2026, approximately 21.5% down year to date, but 97.2% up year on year from the mid-September 2024 low of around €3.87.
Past performance is not a reliable indicator of future results. Share prices are indicative and may differ from live market prices.
Thyssenkrupp (TKA): Capital.com analyst view
Thyssenkrupp's share price has had a turbulent two years, swinging from multi-year lows near €3.87 in September 2024 to a peak of €13.03 in October 2025, before retreating sharply to current levels around €7.89 as of 1 April 2026. The volatility reflects a company in the midst of a deep structural overhaul that includes the Steel Europe restructuring, workforce reductions, and the ongoing sale process involving Jindal Steel, which have all created headline risk in both directions. On one hand, successful execution of these measures could streamline the business and improve margins. On the other, delays, financing complications, or deteriorating European steel demand could weigh further on sentiment.
The broader backdrop adds another layer of complexity. Softer European industrial output and persistent import competition have pressured steel pricing, while a mixed analyst consensus spanning Sell ratings near €6.30 and Buy calls as high as €13 illustrates the uncertainty around the stock's near-term trajectory. Restructuring stories can re-rate sharply in either direction, and TKA is no exception.
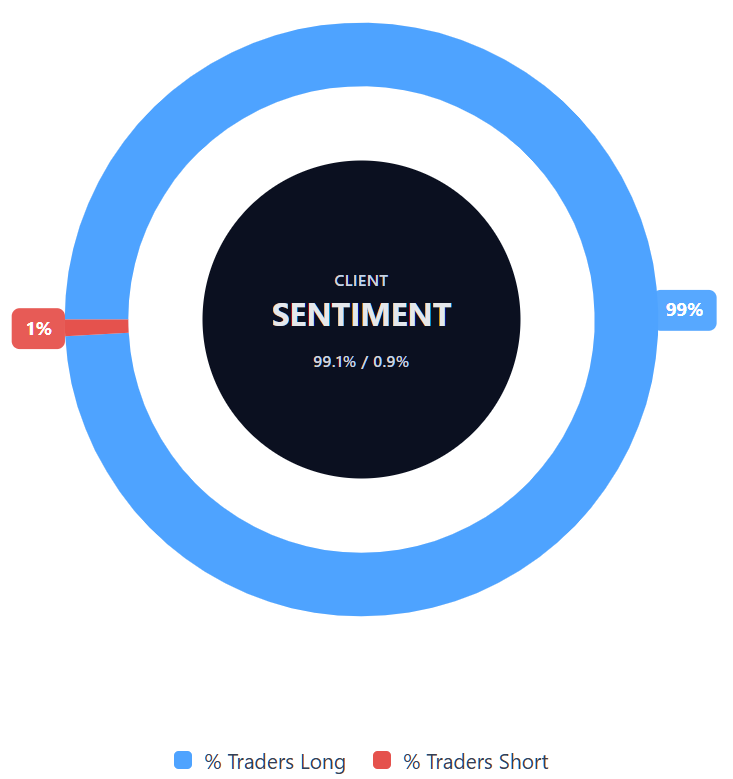
Capital.com’s client sentiment for Thyssenkrupp CFDs
As of 1 April 2026, Capital.com client positioning in Thyssenkrupp CFDs shows 99.1% buyers and 0.9% sellers, putting buyers ahead by 98.2 percentage points and placing sentiment firmly in a heavy-buy, one-sided-long territory. This snapshot reflects open positions on Capital.com and can change.
Summary – Thyssenkrupp 2026
- TKA trades at €7.89 as of 11:18am UTC on 1 April 2026, down approximately 21.5% year to date and around 39% below its October 2025 peak of €13.03.
- Technical indicators on TradingView show price below all medium- and long-term SMAs, with the 14-day RSI at 42.26 in lower-neutral territory and the ADX at 36.72 signalling an established downtrend.
- Key price drivers include the ongoing Steel Europe restructuring, stalled Jindal Steel disposal talks, and persistent pressure from low-cost steel imports weighing on European margins.
- Recent news centres on the suspension of Thyssenkrupp's Isbergues production site in France from June, putting approximately 1,200 jobs at risk amid continued import competition.
Past performance is not a reliable indicator of future results.
FAQ
Who owns the most Thyssenkrupp stock?
What is the 5 year Thyssenkrupp share price forecast?
Is Thyssenkrupp a good stock to buy?
Whether Thyssenkrupp is a good stock to buy depends on an investor’s objectives, time horizon and tolerance for risk. The article presents a mixed picture: analysts’ targets vary widely, technical indicators remain weak across medium- and long-term averages, and the company continues to face operational and macroeconomic pressure. At the same time, some analysts still see upside if restructuring measures progress. That balance of risks and possible opportunities means the stock does not lend itself to a simple yes-or-no conclusion.
Could Thyssenkrupp stock go up or down?
Yes, Thyssenkrupp’s share price could move in either direction, and the article outlines reasons for both scenarios. On the upside, progress in restructuring, improved labour agreements or renewed interest in Steel Europe could support sentiment. On the downside, delays to disposals, weak European steel demand, lower pricing power and continued import pressure could weigh on the shares. The stock’s recent history also shows large swings, which underlines that future price moves may remain volatile.
Should I invest in Thyssenkrupp stock?
Can I trade Thyssenkrupp CFDs on Capital.com?
Yes, you can trade Thyssenkrupp CFDs on Capital.com. Trading share CFDs lets you speculate on price movements without owning the underlying asset and to take long or short positions. However, contracts for difference (CFDs) are traded on margin, and leverage amplifies both profits and losses. You should ensure you understand how CFD trading works, assess your risk tolerance, and recognise that losses can occur quickly.