Tesla stock forecast: Third-party price targets
Tesla Inc. is a US-listed automotive and energy company traded on the Nasdaq, with its share price closely monitored due to its scale, sector influence, and sensitivity to company and macroeconomic developments. Explore third-party TSLA price targets and technical analysis.
Tesla, Inc. (TSLA) is trading around $425.92 in intraday dealings as of 4:17pm UTC on 11 February 2026, moving within a session range of $417.16–$434.20, placing the price near the middle of the day’s range. Past performance is not a reliable indicator of future results.
Tesla stock forecast 2026–2030: Third-party price targets
As of 11 February 2026, third-party Tesla stock predictions point to a wide range of 12-month views, with individual broker objectives stretching from just above $215 to $600 per share. These figures are typically framed as 12-month targets rather than precise year-end prices and are updated around company results, rating changes, and shifting assumptions on demand and margins.
Yahoo Finance (consensus snapshot)
Yahoo Finance reports that the average 12-month TSLA stock forecast stands around $383.26, with a spread between bullish and bearish cases reflecting differing views on growth and profitability. The publication notes that this dispersion follows a reassessment of Tesla’s earnings profile at the start of 2026, amid questions over electric vehicle demand, competitive dynamics, and execution in newer business lines (Yahoo Finance, 2 January 2026).
Phillip Securities (reduced target)
Phillip Securities cuts its Tesla price target to $215 from $220, maintaining a sell rating and implying substantial downside from prevailing prices at the time. The firm highlights concerns over valuation and near-term performance (MarketBeat, 2 February 2026).
MarketBeat (broker snapshot)
MarketBeat states that Tesla carries a consensus rating of hold, underpinned by a consensus price target near $403.92 drawn from a mix of buy, hold, and sell recommendations. The article explains that this mid-range target reflects differing analyst expectations for earnings and revenue growth following recent quarterly results and share price movements (MarketBeat, 10 February 2026).
Quiver Quantitative (recent target summary)
Quiver Quantitative lists several Tesla targets issued on 29 January 2026, including a $600 target from Wedbush, alongside a median target of about $485.50 across 24 analysts over the previous six months. The overview notes that the wide dispersion reflects contrasting assessments of Tesla’s valuation, with some analysts focusing on risks to the automotive business and others emphasising potential contributions from artificial intelligence, robotics, and software (Quiver Quantitative, 9 February 2026).
Predictions and third-party forecasts are inherently uncertain, as they cannot fully account for unexpected market developments. Past performance is not a reliable indicator of future results.
TSLA stock price: Technical overview
On the daily chart, the TSLA stock price is trading around $425.92 as of 4:17pm UTC on 11 February 2026, with price holding near the classic pivot at 434.46 and below the clustered 20-, 50-, and 100-day simple moving averages at roughly 427, 444, and 439 respectively, while remaining above the 200-day average near 384. The 14-day relative strength index (RSI) sits near 48, indicating neutral momentum, while an average directional index (ADX) reading around 25 suggests a developing but not dominant trend backdrop.
On the upside, the first area to monitor is the classic R1 pivot near 454.29. A sustained move above this level on a daily closing basis would bring the higher R2 zone around 478.18 into focus as a subsequent resistance area. On pullbacks, initial support appears near the Classic Pivot at 434.46, followed by the 200-day moving average around 383.86. A break below that longer-term average could expose the S1 region near 410.57 (TradingView, 11 February 2026).
This technical analysis is provided for informational purposes only and does not constitute financial advice or a recommendation to buy or sell any instrument.
Tesla share price history (2024–2026)
TSLA’s stock price has recorded significant swings over the past two years, rising from around $185 in mid February 2024 to $426.16 at the close on 11 February 2026. During this period, the stock moved through several distinct phases, falling below $150 in April 2024 before recovering into the summer, then advancing from below $200 in June 2024 to above $300 by July as market conditions improved.
The recovery extended into 2025, with TSLA climbing from roughly $235 in mid March 2025 to above $350 by late May, before trading in the $400–$450 range into early 2026. As of 11 February 2026, Tesla trades near the upper end of its two-year range, having retreated from highs near $490 in December 2025 while remaining well above its 2024 lows.
Past performance is not a reliable indicator of future results. Share prices are indicative and may differ from live market prices.
Tesla (TSLA): Capital.com analyst view
Tesla’s share price remains volatile in early 2026, easing from late December highs in the upper-$480s to trade closer to the low-$430s on Capital.com’s feed, while remaining above mid-2024 levels. Recent price action has coincided with mixed developments: lower 2025 vehicle deliveries and margin pressure have weighed on sentiment, while record energy storage deployments and continued focus on artificial intelligence and autonomy have kept attention on the company’s longer-term strategy.
From one perspective, developments in robotics, software, and potential robotaxi services could influence longer-term revenue expectations if execution meets internal targets. At the same time, these initiatives may require additional investment and carry execution risk. A relatively elevated valuation and intense electric vehicle competition may also act as constraints, while broader technology sector trends, policy developments, or shifts in macroeconomic conditions could affect the share price in either direction. Outcomes remain dependent on both company-specific performance and wider market conditions.
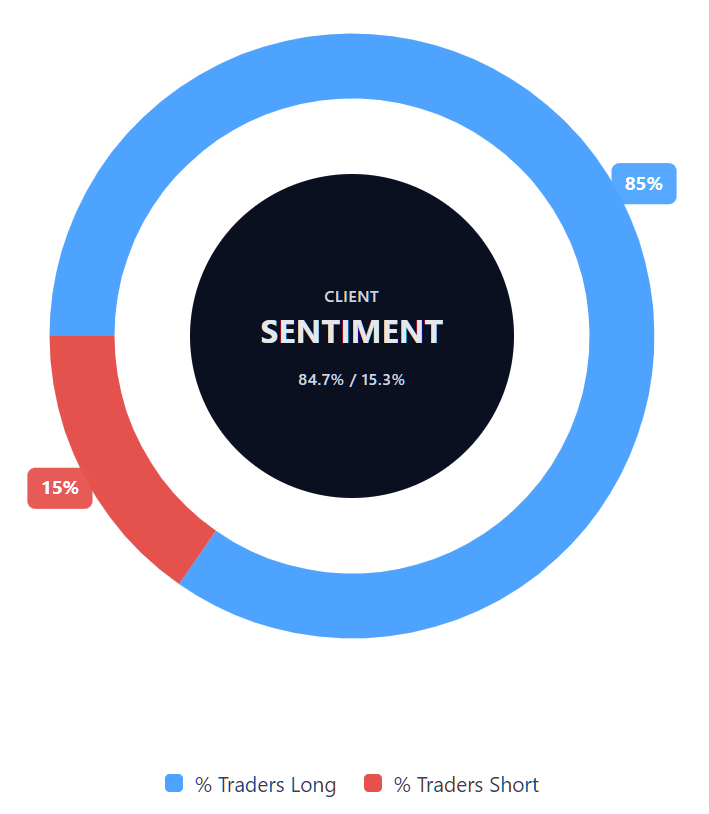
Capital.com’s client sentiment for Tesla CFDs
As of 11 February 2026, Capital.com client positioning in Tesla CFDs shows 84.7% buyers versus 15.3% sellers, leaving buyers ahead by approximately 69.4 percentage points. This distribution indicates that most open CFD positions on the platform currently favour the long side. However, sentiment data reflects positioning rather than future price direction and can change quickly as market conditions evolve.
Summary – Tesla 2026
- Tesla (TSLA) is quoted around $425.92 on Capital.com as of 4:17pm UTC on 11 February 2026, after trading between $417.16 and $434.20 intraday.
- Over the past two years, the share price has risen from sub-$200 levels in early 2024 to highs near $490 in December 2025, before easing back into the low-$400s.
- Technical indicators show price trading near the daily pivot at $434.46, with mixed moving-average signals and a mid-range RSI near 48 indicating neutral momentum conditions.
- Analysts reference electric vehicle demand, margin trends, competition, and potential contributions from software, energy storage, automation, and artificial intelligence as variables that may influence future performance.
Past performance is not a reliable indicator of future results.
FAQ
Who owns the most Tesla stock?
Tesla’s largest shareholders typically include its chief executive officer, Elon Musk, alongside major institutional investors such as asset managers and index fund providers. Ownership levels can change as insiders buy or sell shares and as funds rebalance their portfolios. Public filings, including those submitted to the US Securities and Exchange Commission (SEC), offer the most current view of significant shareholdings and institutional positions.
What is the 5 year Tesla share price forecast?
There is no single agreed five-year TSLA stock forecast, as most analysts publish 12-month price targets rather than longer-term projections. Longer-horizon estimates vary widely and depend on assumptions about electric vehicle demand, margins, competition, software revenues, and broader market conditions. Forecasts are inherently uncertain and may be revised as new financial data, company updates, and macroeconomic developments emerge.
Is Tesla a good stock to buy?
Whether Tesla is considered a ‘good’ stock depends on an individual’s objectives, risk tolerance, and time horizon. The company operates in competitive and capital-intensive industries, and its share price has shown significant volatility in recent years. Investors and traders often assess factors such as earnings performance, valuation metrics, industry dynamics, and balance sheet strength before making decisions. This information is provided for educational purposes only and does not constitute investment advice or a recommendation.
Could Tesla stock go up or down?
Tesla’s share price can move in either direction, influenced by company-specific developments and broader market conditions. Factors such as vehicle deliveries, margins, regulatory developments, competition, and sentiment towards technology stocks may affect price movements. Macroeconomic variables – including interest rates, inflation, and economic growth expectations – can also play a role. As with all equities, past performance does not guarantee future results.
Should I invest in Tesla stock?
Deciding whether to invest in Tesla shares depends on your financial circumstances, objectives, and tolerance for risk. Shares can provide exposure to potential growth, but they also carry the risk of capital loss, particularly during periods of heightened volatility. It is important to consider diversification, time horizon, and independent research before making any investment decision. This content does not provide personalised investment advice or a recommendation to buy or sell any instrument.
Can I trade Tesla CFDs on Capital.com?
Yes, you can trade Tesla CFDs on Capital.com. Trading share CFDs lets you speculate on price movements without owning the underlying asset and to take long or short positions. However, contracts for difference (CFDs) are traded on margin, and leverage amplifies both profits and losses. You should ensure you understand how CFD trading works, assess your risk tolerance, and recognise that losses can occur quickly.