Tesla stock forecast: Q1 deliveries miss estimates
Tesla reported Q1 2026 deliveries of 358,023 vehicles on 2 April, below consensus, while investors also weighed inventory growth and plans for lower-cost EV models, including a new SUV. Past performance is not a reliable indicator of future results. Explore third-party TSLA price targets.Tesla, Inc. (TSLA) closed at $351.60 as of 5:18pm UTC on 13 April 2026, trading within an intraday range of $343.40–$354.47. Past performance is not a reliable indicator of future results.
Sentiment around TSLA has been shaped by several converging factors. Q1 2026 vehicle deliveries of 358,023 units, reported on 2 April 2026, fell short of the Wall Street consensus of approximately 365,645 units, while a production-to-delivery gap of more than 50,000 vehicles pointed to a growing inventory build (Tesla Investor Relations, 2 April 2026). The consensus figure of 365,645 units was compiled from sell-side analysts and published by Tesla ahead of the quarter (Tesla Investor Relations, 26 March 2026). Broader US equity markets also staged a sharp recovery in the week ending 11 April 2026, with the S&P 500 rising approximately 3.6% after President Trump announced a tariff pause, easing macro uncertainty and lifting consumer discretionary and technology stocks (CNBC, 10 April 2026). At the same time, TSLA's reported plans to continue developing lower-cost EV models, including a new compact SUV reportedly priced below $30,000, added a product pipeline narrative amid ongoing macro uncertainty (TechTimes, 9 April 2026).
Tesla stock forecast 2026–2030: Third-party price targets
As of 13 April 2026, third-party Tesla stock predictions reflect contrasting views on near-term delivery execution, autonomous vehicle commercialisation, and the impact of a widening production-to-delivery gap.
HSBC (reduce reiteration)
HSBC trimmed its TSLA price target to $119 from $133, maintaining a Reduce rating. The bank cited sustained demand weakness and margin pressure as the basis for the revision, with its target the lowest among major sell-side firms covering the stock (MarketScreener, 20 March 2026).
J.P. Morgan (underweight note)
J.P. Morgan reiterated an Underweight rating on TSLAg, with analyst Ryan Brinkman keeping a $145 price target following Q1 2026 deliveries of 358,023 units, which fell short of Street expectations of approximately 365,000–372,000 units. Brinkman flagged the roughly 50,000-unit gap between production (408,000) and deliveries as a sign of mounting demand pressure and potential margin risk ahead of the Q1 earnings release (Electrek, 8 April 2026).
Truist Securities (hold cut)
Truist Securities cut its TSLA price target to $400 from $438, keeping a Hold rating, after describing Q1 delivery numbers as 'underwhelming' while noting that artificial intelligence remains central to long-term performance. The firm's revised target sits close to the broader sell-side consensus, reflecting a cautious near-term stance balanced against longer-dated AI and autonomy optionality (Investing.com, 2 April 2026).
Deutsche Bank (buy maintained)
Deutsche Bank lowered its TSLA price target to $465 from $480 but maintained a Buy rating, as analyst Edison Yu updated his model following the Q1 delivery miss. The bank retained a constructive long-term view, with its target implying more than 30% upside from the 13 April 2026 close of $351.60 (MarketBeat, 9 April 2026).
MarketScreener (consensus overview)
MarketScreener aggregated 48 analyst ratings, reporting a mean consensus of Outperform with an average 12-month price target of $415.30. Individual estimates span a wide range of $125–$600, illustrating the breadth of disagreement on Tesla's valuation across the covering analyst community (MarketScreener, 13 April 2026).
Predictions and third-party forecasts are inherently uncertain, as they cannot fully account for unexpected market developments. Past performance is not a reliable indicator of future results.
TSLA stock price: Technical overview
The TSLA stock price trades at $351.60 as of 5:18pm UTC on 13 April 2026, per Capital.com’s quote feed, sitting below every major moving average on the daily chart. According to TradingView, the 20-, 50-, 100- and 200-day SMAs stand at approximately $369, $393, $418 and $397, all generating sell signals, with price trading some $17–$66 beneath that band. The Hull moving average (9) at $342.99 is the sole moving-average indicator registering a buy signal, sitting just below the last close.
Momentum indicators are broadly subdued. The 14-day RSI reads 38.03, placing it in lower-neutral territory and indicating a market that remains under pressure rather than one showing clear signs of exhaustion. The ADX (14) at 27.66 signals an established downtrend, which TradingView’s data supports with a full sweep of sell signals across the SMA and EMA family.
On the classic pivot framework, the pivot point (P) at $380.09 represents the nearest reference above; a daily close back through this level would put the R1 level near $408 into view. To the downside, S1 at $343.80 is the next referenced level, followed by S2 near $315.85 if selling extends (TradingView, 13 April 2026).
This is technical analysis for informational purposes only and does not constitute financial advice or a recommendation to buy or sell any instrument.
Tesla share price history (2024–2026)
TSLA’s stock price closed at $160.30 on 15 April 2024, near a multi-month low after a sharp sell-off earlier that month, with the stock touching $141.53 on 22 April 2024, its lowest point in the dataset.
From that trough, TSLA staged a strong recovery through the second half of 2024. The stock climbed steadily from around $182 in late June 2024, cleared the $250 level in October, and surged following the US presidential election in November, touching a closing high of $475.04 on 26 December 2024. TSLA closed out the 2024 calendar year at $402.68 on 31 December.
The rally carried into early 2025, with TSLA closing at $427.68 on 17 January 2025. A sharp reversal then set in, dragging the stock to a local low of $215.30 on 10 March 2025. A brief recovery ran through April and into May, before renewed pressure weighed through the summer, with TSLA trading in the low-to-mid $300s between August and October 2025.
A second rally took hold in the final quarter of 2025, with TSLA reaching a closing peak of $489.84 on 22 December 2025 before fading into year-end. The stock opened 2026 at $458.89 on 2 January and has trended lower since, closing at $351.85 on 13 April 2026, approximately 21.9% down year to date and approximately 119.0% up from the 22 April 2024 low of $141.53.
Past performance is not a reliable indicator of future results. Share prices are indicative and may differ from live market prices.
Tesla (TSLA): Capital.com analyst view
Tesla’s price performance over the past two years reflects a stock that has experienced both powerful rallies and steep corrections, shaped by shifting sentiment around its core automotive business and longer-term autonomy ambitions. The surge from the mid-$140s in April 2024 to nearly $490 by December 2025 illustrated how quickly enthusiasm around artificial intelligence and robotaxi narratives can lift the stock. However, the subsequent retreat towards $350 by April 2026 shows that those same narratives carry execution risk, and that disappointing delivery figures, such as the Q1 2026 miss reported on 2 April 2026, can quickly reverse gains.
The divergence in analyst price targets, ranging from $119 to $465 as of April 2026, underscores how contested Tesla’s valuation remains. Bulls point to potential upside from autonomous driving and energy products, while bears highlight margin pressure, intensifying EV competition, and brand sentiment headwinds. Both sets of arguments carry weight, and the stock’s elevated volatility suggests the market has yet to reach a settled view on which scenario is more probable.
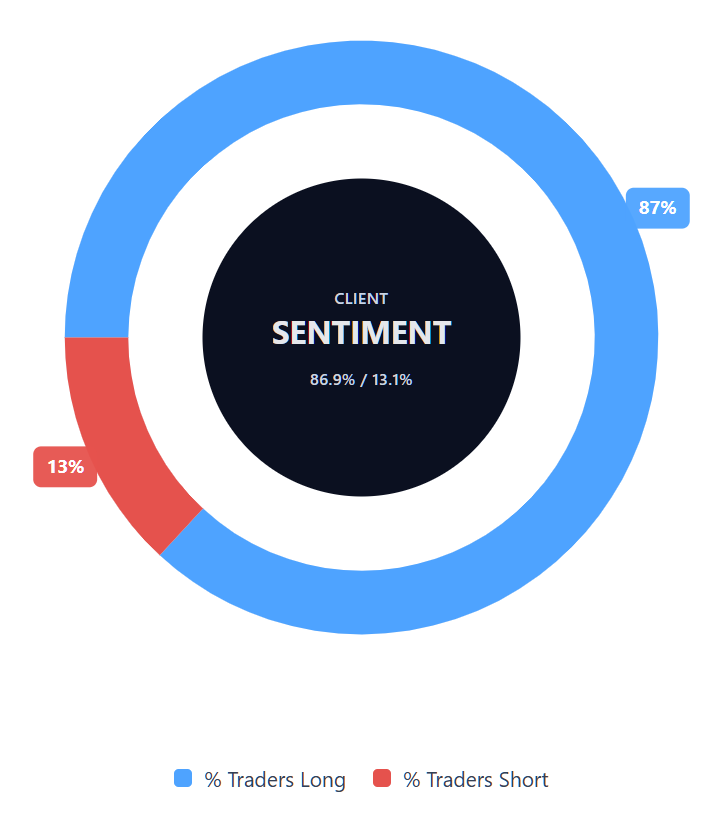
Capital.com’s client sentiment for Tesla CFDs
As of 13 April 2026, Capital.com client positioning in Tesla CFDs stands at 86.9% buyers versus 13.1% sellers, putting buyers ahead by 73.8 percentage points and placing sentiment firmly in heavy-buy, one-sided long territory. This snapshot reflects open positions on Capital.com at the time of capture and can change rapidly as market conditions evolve.
Summary – Tesla 2026
- TSLA closed at $351.60 as pf 5:18pm UTC on 13 April 2026, down approximately 21.9% year to date and well below its December 2025 closing high of $489.84.
- On TradingView, all major moving averages sit above the current price, generating sell signals across the board. The 14-day RSI at 38.03 sits in lower-neutral territory, while ADX at 27.66 indicates an established downtrend.
- Key price drivers include Tesla’s Q1 2026 delivery miss of 358,023 units against a consensus of approximately 365,000, ongoing margin pressure, and a wide analyst target range of $119–$465, reflecting substantial valuation disagreement.
Past performance is not a reliable indicator of future results.
FAQ
Who owns the most Tesla stock?
What is the 5 year Tesla share price forecast?
Is Tesla a good stock to buy?
Could Tesla stock go up or down?
Should I invest in Tesla stock?
Can I trade Tesla CFDs on Capital.com?
Yes, you can trade Tesla CFDs on Capital.com. Trading share CFDs lets you speculate on price movements without owning the underlying asset and to take long or short positions. However, contracts for difference (CFDs) are traded on margin, and leverage amplifies both profits and losses. You should ensure you understand how CFD trading works, assess your risk tolerance, and recognise that losses can occur quickly.