Stellantis stock forecast: H2 charges, dividend suspension
Stellantis is a global carmaker listed in Milan, with its shares under pressure after €22.2 billion in H2 2025 charges and the suspension of its 2026 dividend. Past performance is not a reliable indicator of future results. Explore third-party STLAM price targets and technical analysis.
Stellantis N.V. (STLAM) is trading at €5.69 as of 1:17pm UTC on 24 March 2026, within an intraday range of €5.30–€5.75. Past performance is not a reliable indicator of future results.
Shares remain under pressure amid several intersecting factors. Stellantis booked approximately €22.2 billion in H2 2025 charges related to its strategic reset, including cancelled electric vehicle programmes and restructuring costs, and suspended its 2026 dividend (CNBC, 26 February 2026). To shore up its balance sheet, the company priced a €5 billion multi-tranche subordinated perpetual hybrid bond offering on 10 March 2026, with coupons ranging from 6.250% to 8.250%, which settled on 16 March 2026 (Reuters, 11 March 2026). Broader sector headwinds also persist. US tariff costs have totalled at least $35 billion across global automakers since 2025, weighing on European manufacturers with US exposure (Automotive News, 16 March 2026), while EU passenger car registrations slipped in early 2026 amid an ongoing shift in the powertrain mix (Wards Auto, 26 February 2026).
Stellantis stock forecast 2026–2030: Third-party price targets
As of 24 March 2026, third-party Stellantis stock predictions reflect a broadly cautious but divided outlook, shaped by the group’s €22.2 billion H2 2025 reset charges, dividend suspension, and dual credit rating downgrades to the lowest investment grade from both S&P and Moody’s.
DZ Bank (house view, Buy)
DZ Bank analyst Matthias Volkert reiterates a Buy rating on Stellantis. The firm maintained its positive view amid the group’s stated 2026 recovery targets, including a 25% increase in US retail sales to 1.15 million units and the planned return of Hemi-powered models (MarketScreener, 10 March 2026).
Yahoo Finance (consensus snapshot)
Yahoo Finance reports that Freedom Capital analyst Dmitriy Pozdnyakov identifies Stellantis as one of the cheapest stocks in the market on a price-to-book basis, with the NYSE-listed STLA trading at a significant discount to net asset value. The note notes that the stock’s low valuation reflects persistent investor uncertainty over restructuring execution and the pace of margin normalisation (Yahoo Finance, 12 March 2026).
MarketBeat (Wall Street consensus)
MarketBeat notes that Stellantis set a new 12-month low, with the Wall Street consensus sitting at a Hold rating amid an average 12-month price target of $11.12, spanning a range of $8–$15. The service highlights that the target midpoint implies significant upside from the 20 March trough, while the Hold consensus reflects analyst caution pending clearer evidence of margin recovery in upcoming quarterly results (MarketBeat, 21 March 2026).
Citi (house view, Hold)
Citi analyst Harald Hendrikse assigns a Hold rating to Stellantis with a 12-month price target of €7. The target implies a modest recovery from current STLAM levels, with the Hold stance reflecting balanced risks between restructuring cost containment and continued demand headwinds in core European and North American markets (The Globe and Mail, 20 March 2026).
Public.com (buy-side consensus)
Public.com aggregates ratings from five analysts, recording a Buy consensus on NYSE-listed STLA with a price target range of $5.90–$14.40 and a midpoint near $8.59. The wide spread reflects divergent views on the timeline for profitability recovery, with bulls pointing to the group’s planned model launches and bears citing negative adjusted free cash flow guidance of approximately minus €2.5 billion for full-year 2026 (Public.com, 23 March 2026).
Predictions and third-party forecasts are inherently uncertain, as they cannot fully account for unexpected market developments. Past performance is not a reliable indicator of future results.
STLAM stock price: Technical overview
The STLAM stock price trades at €5.69 as of 1:17pm UTC on 24 March 2026, sitting below every key simple moving average on the daily chart. The 20-, 50-, 100-, and 200-day SMAs stack at roughly €6.07, €6.94, €8.13, and €8.27, all signalling sell, and the last price sits beneath the Ichimoku base line near €6.13 and the volume-weighted moving average near €6.12, reinforcing the bearish MA structure. The Hull moving average (9) at €5.56 is the only moving average currently below price, issuing a buy signal from that short-term momentum lens.
Momentum indicators are mixed but lean cautious. The 14-day RSI sits at 35.5, in lower-neutral territory and not yet at a classically oversold extreme, while the ADX at 34.4 suggests that an established downtrend is in place. The stochastic %K at 19.6 and the MACD level at -0.39 both register buy signals, suggesting short-term momentum may be reaching a local exhaustion point within the broader downward structure.
On the topside, the classic pivot point at €7.16 represents the first meaningful reference above the current price; a sustained daily close through that level would put the R1 resistance area near €8.60 in view. Beyond that, R2 near €10.25 becomes the next reference, though each of those levels also corresponds roughly to the crowded SMA shelf between the 50- and 200-day SMAs.
On pullbacks, the S1 classic support level near €5.51 is the immediate downside reference, with the S2 area at €4.08 the next meaningful level should €5.51 give way on a closing basis. Losing the €5.51 area would risk deepening the move towards the S2–S3 zone between €4.08 and €0.99, though S2 and S3 are wide apart, and S3 near €0.99 reflects the full extent of the classic pivot range rather than a near-term target (TradingView, 24 March 2026).
This is technical analysis for informational purposes only and does not constitute financial advice or a recommendation to buy or sell any instrument.
Stellantis share price history (2024–2026)
STLAM’s stock price closed at around €27.24 on 25 March 2024, near the top of its recent range at the time, before a prolonged decline took hold through the rest of that year.
The stock slid steadily through the summer and autumn of 2024, dropping from the mid-€20s in April to around €14.58 by late September and closing the year near €12.60, as profit warnings and a CEO change weighed on sentiment. A brief recovery attempt in early 2025 lifted the price to around €13.57 by 18 February 2025, but it proved short-lived, with shares retreating to roughly €11.35 by 24 March 2025.
The pace of decline then accelerated. Stellantis fell below €10.26 on 2 April 2025 and dipped to around €8.95 on 4 April amid the announcement of sweeping US tariffs, before staging a partial rebound towards €10.50 by early December 2025. That recovery stalled heading into 2026, with the stock opening the year around €9.71.
The sharpest single-day move in the dataset came on 6 February 2026, when STLAM closed at €6.23, down from €8.21 the session prior, after the company reported a net loss of approximately €20 billion and booked over €22 billion in charges tied to its electric vehicle reset and dividend suspension. The stock has continued to slide since, closing at €5.68 on 24 March 2026, approximately 41.5% down year to date and 50.0% lower year on year.
Past performance is not a reliable indicator of future results. Share prices are indicative and may differ from live market prices.
Stellantis (STLAM): Capital.com analyst view
Stellantis has faced a turbulent two years, with shares falling from the mid-€20s in early 2024 to around €5.69 as of 24 March 2026, reflecting a combination of company-specific challenges and broader sector headwinds. The February 2026 results crystallised the scale of the reset, with the group booking over €22 billion in charges, suspending its dividend, and reporting a net loss of approximately €20 billion for H2 2025. On one hand, the new management team’s strategic plan, which targets a 25% increase in US retail volumes and a return to positive free cash flow, offers a potential recovery narrative for those monitoring the stock. On the other hand, the timeline for margin normalisation remains uncertain, and the stock now trades below every major moving average, suggesting the market has yet to price in a convincing turnaround.
Broader macro factors add further nuance. US auto tariffs continue to weigh on the sector’s cost base, while softer European new-car registrations in early 2026 point to a challenging demand environment. A weaker euro could provide some offset by improving the group’s competitiveness on dollar-denominated revenues, though it could also raise input costs for components sourced globally. The April 2026 AGM and any updated guidance on cash generation will likely be watched closely as potential sentiment catalysts in either direction.
Capital.com’s client sentiment for Stellantis CFDs
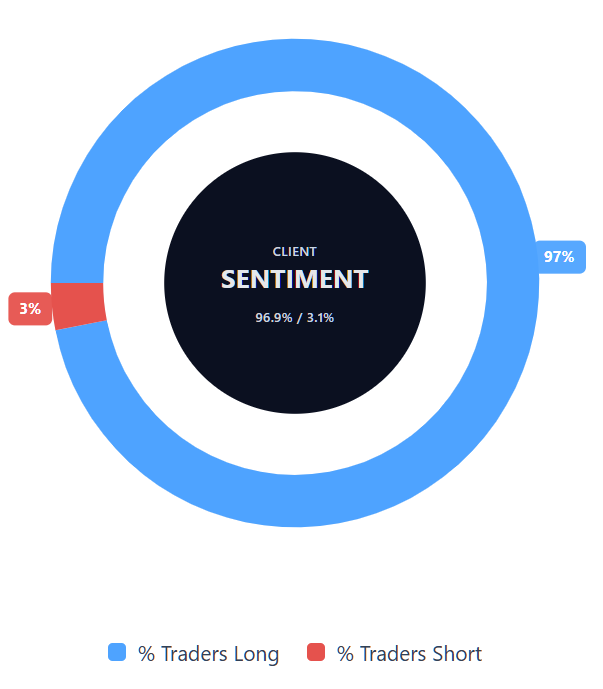
As of 24 March 2026, Capital.com client positioning in Stellantis CFDs is skewed: 96.9% long and 3.1% short, putting buyers ahead by 93.8 percentage points and placing sentiment firmly in heavy-buy, one-sided-towards-longs territory. This snapshot reflects open positions on Capital.com and can change.
Summary – Stellantis 2026
- STLAM trades at €5.69 as of 1:17pm UTC on 24 March 2026, down roughly 50% year on year and 41.5% year to date, from a two-year high near €27.24 in March 2024.
- The stock broke sharply lower on 6 February 2026 after Stellantis booked over €22 billion in EV-related charges, reported its first annual net loss, and suspended the 2026 dividend.
- All key daily moving averages – 20-, 50-, 100-, and 200-day SMAs ranging from €6.07 to €8.27 – sit above the current price, maintaining a bearish MA structure; the 14-day RSI reads 35.5, in lower-neutral territory, while the ADX at 34.4 suggests an established downtrend.
- Key drivers include US auto tariffs weighing on sector-wide costs, softening European new-car registrations, dual credit rating downgrades to the lowest investment grade by S&P and Moody’s, and uncertainty over the pace of margin recovery.
- Recent developments include a €5 billion hybrid bond offering priced on 10 March 2026 to bolster the balance sheet, Stellantis’ expansion of North American EV fast-charging access via the Tesla Supercharger network, and the publication of the agenda for the 14 April 2026 AGM, which includes a proposed board refresh.
- A securities fraud investigation by law firm Levi & Korsinsky into the company’s pre-February 2026 EV disclosures adds a further layer of legal uncertainty to the investment case.
Past performance is not a reliable indicator of future results.
FAQ
Who owns the most Stellantis stock?
Stellantis has a concentrated shareholder base, with major long-term investors typically including Exor, the Peugeot family’s holding interests, Bpifrance, and institutional investors. The exact ranking can change over time as holdings are updated. In practice, ownership matters because large shareholders can influence governance and strategy, but it does not determine near-term share price direction on its own. Investors usually consider ownership alongside earnings, debt, product plans, and wider auto-sector conditions.
What is the 5 year Stellantis share price forecast?
There is no single reliable five-year STLAM stock forecast. Long-term projections vary widely because they depend on factors that can change materially over time, including vehicle demand, margins, tariffs, restructuring progress, competition, and the pace of the group’s electric vehicle transition. Shorter-term analyst targets can offer a snapshot of current expectations, but they are not guarantees. Longer-horizon forecasts should be treated as scenario-based estimates rather than precise predictions.
Is Stellantis a good stock to buy?
Whether Stellantis is a good stock to buy depends on an individual’s objectives, time horizon, and tolerance for risk. Some market participants may focus on its reduced valuation, global brand portfolio, and scope for operational recovery. Others may focus on the recent charges, dividend suspension, weak price trend, and uncertainty around margins and cash flow. Because those factors point in different directions, the stock can be viewed as both a potential recovery case and a higher-risk cyclical exposure.
Could Stellantis stock go up or down?
Yes, Stellantis stock could move in either direction, and the article outlines reasons for both outcomes. On the upside, investors may watch for evidence that restructuring is progressing, margins are stabilising, and cash generation is improving. On the downside, pressure could persist if tariffs, weaker demand, rating concerns, or execution risks continue to weigh on the business. Share price moves can also be influenced by broader market sentiment, not just company-specific developments.
Should I invest in Stellantis stock?
Whether someone should invest in Stellantis is a personal decision rather than a general conclusion. The shares are exposed to both company-specific risks and broader automotive sector pressures, including tariffs, restructuring costs, and uncertain recovery timing. At the same time, some observers may see scope for improvement if operational targets are met. Rather than treating it as a simple yes-or-no question, it may be more useful to assess the stock in the context of risk appetite, portfolio goals, and preferred market exposure.
Can I trade Stellantis CFDs on Capital.com?
Yes, you can trade Stellantis CFDs on Capital.com. Trading share CFDs lets you speculate on price movements without owning the underlying asset and to take long or short positions. However, contracts for difference (CFDs) are traded on margin, and leverage amplifies both profits and losses. You should ensure you understand how CFD trading works, assess your risk tolerance, and recognise that losses can occur quickly.