Stellantis stock forecast: €22.2bn reset, dividend suspension
Stellantis is a multinational carmaker navigating a €22.2bn reset, dividend suspension and €5bn bond plan, as investors assess restructuring progress and softer European auto demand in early 2026. Explore third-party STLAM price targets and technical analysis.
Stellantis N.V. (STLAM) is trading at €6.53 as of 2:28 pm UTC on 4 March 2026, at the top of its intraday range of €6.10–€6.53. The stock has moved higher from a sharp February sell-off that followed the company’s full-year results announcement. Past performance is not a reliable indicator of future results.
The session’s recovery comes amid a broader reassessment of Stellantis’ €22.2bn in H2 2025 reset charges, which drove a net loss of €19–21bn and prompted the suspension of its 2026 dividend (Reuters, 6 February 2026). The company has also authorised up to €5bn in perpetual hybrid bonds to support its balance sheet, while targeting a mid-single-digit percentage rise in net revenues for 2026 (Market Chameleon, 26 February 2026). Sector headwinds persist, with EU new-car registrations falling in January 2026 amid intensifying competition from Chinese EV manufacturers (WardsAuto, 26 February 2026).
Stellantis stock forecast 2026–2030: Third-party price targets
As of 4 March 2026, third-party Stellantis stock predictions have been revised sharply since the company’s February 2026 full-year results, with most forecasters lowering 12-month targets in response to €22.2bn in reset charges, a projected net loss, and the suspension of the 2026 dividend. The following targets represent a selection of recent published estimates and consensus snapshots, ordered from lowest to highest target.
Deutsche Bank (house view)
Deutsche Bank lowered its 12-month price target on Stellantis to €7 from €8, maintaining a Hold rating, after the group disclosed its large non-cash charges and announced its EV strategy reset. The bank cites the scale of the writedowns and the near-term pressure on free cash flow as the basis for the revised target (Investing.com, 9 February 2026).
Freedom Capital Markets (house view)
Freedom Capital Markets upgrades its rating on Stellantis to Buy while simultaneously cutting its price target to $9 from $11.30, reflecting a changed risk–reward assessment at post-announcement share price levels. The move comes amid the stock’s sharp decline following the February results, with the firm citing the scope for earnings recovery as the group executes its restructuring plan (GuruFocus, 10 February 2026).
Fintel consensus tracker (aggregate view)
The average 12-month price target across tracked analysts stands at $9.93, revised down 15.17% from the prior consensus of $11.70 recorded on 3 February 2026, with individual estimates spanning a wide range of $5.93 to $15.41. The downward revision follows the company’s full-year disclosure and reflects a broad reassessment of near-term earnings assumptions across the sell-side (Nasdaq, 25 February 2026).
MarketBeat (Wall Street consensus)
MarketBeat aggregates 15 Wall Street analysts covering Stellantis and reports a consensus 12-month price target of $11.31, with 2 Buy ratings, 11 Hold ratings, and 2 Sell ratings, yielding an overall Hold consensus. The service notes that the target range spans from $10.10 to $13.20, as analysts balance cyclical auto demand headwinds against the company’s stated 2026 revenue growth guidance (MarketBeat, 3 March 2026).
Public.com (analyst consensus)
Public.com reports that 5 analysts covering Stellantis assign an average 12-month price target of $11.79, with a Buy consensus; 40% recommend Strong Buy, 20% Buy, and 40% Hold, with no Sell recommendations in the current sample. The platform notes that analysts’ views incorporate recent market trends and the company’s updated strategic direction following the 2025 results announcement (Public.com, 4 March 2026).
Predictions and third-party forecasts are inherently uncertain, as they cannot fully account for unexpected market developments. Past performance is not a reliable indicator of future results.
STLAM stock price: Technical overview
The STLAM stock price trades at €6.53 as of 2:28 pm UTC on 4 March 2026, sitting at the top of today’s €6.10–€6.53 intraday range. Every key moving average lies above the current price — the 20/50/100/200-day SMAs sit at approximately €6.59 / €7.94 / €8.58 / €8.48 — and all carry a Sell signal, indicating the price remains below the full moving-average stack. The 14-day RSI reads 40.5, a neutral reading that offers no near-term directional conviction, while the ADX at 31.9 indicates an established trend remains in force — currently to the downside.
On the topside, the Classic R1 pivot at €8.60 represents the first meaningful overhead reference; a sustained daily close through that level would put the R2 area near €10.25 in view. The Volume Weighted Moving Average (20) at €6.46 and the Hull Moving Average (9) at €6.43 sit fractionally below the current price and register as the only Buy-aligned averages in the dataset, offering a modest near-term reference if the stock holds recent gains.
On pullbacks, the Classic Pivot (P) at €7.16 sits above price and acts as a key overhead level to reclaim before the broader trend shifts; initial downside support rests at the S1 pivot near €5.51. A loss of the €5.51 area would risk a move towards the S2 level at €4.08, which aligns with the lower bound of the Classic pivot range (TradingView, 4 March 2026).
This is technical analysis for informational purposes only and does not constitute financial advice or a recommendation to buy or sell any instrument.
Stellantis share price history (2024–2026)
Stellantis listed on Euronext Milan and the NYSE in January 2021 following the merger of PSA Group and Fiat Chrysler Automobiles.
STLAM’s stock price traded around €24.83 in early March 2024 before trending lower through the year. They closed at €18.29 on 24 July and €14.58 by late September, following profit warnings linked to weaker North American volumes and rising inventories. STLAM ended 2024 at €12.60, roughly half its level at the start of the year.
The decline extended into 2025. After opening February near €13.50, the stock fell to €9.44 by 3 April amid broader European auto sector pressure. It stabilised later in the year, closing 2025 at €9.49.
On 6 February 2026, STLAM dropped 24.1% in one session to €6.23 after reporting a net loss tied to €22.2bn in reset charges and suspending its 2026 dividend. Since then, the price has largely ranged between €6.20 and €6.98, closing at €6.52 on 4 March 2026 — down 30.9% year to date and 40.9% year on year.
Past performance is not a reliable indicator of future results. Share prices are indicative and may differ from live market prices.
Stellantis (STLAM): Capital.com analyst view
Stellantis’ share price over the past two years highlights the scale of the challenges it faces. From above €24 in early 2024, STLAM declined steadily, with the move accelerating on 6 February 2026 when the stock fell more than 24% in one session after the company disclosed €22.2bn in reset charges, a full-year net loss and the suspension of its 2026 dividend.
Since then, the price has stabilised in the €6.20–€6.98 range. Some market participants view this consolidation as a sign that a significant portion of the repricing has already occurred, particularly in light of management’s guidance for mid-single-digit revenue growth in 2026. Others remain cautious, citing balance sheet adjustments, softer European auto demand and increased competition from Chinese EV manufacturers.
Stellantis’ broad geographic footprint and multi-brand portfolio provide diversification, but they also expose the group to regional demand cycles and regulatory change, including evolving EU emissions standards. The shift away from a strongly EV-focused strategy may support near-term volumes in combustion and hybrid vehicles, while creating longer-term strategic questions. Execution of the restructuring plan remains a central variable for the market.
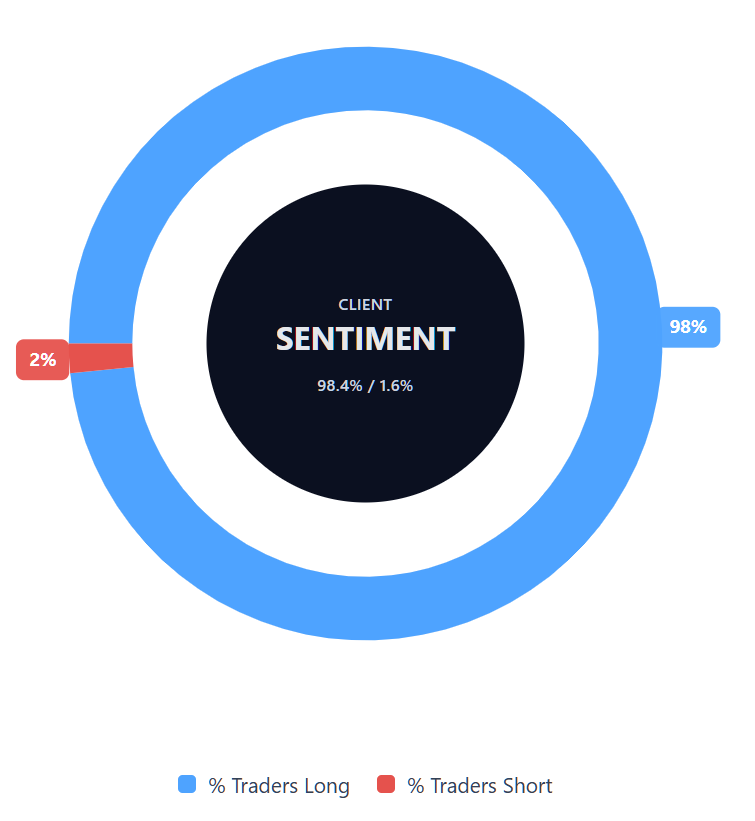
Capital.com’s client sentiment for Stellantis CFDs
As of 4 March 2026, Capital.com client positioning in Stellantis CFDs is skewed: 98.4% long vs 1.6% short, which places sentiment firmly in one-sided territory towards longs. This snapshot reflects open positions on Capital.com and can change. Client sentiment can be volatile and does not predict future price movements.
Summary – Stellantis 2026
- STLAM trades at €6.53 as of 2:28 pm UTC on 4 March 2026, down approximately 30.9% year to date and 40.9% lower year on year.
- The 14-day RSI reads 40.5 (neutral), while ADX at 31.9 indicates an established downtrend remains in force; VWMA and Hull MA are the only Buy-aligned indicators.
- Management guided for mid-single-digit revenue growth in 2026 and is targeting a pivot away from an aggressive EV-first strategy towards combustion and hybrid segments.
- European auto registrations fell in January 2026, while intensifying competition from Chinese EV manufacturers continues to pressure margins across the sector.
Past performance is not a reliable indicator of future results.
FAQ
Who owns the most Stellantis stock?
What is the 5 year Stellantis share price forecast?
There is no single, reliable five-year STLAM stock forecast that the market agrees on. Most third-party analyst estimates are published as 12-month price targets, not as precise multi-year projections, and they can change quickly after results, guidance updates, or sector shifts. Longer-dated 'five-year' figures you may see online are often model-based scenarios rather than analyst consensus, so it’s best to treat them as illustrative rather than predictive.
Is Stellantis a good stock to buy?
Could Stellantis stock go up or down?
Should I invest in Stellantis stock?
Can I trade Stellantis CFDs on Capital.com?
Yes, you can trade Stellantis CFDs on Capital.com. Trading share CFDs lets you speculate on price movements without owning the underlying asset and to take long or short positions. However, contracts for difference (CFDs) are traded on margin, and leverage amplifies both profits and losses. You should ensure you understand how CFD trading works, assess your risk tolerance, and recognise that losses can occur quickly.