SoFi Technologies stock forecast: Capital raise pressure
SoFi Technologies is a US fintech company whose shares fell in early 2026 despite strong Q4 2025 results, as its December 2025 capital raise and wider market weakness weighed on sentiment. Past performance is not a reliable indicator of future results. Explore third-party SOFI price targets.
SoFi Technologies, Inc. (SOFI) is trading at $17.80 as of 3:03pm UTC on 18 March 2026, within an intraday range of $16.58–$18.02. Past performance is not a reliable indicator of future results.
Pressure on SOFI reflects a confluence of factors: broader US equity market weakness driven by geopolitical tensions, including the ongoing conflict in the Middle East and US–China technology export restrictions, which weighed on high-beta financial technology names through mid-March, alongside continued concern over credit quality in a deteriorating macroeconomic environment (Investopedia, 9 March 2026); and investor caution following the company's $1.5bn capital raise in December 2025, which was priced at $27.50 per share (Bloomberg, 4 December 2026). SoFi's Q4 2025 results, reported on 30 January 2026, showed net revenue of approximately $1.01bn, GAAP EPS of $0.13, and roughly 1 million new members added in the quarter, with management guiding for approximately 30% revenue growth in 2026 (Investing.com, 30 January 2026).
SoFi Technologies stock forecast 2026–2030: Third-party price targets
As of 18 March 2026, third-party SoFi Technologies stock predictions reflect a market reassessing the stock after a sustained drawdown from late-2025 highs, with consensus sitting well above the current $17.80 last price even as individual estimates span a wide range.
MarketBeat (consensus snapshot)
MarketBeat aggregates ratings from 18 Wall Street analysts covering SOFI, arriving at a consensus Hold rating and an average 12-month price target of $26.34, with the highest individual target at $31 and the lowest at $12. The aggregation notes that SOFI traded at $17.70, leaving shares well below their 50-day moving average of $22.47 and 200-day moving average of $25.76, with analysts flagging a forward price-to-earnings ratio of approximately 46.6 times and potential dilution risks as factors weighing on the consensus rating (MarketBeat, 12 March 2026).
Public.com (consensus overview)
Public.com reports an aggregated analyst SOFI stock forecast of $26.04 based on 13 analyst ratings, with a consensus rating of Hold. The platform notes that figure as a forward 12-month estimate, compiled amid management's full-year 2026 guidance of $0.60 EPS and Q1 2026 guidance of $0.12 EPS, as stated in SoFi's January 2026 earnings call (Public.com, 16 March 2026).
Yahoo Finance / Zacks (margin outlook)
Zacks, cited via Yahoo Finance, notes that SoFi's 2026 outlook emphasises margin expansion as scale and deposit funding help convert top-line growth into stronger profitability, underpinning a constructive earnings trajectory despite near-term share price pressure. The commentary points to scale efficiencies in SoFi's lending and technology platform segments as the primary drivers of the anticipated margin improvement, with the firm's FY 2026 guidance calling for approximately 30% revenue growth and approximately 34% adjusted EBITDA margins (Yahoo Finance, 12 March 2026).
Tickernerd (multi-analyst aggregation)
Tickernerd aggregates 31 Wall Street analyst estimates for SOFI, arriving at a median 12-month price target of $26 within a range of $12–$38, alongside an overall Buy-leaning composite rating of 6.6 out of 10. The distribution reflects 8 Buy, 10 Hold, and 4 Sell ratings, with the wide spread attributed to divergent views on SoFi's valuation premium relative to traditional banking peers and the pace of GAAP earnings growth (Tickernerd, 18 March 2026).
Predictions and third-party forecasts are inherently uncertain, as they cannot fully account for unexpected market developments. Past performance is not a reliable indicator of future results.
SOFI stock price: Technical overview
The SOFI stock price trades at $17.80 as of 3:03pm UTC on 18 March 2026, sitting below every major simple moving average on the daily chart, with the 20-, 50-, 100- and 200-day SMAs stacked at $18.45 / $21.66 / $24.88 / $23.71 respectively according to TradingView data – a bearish descending alignment which in turn could place the current price in negative-average territory across all standard timeframes.
Momentum remains subdued, with some signs that downside pressure may be moderating: the 14-day RSI reads 35.59, in lower-neutral territory and approaching, but not yet at, a conventional oversold threshold, while the ADX at 42.47 confirms an established downtrend and indicates that the recent move has had notable trend strength. The Hull moving average (9) at $17.30 sits just below the current price and registers a buy signal, though it is a short-horizon indicator and the broader moving-average stack remains in sell alignment.
The first area in focus on the upside is the classic R1 pivot at $21.64. A convincing daily close above that level would indicate scope for price to test R2 near $25.53 and would also put greater attention on the dominant sell structure from the longer-dated SMAs. The classic pivot point (P) at $19.48 acts as the immediate overhead reference within the intraday range, and any recovery attempt would need to reclaim that level on a closing basis before the R1 zone becomes relevant.
On pullbacks, initial support sits at the S1 classic pivot of $15.59, which is the next meaningful reference below today's intraday low of $16.58. Losing that level on a daily close could risk a deeper move towards the S2 area near $13.43. The 100-day SMA at $24.88 and 200-day SMA at $23.71 now act as overhead resistance shelves rather than support, underlining how extended the current drawdown from late-2025 levels has become (TradingView, 18 March 2026).
This is technical analysis for informational purposes only and does not constitute financial advice or a recommendation to buy or sell any instrument.
SoFi Technologies share price history (2024–2026)
SOFI’s stock price traded near $6.95 in March 2024, closing the year at $15.43 on 31 December 2024, a gain of roughly 122% over 2024 as improving profitability expectations and rising fintech sentiment lifted the stock.
2025 opened on a constructive note, with SOFI touching an intraday high of $18.52 on 27 January before pulling back. The picture darkened sharply from April, when tariff-driven market turbulence dragged the stock to an intraday low of $8.45 on 7 April 2025 – its lowest point in the two-year window. A recovery followed, with the shares more than tripling from that trough to an intraday peak of $32.50 on 13 November 2025, as strong Q3 results and renewed risk appetite across fintech fuelled a sharp re-rating. SOFI ended 2025 at $26.16.
The year started strongly in 2026, with the stock printing a further intraday high of $29.90 on 5 January before a sustained retreat began. By 30 January, SOFI had slipped back to $22.91 – the sharpest single-month reversal since the April 2025 sell-off – and the slide continued through February and into March as broader macro uncertainty weighed on high-beta names.
SOFI closed at $17.94 on 18 March 2026, approximately 31.4% down year to date and roughly 49.1% higher year on year.
Past performance is not a reliable indicator of future results. Share prices are indicative and may differ from live market prices.
SoFi Technologies (SOFI): Capital.com analyst view
SoFi Technologies' price trajectory over the past two years reflects a company in transition that is moving from persistent loss-making to GAAP profitability, while its share price has remained highly sensitive to shifts in macro sentiment. The stock's near-285% recovery from its April 2025 lows to November's intraday peak of $32.50 illustrates how quickly confidence can return when earnings momentum aligns with a supportive risk environment. That said, the subsequent retreat to around $17.80 by March 2026 – a drawdown of roughly 45% from that high – underscores how quickly the same sensitivity can work in reverse, particularly when broader equity markets face pressure from tariff uncertainty and rising rate expectations.
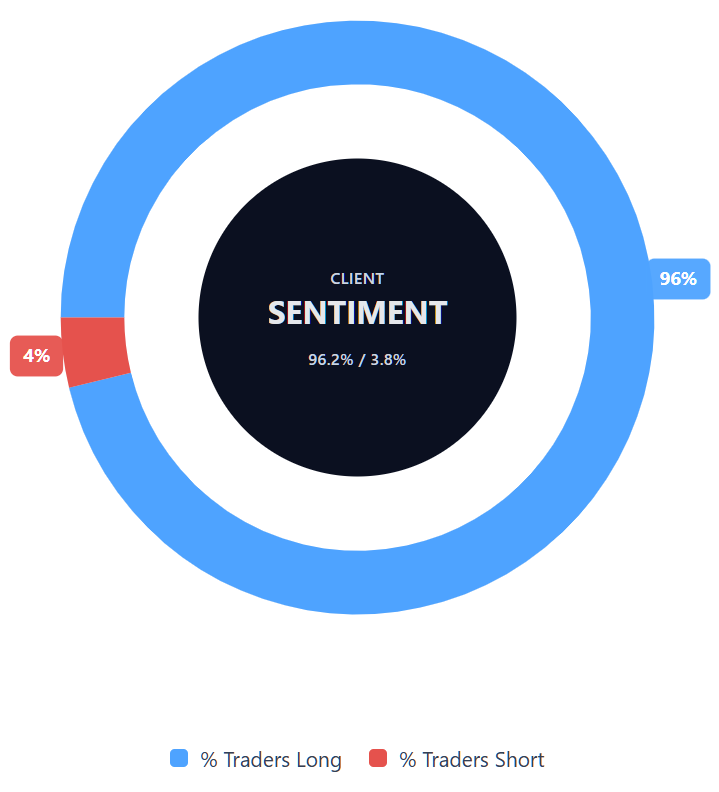
Capital.com’s client sentiment for SoFi Technologies CFDs
As of 18 March 2026, Capital.com client positioning in SoFi Technologies CFDs is 96.2% long compared with 3.8% short, putting buyers ahead by 92.4 pp and placing sentiment firmly in a heavy-buy, one-sided-long territory. This snapshot reflects open positions on Capital.com and can change.
Summary – SoFi Technologies 2026
- SOFI trades at $17.80 as of 3:03pm UTC on 18 March 2026, down roughly 31% year to date from a $26.16 year-end 2025 close.
- Key drivers include macro uncertainty tied to US tariff policy and geopolitical tensions, high-beta sensitivity to broader fintech and equity sell-offs, and post-earnings multiple compression.
- SoFi reported record Q4 2025 net revenue of approximately $1.01bn with GAAP EPS of $0.13, and guided for approximately 30% revenue growth and 52% adjusted EBITDA growth in 2026.
Past performance is not a reliable indicator of future results.
FAQ
Who owns the most Advanced Micro Devices stock?
What is the 5 year Advanced Micro Devices share price forecast?
Is Advanced Micro Devices a good stock to buy?
Could Advanced Micro Devices stock go up or down?
Should I invest in Advanced Micro Devices stock?
Can I trade Advanced Micro Devices CFDs on Capital.com?
Yes, you can trade SoFi Technologies CFDs on Capital.com. Trading share CFDs lets you speculate on price movements without owning the underlying asset and to take long or short positions. However, contracts for difference (CFDs) are traded on margin, and leverage amplifies both profits and losses. You should ensure you understand how CFD trading works, assess your risk tolerance, and recognise that losses can occur quickly.