SAP SE stock forecast: Q4 backlog 25% drives 14–16% slide
SAP SE is a German enterprise software group; shares fell 14–16% on 29 Jan 2026 after Q4 2025 cloud backlog rose 25% (cc), below ~26% expectations. Explore third-party SAP price targets and technical analysis. Past performance is not a reliable indicator of future results.SAP SE (SAP) is trading at €172.4 as of 12:34pm UTC on 6 March 2026, within an intraday range of €166.7–€174.2. Past performance is not a reliable indicator of future results.
Pressure on the shares has persisted since SAP reported Q4 2025 results on 29 January 2026, when cloud backlog growth of 25% at constant currencies came in below analyst expectations of approximately 26%, triggering a 14–16% single-session decline despite non-IFRS operating profit rising 31% to €10.42bn and free cash flow nearly doubling to €8.24bn (Investing.com, 29 January 2026). For 2026, SAP has guided for cloud revenue of €25.8–26.2bn, up 23–25% at constant currencies, with non-IFRS operating profit of €11.9bn–12.3bn (SAP, accessed 6 March 2026). Broader European equity sentiment has also weighed on the stock, with the pan-European STOXX 600 facing a mixed session amid ongoing Middle East geopolitical tensions earlier in the week, while short interest in SAP rose 56.4% between 29 January and 13 February 2026 (MarketBeat, 1 March 2026).
SAP SE stock forecast 2026–2030: Third-party price targets
As of 6 March 2026, third-party SAP SE stock predictions have undergone significant revision since the company’s Q4 2025 earnings report on 29 January 2026, with brokers and consensus trackers adjusting targets through late February and early March to reflect lower cloud growth expectations. The following targets summarise the most recent assessments from leading sources.
BMO Capital Markets (target cut, Outperform maintained)
BMO Capital Markets lowers its 12-month SAP stock forecast to $245 from $320, while reiterating an Outperform rating. The bank flags that SAP’s Q4 2025 cloud backlog growth of 25% at constant currencies came in below the 26% level management had indicated was achievable. BMO revises its FY26 cloud growth assumption to 24% year on year in constant currency, though the firm retains a constructive view on SAP’s ongoing ERP-to-cloud migration story (The Globe and Mail, 31 January 2026).
MarketBeat (52-week low note, March 2026 update)
MarketBeat reports that SAP hit a new 52-week intraday low of $187.94 on 3 March 2026, last trading at $188.61, as Zacks upgrades the stock to Strong Buy – citing a recovery setup – while Wall Street Zen downgrades to Hold, citing valuation risk; the average price target across 20 analysts remains $305.75 as of that date, with the spread between the current price and average target widening materially. The report notes that SAP’s PE ratio stands at 27.3 against a market cap of $236.41bn, with the stock trading approximately 25% below its 200-day simple moving average of $246.62 (MarketBeat, 3 March 2026).
UBS (Buy maintained, target reduced)
UBS lowers its price target on SAP to €205 from €255, while maintaining a Buy rating, after analyst Michael Briest conducted an AI displacement stress test across Europe’s software sector. Briest identifies SAP as relatively well shielded from AI substitution risk, alongside Dassault Systèmes and Amadeus, given the embedded complexity of SAP’s enterprise solutions, though he adjusts the target downward to align with the sector’s reset valuation multiples (MarketScreener, 5 March 2026).
Predictions and third-party forecasts are inherently uncertain, as they cannot fully account for unexpected market developments. Past performance is not a reliable indicator of future results.
SAP stock price: Technical overview
The SAP stock price trades at €172.4 as of 12:34pm UTC on 6 March 2026, sitting below all key moving averages on the daily chart, with the 20/50/100/200-day SMAs stacked at ~201 / 220 / 237 / 261 in a bearish alignment. The 10-day SMA at ~199 and 10-day EMA at ~199 form the nearest overhead shelf, while the Hull moving average (9) at ~196 provides the only buy signal in the MA complex.
Momentum is subdued: the 14-day RSI sits at 43.05, in neutral territory and leaning toward the lower half of the range, while the ADX(14) at 29.41 indicates an established directional trend, consistent with the prevailing downward pressure. The awesome oscillator prints at -12.48 and MACD at -6.08, both in negative territory, reinforcing the weak near-term tone.
To the topside, the classic R1 at ~213 is the first level to reclaim; a daily close above that level would put R2 near ~225 in view and begin to challenge the base of the broader MA stack. The 200 area figure, roughly coinciding with the 10-day SMA cluster, acts as the immediate resistance ceiling before R1.
On pullbacks, the classic pivot (P) at ~201 marks the first reference above current price, confirming that SAP trades through all standard support layers. Initial downside support rests at S1 near ~190, with S2 at ~177 the next meaningful reference should S1 give way on a sustained daily close below; losing the S1 area would risk a move toward that lower band (TradingView, 6 March 2026).
This is technical analysis for informational purposes only and does not constitute financial advice or a recommendation to buy or sell any instrument.
SAP SE share price history (2024–2026)
SAP’s stock price opened March 2024 around €178 and spent much of the spring consolidating in the €165–€183 range. The stock then built momentum steadily through the summer and autumn of 2024, climbing from lows near €181 in early August toward €245 by year-end – closing 2024 at €236.50 on 30 December.
The rally extended sharply into early 2025, with SAP reaching a two-year high of €283.80 on 19 February 2025 amid broad European tech strength. That peak proved difficult to sustain; the stock began to ease through late February and into March 2025, closing at €261.95 on 6 March 2025. A more pronounced sell-off followed SAP’s Q4 2025 earnings on 29 January 2026, when shares collapsed from an open of €179.70 to close at €164.70 in a single session – the steepest single-day decline in the dataset. SAP closed at €172.85 on 6 March 2026, approximately 34.0% down year on year and around 39.0% below the February 2025 peak of €283.80.
Past performance is not a reliable indicator of future results. Share prices are indicative and may differ from live market prices.
SAP SE (SAP): Capital.com analyst view
SAP’s share price has faced sustained pressure since the start of 2026, with the Q4 2025 earnings report acting as a catalyst for a sharp reset in market expectations. The cloud backlog miss, though modest in percentage terms, raised questions about near-term growth visibility at a time when investors had priced in a more optimistic trajectory. That said, SAP’s underlying fundamentals, including near-doubling free cash flow and a 31% rise in non-IFRS operating profit, suggest a more nuanced picture than the share price move alone might imply.
On the other hand, the structural shift toward cloud and AI-integrated enterprise software remains a longer-term consideration that analysts continue to weigh against the current valuation reset. Bears may point to rising short interest and persistent trading below key moving averages as signs that sentiment has not yet stabilised; bulls could argue the current price, trading well below parts of the consensus analyst target range, already reflects much of the near-term uncertainty. Both interpretations carry merit, and the outlook remains open to revision as further data emerges.
Capital.com’s client sentiment for SAP SE CFDs
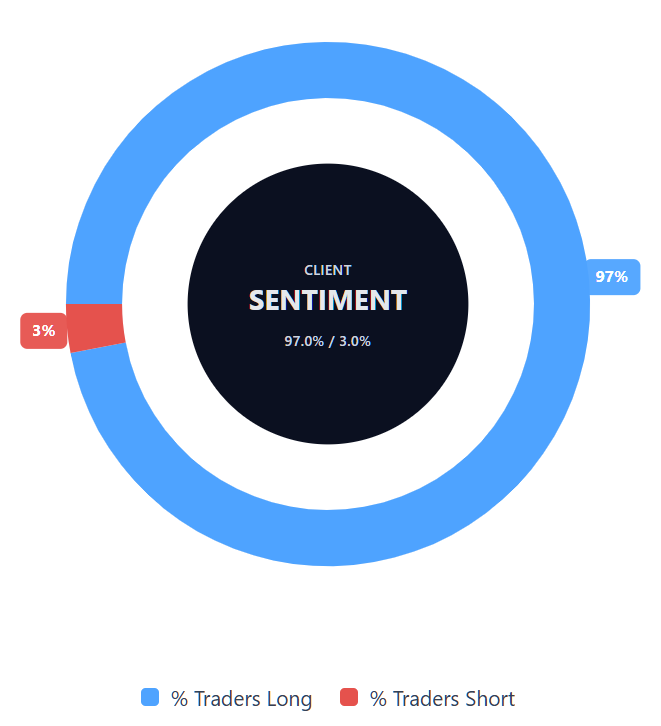
As of 6 March 2026, Capital.com client positioning in SAP SE CFDs is skewed toward longs, with buyers at 97% versus sellers at 3%, putting buyers ahead by 94 percentage points and placing sentiment firmly in one-sided territory toward longs. This snapshot reflects open positions on Capital.com and can change rapidly as market conditions evolve.
Summary – SAP SE 2026
- SAP trades at €172.4 as of 12:34pm UTC on 6 March 2026, around 34% below its February 2025 two-year high of €283.80.
- All key moving averages sit above the current price, with a bearish alignment; the 14-day RSI at 43.05 reflects neutral-to-weak momentum.
- The primary price driver remains the Q4 2025 earnings reset, with cloud backlog growth of 25% missing expectations and triggering a sharp single-session sell-off on 29 January 2026.
- Broader European equity weakness, rising short interest, and ongoing macroeconomic uncertainty have added to downward pressure since the earnings event.
Past performance is not a reliable indicator of future results.
FAQ
Who owns the most SAP stock?
SAP has a widely held share register, with a large proportion classified as free float. SAP’s investor relations materials indicate that free float (excluding treasury shares and strategic founder holdings, under the Frankfurt Stock Exchange definition) stood at 84% as of 31 December 2025. The largest single holders are typically long-term institutional investors and index funds, alongside founder-related strategic stakes. Reported top holders can change over time as funds rebalance and disclosures update.
What is the 5 year SAP share price forecast?
Five-year price SAP stock forecast are not standardised and can vary widely depending on methodology, assumptions, and starting date. In practice, most widely followed forecasts focus on the next 12 months, such as broker price targets that were revised after SAP’s Q4 2025 results. Longer-range projections are typically scenario-based and may not reflect future fundamentals, market conditions, or unexpected events. Treat any five-year estimate as illustrative rather than predictive.
Is SAP a good stock to buy?
Whether SAP is 'good' depends on your objectives, time horizon, and risk tolerance. The article highlights a sharp repricing after the Q4 2025 earnings reset, alongside stronger operational metrics such as higher non-IFRS operating profit and increased free cash flow. At the same time, technical indicators show the price below key moving averages, and sentiment factors (including short interest) may add volatility. This information is general and isn’t a recommendation to buy or sell.
Could SAP stock go up or down?
Yes. SAP’s share price can move in either direction, and the recent range illustrates how quickly expectations can shift after earnings. Potential drivers include future updates on cloud backlog and revenue growth, broader European equity sentiment, macroeconomic and geopolitical developments, and changes in positioning such as short interest. Technical levels may also influence short-term trading behaviour, though they don’t predict outcomes. As with any equity, there’s a risk of losses as well as gains.
Should I invest in SAP stock?
Only you can decide, and it’s usually best to assess decisions in the context of your overall finances and risk appetite. This article outlines both supportive factors (such as SAP’s profitability and cash flow trends) and risk factors (including the post-earnings reset, weak technical structure, and uncertainty around growth assumptions). If you’re considering investing, you may want to review SAP’s filings and guidance, compare alternative exposures, and consider independent advice where appropriate.
Can I trade SAP CFDs on Capital.com?
Yes, you can trade SAP SE CFDs on Capital.com. Trading share CFDs lets you speculate on price movements without owning the underlying asset and to take long or short positions. However, contracts for difference (CFDs) are traded on margin, and leverage amplifies both profits and losses. You should ensure you understand how CFD trading works, assess your risk tolerance, and recognise that losses can occur quickly.