Nike stock forecast: Third-party price targets
Nike Inc. is a US-listed multinational sportswear company trading on the New York Stock Exchange under the ticker NKE, with operations spanning footwear, apparel and equipment across global markets. Explore third-party NKE price targets and technical analysis.
Nike, Inc. (NKE) is trading around $63.22 in intraday dealings on 11 February 2026, moving within Capital.com’s stated session range of $62.36-$63.92 as of 12:04pm UTC. Past performance is not a reliable indicator of future results.
The stock continues to trade following Nike’s fiscal second-quarter 2026 results. The company reported revenue of about $12.4bn, up roughly 1% year on year on a reported basis and flat on a currency-neutral basis (Barchart, 18 December 2025). Broader market conditions also form part of the backdrop. S&P 500 futures were fractionally higher by around 0.1% on 11 February 2026 ahead of key US macroeconomic releases (Investopedia, 11 February 2026), while options markets recently implied a short-dated expected move of just under 3% for NKE into mid-February expiries (Optioncharts.io, 11 February 2026).
Nike stock forecast 2026–2030: Third-party price targets
As of 11 February 2026, third-party Nike stock predictions span $62 to $115 on a 12-month horizon, with dispersion reflecting different assumptions about demand, margins and valuation. These third-party projections are subject to change and may diverge materially from actual outcomes as new company data and macroeconomic developments emerge.
Goldman Sachs (target revision)
The Goldman Sachs Group lowers its 12-month Nike price target to $76 from $77, while maintaining a buy rating. The firm cites better-than-expected quarterly earnings and revenue, alongside what it described as a constructive long-term growth profile, while highlighting near-term profitability and inventory trends as key variables (MarketBeat, 31 January 2026).
MarketBeat (consensus snapshot)
MarketBeat states that Nike holds a ‘Moderate Buy’ consensus from 38 analysts, with an average 12-month price target in the mid-$70s region (around $75). The report notes that this aggregate view combines buy, hold and a small number of sell ratings, as analysts weigh modest revenue growth against margin pressure and competitive dynamics (MarketBeat, 19 January 2026).
AnaChart (target database)
AnaChart shows Nike covered by roughly two dozen analysts, with an average price target slightly above $79 and a published range from about $62 to $115. This spread implies a potential double-digit percentage gap relative to recent prices, although outcomes will depend on future company performance and market conditions. The platform notes that its most recent logged forecast came from BTIG on 27 January 2026, and that its broader database includes over 1,000 documented price targets for the stock (AnaChart, 5 February 2026).
StockAnalysis (consensus and recent actions)
StockAnalysis reports that 25 analysts covering Nike assign a consensus rating of ‘Buy’ and an average 12-month price target around $78. The site frames this as implying low-to-mid-20% upside from the then-current share price and highlights rating actions in January 2026 from brokers such as KeyBanc and Needham, noting that these revisions followed earnings updates and changes in expectations for consumer demand (StockAnalysis, 11 February 2026).
Public.com (retail-facing summary)
Public.com lists a Wall Street analyst price target for Nike of about $78.54, presented as a 12-month objective relative to the platform’s prevailing quote at the time. The summary states that this figure aggregates estimates from several covering analysts and may adjust as reported results and macroeconomic conditions evolve (Public.com, 11 February 2026).
Predictions and third-party forecasts are inherently uncertain, as they cannot fully account for unexpected market developments. Past performance is not a reliable indicator of future results.
NKE stock price: Technical overview
The NKE stock price is trading near $63.22 as of 12:04pm UTC on 11 February 2026. The 20-, 50-, 100- and 200-day simple moving averages (SMAs) cluster around $64, $64, $65 and $67 respectively, leaving the price marginally below much of the short- and medium-term trend band. The 10-day SMA and exponential moving average (EMA), both near $63, sit just below spot, while the Hull moving average and volume-weighted moving average (VWMA) around $63-64 highlight a tight near-term balance around the current pivot area.
The 14-day relative strength index (RSI) stands around 48.5, in neutral territory. The average directional index (ADX) near 13.6 indicates a weak trend environment. The moving average convergence divergence (MACD) remains slightly negative, while shorter-term momentum measures, including the Awesome Oscillator, tilt modestly positive.
Classic resistance is first marked at $65.62 and then $69.43. A sustained daily close above the $65-66 area would bring the upper pivot band into focus. On the downside, the $63.32 Classic Pivot acts as initial support. A move below this level could expose the $59.51 S1 zone, which may open the way towards lower pivot-based support areas (TradingView, 11 February 2026).
This technical analysis is for informational purposes only and does not constitute financial advice or a recommendation to buy or sell any instrument.
Nike share price history (2024–2026)
NKE’s stock price has undergone a multi-quarter repricing over the past two years, moving from triple-digit levels in early 2024 back to the mid-$60s by February 2026. The share price closed at $106.40 on 14 February 2024, fell below $100 in March and then trended lower through the remainder of the year, ending 2024 at $75.86 on 31 December as valuations moderated.
In 2025, NKE extended that downward trajectory. After closing at $82.65 on 27 June, the stock moved into the high-$50s during April and May before finishing the year at $64.03 on 31 December 2025. By 11 February 2026, Nike shares had edged slightly higher to close at $64.05, leaving the price broadly flat relative to late 2025 levels but still well below the $90-100 range seen in the first half of 2024.
Past performance is not a reliable indicator of future results. Share prices are indicative and may differ from live market prices.
Nike (NKE): Capital.com analyst view
Nike’s share price has retraced from the high-$90s and low-$100s recorded in early 2024 to trade in the mid-$60s by February 2026, reflecting a multi-quarter adjustment following weaker financial performance and a more challenging consumer backdrop. In fiscal 2025, Nike reported revenue of about $46.3bn, down nearly 10% year on year, with earnings declining by more than 40%. These results have influenced market sentiment, although more recent quarters indicate sequential revenue improvement and some stabilisation in operating trends.
Brand indicators have also shown tentative improvement. Nike returned to the top 20 of the Lyst Index in Q4 2025, and secondary-market data has pointed to renewed interest in core footwear lines. However, stronger brand metrics do not necessarily translate directly into sustained share price appreciation, as equity performance also depends on margins, cash flow and broader market conditions.
From a price-driver perspective, some market participants point to a clearer product strategy, collaborations such as NikeSkims and firmer demand in selected categories as factors that could support margins if execution improves. Others highlight cooling global footwear demand, earlier revenue contraction and ongoing competitive pressures as risks, particularly if consumer spending weakens or new launches underperform expectations.
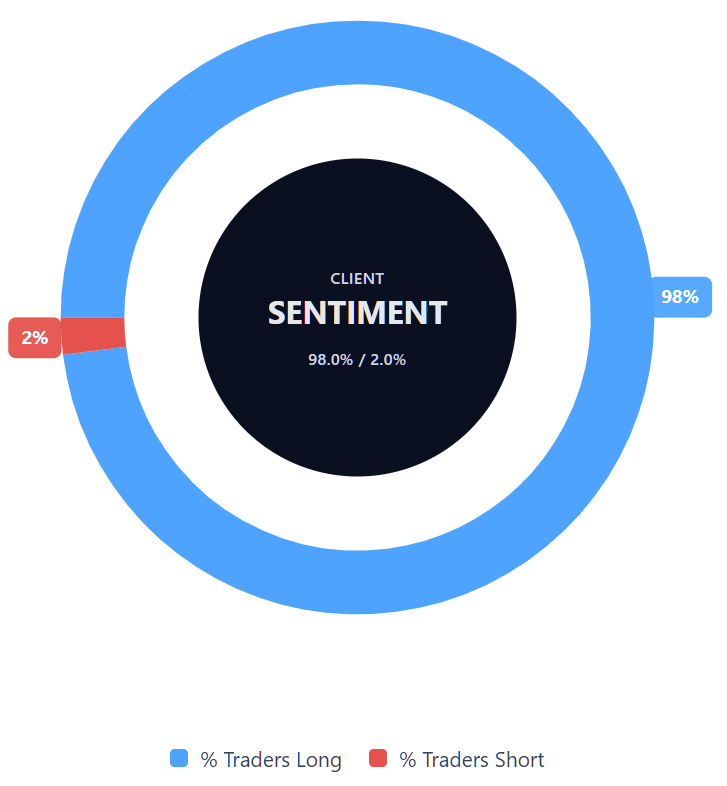
Capital.com’s client sentiment for Nike CFDs
As of 11 February 2026, Capital.com client positioning in Nike CFDs shows 98% of open positions long and 2% short. This data reflects current open positions on the platform and may change as market conditions evolve.
Summary – Nike 2026
- Nike’s share price has declined from above $100 in early 2024 to the mid-$60s by 11 February 2026, reflecting a multi-quarter reset in valuation and earnings expectations.
- Technical indicators show the price trading just below clustered 20-, 50-, 100- and 200-day moving averages in the mid-$60s, with the RSI in neutral territory and the ADX signalling a weak overall trend.
- Recent company results and brand data present mixed signals. Earlier revenue and earnings declines contrast with indications of stabilising demand and incremental improvement in brand visibility, while competitive and macroeconomic risks remain relevant.
Past performance is not a reliable indicator of future results.
FAQ
Who owns the most Nike stock?
What is the 5-year Nike share price forecast?
Is Nike a good stock to buy?
Could Nike stock go up or down?
Should I invest in Nike stock?
Can I trade Nike CFDs on Capital.com?
Yes, you can trade Nike CFDs on Capital.com. Trading share CFDs lets you speculate on price movements without owning the underlying asset and to take long or short positions. However, contracts for difference (CFDs) are traded on margin, and leverage amplifies both profits and losses. You should ensure you understand how CFD trading works, assess your risk tolerance, and recognise that losses can occur quickly.