Merck stock forecast: Third-party price targets
Merck & Company is a US pharmaceutical company listed on the NYSE, with operations spanning oncology, vaccines and prescription medicines, and a share price influenced by earnings results, clinical data and policy developments. Explore third-party MRK price targets and technical analysis.
Merck & Company, Inc. (MRK) is trading around $116.29 in intraday dealing as of 2:34pm UTC on 11 February 2026, within a session range of $116.08 to $117.49. Past performance is not a reliable indicator of future results.
The stock is trading in the wake of Merck’s recent fourth-quarter and full-year 2025 earnings release, in which the company reported updated revenue and profit figures alongside guidance on its key pharmaceutical franchises and pipeline developments (Yahoo Finance, 3 February 2026). Trading also reflects continued focus on major oncology and vaccines products outlined in its latest investor materials (The Globe and Mail, 3 February 2026). Broader US equity conditions and healthcare sector moves remain relevant, with MRK trading against a backdrop of large-cap pharmaceutical peers reacting to earnings season headlines and ongoing policy discussions on drug pricing in the United States (Reuters, 3 February 2026).
Merck stock forecast 2026–2030: Third-party price targets
As of 11 February 2026, third-party Merck stock predictions reflect differing assumptions about earnings and the company’s 2026 guidance. These targets are generally framed as 12-month objectives based on updated models following Merck’s fourth-quarter 2025 results and 2026 revenue and EPS outlook.
MarketBeat (consensus snapshot)
MarketBeat reports that Merck carries a consensus rating of Hold with an average 12-month price target of about $114.53, based on a mix of Buy, Hold and Sell recommendations. The service notes that this consensus reflects diverging analyst reactions to Merck’s recent earnings performance and expectations for 2026 revenue and earnings under its updated outlook (MarketBeat, 27 January 2026).
Benzinga (recent rating trio)
Benzinga reports an average MRK stock forecast of $126.67 across recent analyst targets. The article states that these estimates, which include Guggenheim’s latest increase, sit above the broader consensus as analysts factor in longer-term growth drivers alongside softer 2026 guidance (Benzinga, 7 February 2026).
Guggenheim (broker report)
Guggenheim set a 12-month price target of $140 for Merck. The firm cites longer-term growth prospects in key franchises and pipeline assets, alongside updated assumptions following Merck’s February earnings and outlook, while acknowledging that 2026 guidance came in below some earlier market expectations (Investing.com, 6 February 2026).
Stockscan (independent model-based forecast)
Stockscan shows an average Merck price target of $143.37. The site frames this as part of a longer-term projection path using historical price behaviour and technical indicators, rather than a broker research model directly tied to Merck’s formal 2026 guidance (StockScan, 11 February 2026).
Predictions and third-party forecasts are inherently uncertain, as they cannot fully account for unexpected market developments. Past performance is not a reliable indicator of future results.
MRK stock price: Technical overview
The MRK stock price is trading around $116.29 as of 2:34pm UTC on 11 February 2026, holding above a rising daily moving-average cluster, with the 20-, 50-, 100- and 200-day SMAs near 112, 107, 97 and 89 respectively. A 20-over-50 alignment remains in place, while the 10-day SMA around 115 and the Ichimoku base line near 114 provide a nearer support band beneath spot. The 14-day RSI stands near 63 in the upper-neutral range, and an ADX reading around 35 signals an established trend backdrop rather than a range-bound environment.
On the topside, the nearest classic pivot resistance sits at R1 around 114, with R2 near 118 if the price sustains a daily close above the first level. On pullbacks, the classic pivot at about 109 marks initial support, with S1 near 106 as the next downside reference if that area gives way. The 100-day SMA around 97 represents a deeper moving-average reference (TradingView, 11 February 2026).
This technical analysis is provided for informational purposes only and does not constitute financial advice or a recommendation to buy or sell any instrument.
Merck share price history (2024–2026)
MRK’s stock price has shifted higher overall over the past two years, moving from the high $80s to low $100s in early 2024 to trade in triple digits by early 2025. By 11 February 2025, MRK closed at $86.84. The stock then recorded a series of gains through mid- to late 2025, finishing the year at $106.03 – marking a notable change from the sub-$100 range that characterised parts of the prior period.
Momentum extended into early 2026, with MRK rising from $106.68 at the start of January to around $116.50 by 11 February 2026, after briefly trading above $122 earlier that month. This places the share price roughly $30 above levels seen two years earlier and about $10 higher than at the turn of the year, illustrating a move from a relatively range-bound phase in 2024 to firmer upward price action through 2025 and into 2026, while acknowledging that past performance does not guarantee future results.
Past performance is not a reliable indicator of future results. Share prices are indicative and may differ from live market prices.
Merck (MRK): Capital.com analyst view
Merck & Company’s share price around $116.29 as of 2:34pm UTC on 11 February 2026 sits above a rising band of medium- and longer-term moving averages, suggesting the stock has generally found support on declines in recent weeks rather than entering a sustained downtrend. This positioning may reflect investor attention on Merck’s scale in oncology and vaccines, as well as its late-stage pipeline. At the same time, valuation can remain sensitive to clinical outcomes, regulatory decisions, competitive developments and changes in sector sentiment.
Recent price action appears linked to the company’s latest earnings update and 2026 outlook, alongside broader moves in US healthcare equities and ongoing debate over drug pricing and reimbursement. These factors can influence how market participants assess Merck’s future cash flows. Stronger operating trends, pipeline progress or a more supportive policy backdrop could underpin the shares by improving perceived earnings visibility, while setbacks on key products, tighter pricing dynamics or rotation away from defensive healthcare names could weigh on the stock and increase volatility.
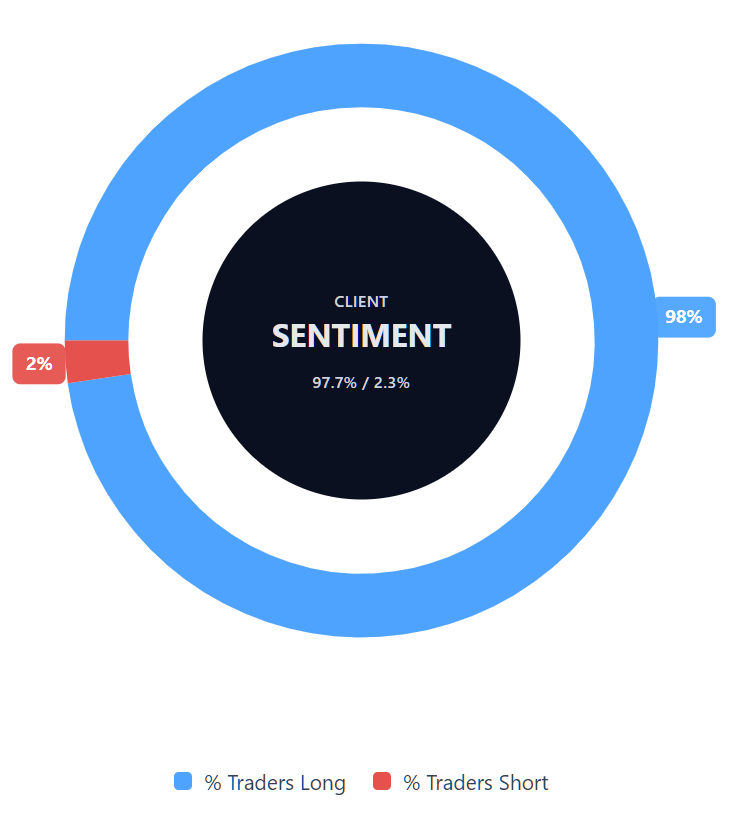
Capital.com’s client sentiment for Merck CFDs
As of 11 February 2026, Capital.com client positioning in Merck & Company CFDs shows 97.7% buyers versus 2.3% sellers, a pronounced long bias that puts buyers ahead by about 95.5 percentage points. This one-sided tilt highlights a strong directional preference among current CFD positions, while not indicating how future sentiment or price action may evolve. This snapshot reflects open positions on Capital.com and can change.
Summary – Merck 2026
- Merck & Company (MRK) is quoted around $116.29 as of 2:34pm UTC on 11 February 2026, trading within an intraday range of $116.08 to $117.49.
- The price sits above a rising cluster of medium- and longer-term daily moving averages, suggesting recent pullbacks have tended to find support rather than develop into a prolonged downtrend.
- Technical readings place the 14-day RSI in an upper-neutral zone, with an established trend backdrop indicated by the ADX, while key pivot levels frame nearby support and resistance.
- Recent trading reflects the interaction between Merck’s latest earnings release and 2026 outlook, broader moves in large-cap US healthcare, and ongoing debate over US drug pricing and reimbursement, all of which may continue to shape price behaviour.
Past performance is not a reliable indicator of future results.
FAQ
Who owns the most Merck stock?
Merck & Company is largely held by institutional investors, including global asset managers, pension funds and exchange-traded funds. Large investment firms such as Vanguard, BlackRock and State Street often rank among the largest shareholders, based on public filings. These holdings can change over time as funds adjust their allocations. Retail investors and company insiders also hold shares, though typically in smaller proportions relative to major institutions.
What is the 5-year Merck share price forecast?
There is no single agreed five-year MRK stock forecast. Most published analyst targets focus on a 12-month horizon, reflecting updated earnings models and company guidance. Longer-term projections tend to vary significantly, as they depend on assumptions about pipeline progress, patent expiries, competitive dynamics and pricing policy. Investors often treat long-range forecasts as scenario-based estimates rather than precise predictions, given the number of variables involved.
Is Merck a good stock to buy?
Whether Merck is considered a ‘good’ stock depends on an individual’s objectives, risk tolerance and time horizon. Analysts refer to factors such as its oncology and vaccines portfolio, pipeline developments and cash flow profile, while also noting exposure to regulatory decisions, patent expiries and sector pricing pressures. Share prices can move higher or lower in response to company-specific developments and broader market conditions, so outcomes remain uncertain. This information is general in nature and does not constitute investment advice.
Could Merck stock go up or down?
Merck’s share price can move in either direction. Positive clinical data, earnings results, regulatory approvals or changes in policy may influence market expectations. Conversely, weaker guidance, trial setbacks, competitive pressures or broader market volatility could weigh on the stock. As with all equities, price behaviour reflects shifting expectations and external conditions, and past performance is not a reliable indicator of future results.
Should I invest in Merck stock?
Only you can decide whether investing in Merck aligns with your financial goals and risk profile. Before making any decision, consider factors such as diversification, time horizon and the potential for both gains and losses. Reviewing independent research and, where appropriate, seeking regulated financial advice may help you assess suitability. This content is for general information only and does not constitute investment advice.
Can I trade Merck CFDs on Capital.com?
Yes, you can trade Merck CFDs on Capital.com. Trading share CFDs lets you speculate on price movements without owning the underlying asset and to take long or short positions. However, contracts for difference (CFDs) are traded on margin, and leverage amplifies both profits and losses. You should ensure you understand how CFD trading works, assess your risk tolerance, and recognise that losses can occur quickly.