Intesa Sanpaolo stock forecast: €9.3bn profit and 2026–2029 plan
Intesa Sanpaolo is an Italian banking group listed on the Borsa Italiana, trading as markets assess its €9.3bn full-year 2025 net income and newly announced 2026–2029 business plan. Explore third-party ISP price targets and technical analysis.
Intesa Sanpaolo S.p.A. (ISP) is trading around €5.90 in late European dealings on 23 February 2026, holding slightly above an earlier intraday range between €5.74 and €5.90, as indicated by Capital.com’s quote feed at 11:51am (UTC). Past performance is not a reliable indicator of future results.
The stock trades amid ongoing focus on the bank’s recently reported 2025 results. Intesa Sanpaolo posted quarterly consolidated net income of €1.733bn in Q4 2025 and full-year net income of €9.3bn, alongside a cost/income ratio of 51.8% in Q4 and higher fee and commission income (Intesa Sanpaulo, 2 February 2026). Management also outlined a 2026–2029 business plan targeting structural cost reductions, increased lending, and growth in assets under management (Intesa Sanpaulo, 2 February 2026).
Broader sentiment towards European banks remains in view, with the Euro Stoxx Banks index tracking gains over the past month (STOXX, 23 February 2026). Ratings developments – including S&P Global Ratings revising Intesa Sanpaolo’s outlook to positive from stable earlier in February – have also shaped the backdrop (Intesa Sanpaulo, 2 February 2026).
Intesa Sanpaolo stock forecast 2026–2030: Third-party price targets
As of 23 February 2026, third-party Intesa Sanpaolo stock predictions cluster above the prevailing market price, with most institutions pairing their targets with Buy-type recommendations. These projections depend on macroeconomic conditions, bank-specific execution, and regulatory developments, and analysts may revise or withdraw them as new information emerges.
J.P. Morgan (broker rating update)
J.P. Morgan reiterates a Buy rating on Intesa Sanpaolo with a 12-month price target of €6.90 per share, stating there is no major change from its prior target. The analysts link their stance to expectations for earnings capacity and capital strength within the wider eurozone banking sector backdrop (MarketScreener, 3 February 2026).
UBS (broker rating update)
UBS maintains a Buy rating on Intesa Sanpaolo with a 12-month price target of €6.55 per share. The broker cites the bank’s earnings profile and capital return plans as key elements in its valuation framework, set against prevailing European interest rate and regulatory conditions (MarketScreener, 4 February 2026).
Morgan Stanley (single-stock target)
Morgan Stanley upholds a Buy rating on Intesa Sanpaolo and sets a 12-month price target of €7.20 per share. Its analysts highlight the bank’s return-on-equity profile and planned cash returns to shareholders as central inputs to the target, considered within Italian and broader European bank valuation metrics (The Globe and Mail, 4 February 2026).
Investing.com (multi-analyst poll)
Investing.com indicates an average 12-month Intesa Sanpaolo price target of about €6.67 per share, with individual estimates ranging from €4.50 to €7.40 and an overall Buy-leaning recommendation profile. The dispersion reflects differing assumptions on net interest income, fee growth, and capital distribution in the context of eurozone monetary policy (Investing.com, 23 February 2026).
Fintel (target range overview)
Fintel reports that, as of 23 February 2026, the average 12-month ISP stock forecast across its covered analysts stands at €6.61 per share, with a published range from €4.74 to €7.56. This spread highlights the variation in analyst assumptions rather than a single consensus outcome (Fintel, 23 February 2026).
Predictions and third-party forecasts are inherently uncertain, as they cannot fully account for unexpected market developments. Past performance is not a reliable indicator of future results.
ISP stock price: Technical overview
The ISP stock price trades near €5.90 as of 11:51am (UTC) on 23 February 2026, holding close to the classic pivot at €5.91 after testing an intraday band between €5.735 and €5.8975. On the daily chart, price remains above the 50-, 100-, and 200-day simple moving averages (SMAs), clustered around approximately €5.88, €5.73, and €5.43 respectively. The 20-day SMA sits slightly higher near €5.90, with price oscillating around this short-term average.
The 14-day relative strength index (RSI), at around 51, signals mid-range momentum, while the average directional index (ADX), near 17, suggests the trend lacks strong directional conviction. On the upside, traders may monitor the classic R1 pivot near €6.15, with R2 around €6.34 coming into view only if price records a sustained daily close above the €6.15 area. On pullbacks, the classic pivot at €5.91 may act as initial support, followed by the 100-day SMA near €5.73. A daily close below this zone could shift technical focus towards lower support levels identified by the S1 pivot area (TradingView, 23 February 2026).
This technical analysis is provided for informational purposes only and does not constitute financial advice or a recommendation to buy or sell any financial instrument.
Intesa Sanpaolo share price history (2024–2026)
ISP’s stock price has risen over the past two years, moving from around €2.97 at the close on 26 February 2024 to approximately €5.91 on 23 February 2026. During much of 2024, the stock consolidated below €4 before breaking higher in early 2025. It moved through the €4.50 area by late March and finished 2025 near €5.95.
In 2026 to date, ISP has traded largely between €5.70 and €6.05, recording an intraday high of €6.17 on 4 February 2026 before easing back towards the high €5.80s into late February. As of 23 February 2026, the share price remains close to recent highs relative to the past two years, though price fluctuations continue within a defined range.
Past performance is not a reliable indicator of future results. Share prices are indicative and may differ from live market prices.
Intesa Sanpaolo (ISP): Capital.com analyst view
Intesa Sanpaolo’s share price has recorded a two-year recovery, rising from below €3 in early 2024 to around €5.90 by late February 2026. The breakout above the €4–€4.50 zone during 2025 marked a shift in the stock’s medium-term structure. This period coincided with improved reported profitability and stronger year-end closing levels.
Some market participants may interpret these developments as consistent with a stronger earnings and capital profile. Others may argue that, after a substantial re-rating, the stock could prove more sensitive to changes in interest rate expectations, Italian economic data, or broader European banking sentiment. In early 2026, price action has narrowed into a relatively tight range in the high €5s to low €6s, suggesting consolidation following the earlier advance.
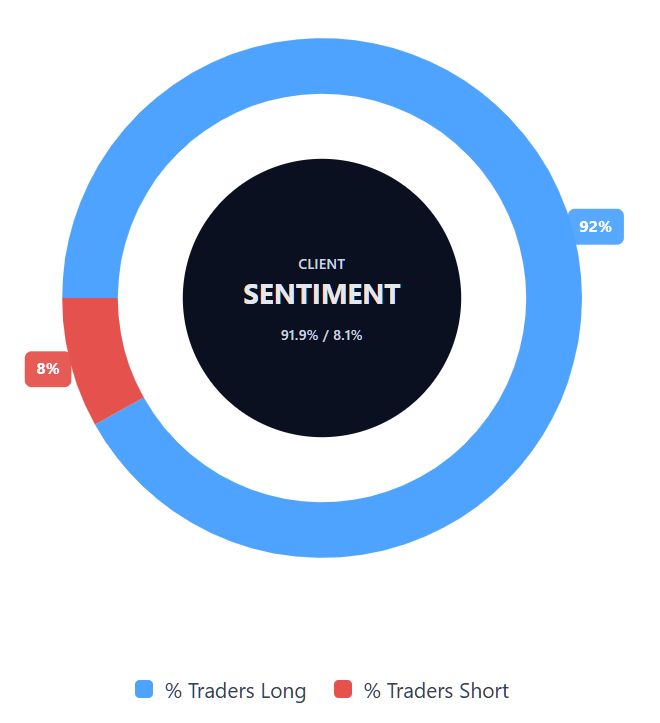
Capital.com’s client sentiment for Intesa Sanpaolo CFDs
As of 23 February 2026, Capital.com client positioning in Intesa Sanpaolo CFDs shows a clear skew towards long positions, with 91.9% of clients holding net long exposure and 8.1% net short. This imbalance indicates that positioning on the platform is concentrated on one side of the market rather than evenly distributed. Sentiment data reflects open CFD positions on Capital.com at a specific point in time and may change rapidly as traders adjust their exposure.
Summary – Intesa Sanpaolo 2026
- As of 23 February 2026, Intesa Sanpaolo trades around €5.91, compared with approximately €2.97 in late February 2024, following a move above the €4–€4.50 range during 2025.
- Daily technical indicators show price holding above its 50-, 100-, and 200-day moving averages, with RSI near mid-range levels, suggesting consolidation rather than a strong directional trend.
- Key fundamental themes include the bank’s 2025 net income of €9.3bn, capital ratios, and planned cash distributions, balanced against execution risks and exposure to macroeconomic and regulatory developments.
- Recent developments centre on the 2026–2029 business plan, which targets higher profitability and cost efficiency, alongside updates on incentive structures and strategic workforce measures.
Past performance is not a reliable indicator of future results.
FAQ
Who owns the most Intesa Sanpaolo stock?
Intesa Sanpaolo has a broad shareholder base that includes institutional investors, asset managers, and retail shareholders. Its largest disclosed stakes are generally held by global investment firms and Italian banking foundations, as reported in regulatory filings. Shareholdings can change over time as institutions rebalance their portfolios or adjust strategic positions. For the most up-to-date breakdown of major shareholders, investors typically consult the bank’s official investor relations disclosures or relevant stock exchange filings.
What is the 5-year Intesa Sanpaolo share price forecast?
There is no single, reliable five-year ISP stock forecast. Most published analyst estimates focus on 12-month price targets rather than multi-year projections. Longer-term price outcomes depend on a range of variables, including interest rate trends, Italian and eurozone economic conditions, regulatory developments, competitive dynamics, and the bank’s ability to execute its strategy. These variables can evolve materially over time, which means any long-term projection remains inherently uncertain. As a result, five-year forecasts should be treated as speculative rather than definitive.
Is Intesa Sanpaolo a good stock to buy?
Whether Intesa Sanpaolo is considered 'good' depends on an individual’s objectives, risk tolerance, and time horizon. Some investors assess the bank’s earnings profile, dividend policy, and market position within Italy and Europe. Others place greater emphasis on macroeconomic risks, credit conditions, and sector volatility. Share prices can rise or fall, and exposure to bank stocks involves market, regulatory, and economic risks. For traders using CFDs, leverage can amplify both gains and losses. This information is provided for general educational purposes only and does not constitute investment advice.
Could Intesa Sanpaolo stock go up or down?
Yes. Like all listed shares, Intesa Sanpaolo’s stock price can move in either direction. Price changes may reflect company-specific developments such as earnings results, dividend announcements, capital actions, or shifts in credit quality. External factors – including changes in interest rates, inflation expectations, geopolitical developments, or eurozone banking regulation – can also influence price performance. Past performance is not a reliable indicator of future results.
Can I trade Intesa CFDs on Capital.com?
Yes, you can trade Intesa Sanpaolo CFDs on Capital.com. Trading share CFDs lets you speculate on price movements without owning the underlying asset and to take long or short positions. However, contracts for difference (CFDs) are traded on margin, and leverage amplifies both profits and losses. You should ensure you understand how CFD trading works, assess your risk tolerance, and recognise that losses can occur quickly.