IAG stock forecast: US-Israel strikes, oil surge
International Consolidated Airlines (IAG), owner of British Airways, is a London-listed airline group; shares turned volatile as oil rose above $105 and Middle East airspace closures disrupted routes. Past performance is not a reliable indicator of future results. Explore third-party price targets.
International Consolidated Airlines Group SA (IAG) is trading at £3.634 as of 2:04pm UTC on 12 March 2026, within an intraday range of £3.607–£3.753. Past performance is not a reliable indicator of future results.
The sell-off reflects several sector-wide headwinds. Oil prices surged above $105 a barrel following the escalation of the US-Israeli conflict with Iran that began on 28 February 2026 (Reuters, 9 March 2026), raising jet fuel cost concerns for airlines, where fuel can account for around 20%–25% of operating expenses (Charles Stanley, 23 January 2026). Middle Eastern airspace closures have also forced cancellations and rerouting across IAG’s network, including British Airways flights to Tel Aviv and Bahrain (The Independent, 2 March 2026).
The broader FTSE 100 has also declined sharply, trading around 10,290 on 12 March 2026 as geopolitical risk weighs on UK equities (Trading Economics, 12 March 2026). These pressures followed IAG’s full-year 2025 results on 27 February 2026, in which the group reported record operating profit of £5.02bn – ahead of the £4.97bn analyst consensus – but shares fell on the day amid the absence of concrete 2026 earnings guidance and concern over elevated fuel costs (Reuters, 27 February 2026).
International Consolidated Airlines stock forecast 2026–2030: Third-party price targets
As of 12 March 2026, third-party International Consolidated Airlines stock predictions span a wide range, shaped by the group’s record 2025 earnings and shareholder return programme on one hand, and near-term headwinds from the Iran conflict, Middle East airspace closures, and elevated jet fuel costs on the other. The five briefs below are ordered from lower to higher target and draw exclusively from broker actions published between 27 February and 12 March 2026.
Bernstein (trimmed buy target)
Bernstein analyst Alex Irving reiterates a Buy rating on International Consolidated Airlines while trimming the 12-month IAG stock forecast to £4.80 (480p) from £5 (500p), reflecting the impact of Middle East airspace disruptions on IAG’s network. Irving continues to position IAG as the best-placed carrier among European peers, citing slot constraints at Heathrow and the group’s double-digit return on invested capital as structural advantages (MarketScreener UK, 9 March 2026).
Deutsche Bank (maintained buy target)
Deutsche Bank analyst Jaime Rowbotham reaffirms a Buy rating and sets a 12-month price target of £5 (500p) on IAG. The note leaves the target unchanged despite sector volatility, with Rowbotham citing IAG’s earnings beat and the announced €500m share buyback programme as supportive of the existing valuation case (The Globe and Mail, 3 March 2026).
JP Morgan (buy rating reaffirmed)
JP Morgan reaffirms a Buy rating on IAG, following the initial market disruption triggered by the US-Israeli strikes on Iran and the subsequent British Airways flight cancellations. The bank maintains its positive view on the stock, with the rating affirmed amid the broader FTSE 100 sell-off that saw IAG shares fall sharply in early March (MarketScreener UK, 2 March 2026).
MarketBeat (consensus overview)
MarketBeat’s aggregated consensus for IAG, drawn from five analysts with active 12-month ratings, places the average price target at £4.66 (466p), with individual estimates ranging from £2.50 (250p) at the low to £6.30 (630p) at the high, and an overall consensus rating of Moderate Buy. The wide spread in individual estimates reflects divergent assumptions around fuel-cost normalisation and the duration of Middle East route disruptions (MarketBeat, 9 March 2026).
Motley Fool UK (City consensus summary)
Motley Fool UK reports that 21 City analysts hold active ratings on IAG, producing an aggregate 12-month price target of approximately £5.01 (500.6p) – implying a potential uplift of around 33% from the then-current price of £3.766 (376.6p). The piece notes IAG’s forward price-to-earnings ratio of approximately 6.5x sits at a discount to European airline peers, with analysts citing the shareholder return programme and transatlantic demand strength as the primary drivers of the constructive consensus (Motley Fool UK, 11 March 2026).
Predictions and third-party forecasts are inherently uncertain, as they cannot fully account for unexpected market developments. Past performance is not a reliable indicator of future results.
IAG stock price: Technical overview
The IAG stock price trades at £3.634 as of 2:04pm UTC on 12 March 2026. Price sits well above its moving-average structure, with the 10/20/50/100/200-day SMAs in a range of approximately £2.19–£2.35. Some traders read this type of separation as a sign that recent price action has outpaced the longer-term trend, which can increase the risk of sharper pullbacks.
Momentum leans weak: the 14-day RSI reads 34.81, sitting in lower-neutral territory and stopping short of oversold, while the average directional index at 21.64 indicates a trend of moderate rather than strong conviction, leaving the technical picture in an indeterminate phase. The MACD level at −4.18 and the awesome oscillator at −13.16 both remain in negative territory, consistent with a market that has yet to establish a durable floor.
On pullbacks, the classic R1 pivot at £2.42 can act as a reference level, with the R2 area near £2.56 as the next point to watch. With price currently above these levels, some traders treat them as potential support on a retracement rather than near-term resistance. The classic pivot at £2.33 also aligns with the Ichimoku base line at approximately £2.31 and the volume-weighted moving average near £2.30, forming a cluster that could act as a near-term inflection zone if price revisits the area.
Initial support is seen into the S1 pivot area at £2.19, which sits in proximity to the 100-day SMA at £2.19 and the 200-day EMA at £2.15. A sustained move below that zone could shift focus toward S2 near £2.10. The hull moving average at £2.19 reinforces the significance of that area as the principal downside reference to monitor on a closing basis (TradingView, 12 March 2026).
This is technical analysis for informational purposes only and does not constitute financial advice or a recommendation to buy or sell any instrument.
International Consolidated Airlines share price history (2024–2026)
IAG’s stock price has climbed sharply over the past two years, recovering from the mid-£1 range to briefly trade above £4.60 earlier in 2026.
IAG opened March 2024 around £1.55 and spent much of mid-2024 consolidating in the £1.65–£1.85 range. The stock then gathered momentum through the autumn, breaking above £2 in September 2024 and pushing through £2.40 by November as improved full-year earnings expectations supported demand. It closed 2024 at £3.04, roughly double where it had started the year.
The rally extended into early 2025, with IAG climbing steadily from around £3.02 in January to a peak close of £3.52 on 28 February 2025 before pulling back through April, when the stock dipped to a low of £2.11 on 7 April 2025 amid a broader market sell-off. Recovery followed through May and into the summer, with the price returning to the £3.80–£4 range by September 2025, then holding that level through year-end, closing 2025 at £4.16.
IAG reached its two-year high close of £4.63 on 26 February 2026, the day of its full-year 2025 results, before pulling back sharply on geopolitical and fuel-cost concerns. IAG is trading at £3.634 on 12 March 2026, approximately 12.6% below that February peak but around 134% above its early March 2024 level of approximately £1.55.
Past performance is not a reliable indicator of future results. Share prices are indicative and may differ from live market prices.
IAG: Capital.com analyst view
IAG’s price performance over the past two years reflects a significant re-rating of the stock, driven in large part by the group’s record 2025 results, in which pre-tax profits climbed 26% to €4.5bn on revenues of €32bn, supported by strong North Atlantic premium demand and a period of easing jet fuel costs. The group’s Heathrow slot position, premium cabin investment at British Airways, and diversified brand portfolio across Iberia, Aer Lingus, and Vueling have been cited as structural supports for earnings. However, the sharp pullback from the 26 February 2026 peak of £4.63 to the current £3.634 illustrates how quickly sentiment can shift. The escalation of the Iran conflict has pushed oil prices higher, which may increase pressure on fuel costs and reduce the tailwind that supported much of the 2025 profit beat. Middle East airspace closures have also added near-term route disruption risk.
On a longer view, the structural case rests on premium transatlantic demand, capital returns including a €500m buyback, and a forward price-to-earnings ratio that several analysts describe as a discount to sector peers. Against this, meaningful risks remain: sustained elevated fuel costs, softening consumer spending in key markets, intensifying competition on transatlantic routes from Gulf carriers and new entrants, and the vulnerability of IAG’s premium-heavy model to any deterioration in discretionary travel. Travel to the US among European passengers declined more than 4% in 2025, and the extent of any 2026 recovery on that corridor remains uncertain.
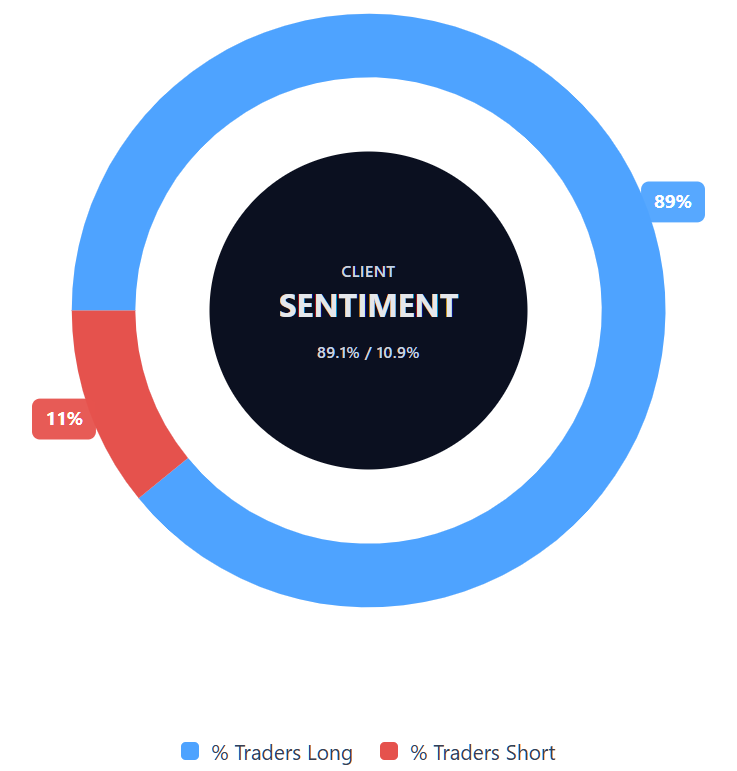
Capital.com’s client sentiment for IAG CFDs
As of 12 March 2026, Capital.com client positioning in IAG CFDs stands at 89.1% long versus 10.9% short, putting buyers ahead by 78.2 percentage points and placing sentiment in a strongly long-leaning range. This snapshot reflects open positions on Capital.com at the time of capture and can change rapidly as market conditions evolve.
Summary – International Consolidated Airlines 2026
- IAG is trading at £3.634 as of 2:04pm UTC on 12 March 2026, down from a two-year high close of £4.63 on 26 February 2026 but up sharply from £1.55 in early March 2024.
- Technical indicators are broadly bearish: price remains above all major moving averages, while the 14-day RSI sits at 34.81 in lower-neutral territory, and the MACD remains negative.
- Key upside drivers include IAG’s record 2025 operating profit of €4.5bn, a €500m share buyback, and strong North Atlantic premium demand supported by Heathrow slot scarcity.
- Key downside risks centre on oil prices rising above $105 a barrel following the US-Israeli strikes on Iran in late February 2026, elevated jet fuel costs, and Middle East airspace closures disrupting IAG routes.
Past performance is not a reliable indicator of future results.
This is a marketing communication and should not be construed as investment research or investment advice.
FAQ
Who owns the most International Consolidated Airlines stock?
What is the 5 year International Consolidated Airlines share price forecast?
Is International Consolidated Airlines a good stock to buy?
Could International Consolidated Airlines stock go up or down?
Should I invest in International Consolidated Airlines stock?
Can I trade International Consolidated Airlines CFDs on Capital.com?
Yes, you can trade International Consolidated Airlines CFDs on Capital.com. Trading share CFDs lets you speculate on price movements without owning the underlying asset and to take long or short positions. However, contracts for difference (CFDs) are traded on margin, and leverage amplifies both profits and losses. You should ensure you understand how CFD trading works, assess your risk tolerance, and recognise that losses can occur quickly.