HENSOLDT stock forecast: CEO contract extended to 2031
HENSOLDT is a Germany-based defence technology company focused on radar and sensor systems. Explore third-party HAG price targets and technical analysis.
HENSOLDT AG (HAG) was trading around €78.52 at 1:49pm (UTC) on 25 February 2026, moving within an intraday range of €78.22-€81.32 on Capital.com’s feed as the stock consolidated after recent gains. Past performance is not a reliable indicator of future results.
Price action is unfolding against a backdrop of company-specific developments. On 24 February 2026, the HENSOLDT supervisory board decided to extend CEO Oliver Dörre’s contract to the end of 2031 (HENSOLDT, 24 February 2026). Recent updates highlighted order intake of about €2.02bn and revenue of roughly €1.54bn for the first nine months of 2025, supported by radar and optronics contracts linked to European rearmament (Investing.com, 7 November 2025). In addition, HENSOLDT flagged planned investment of around €1bn between 2025 and 2027 to expand capacity for German defence orders (Reuters, 26 September 2025).
HENSOLDT stock forecast 2026–2030: Third-party price targets
As of 25 February 2026, third-party HENSOLDT stock predictions are based on assumptions about European defence demand, the company’s order pipeline and its earnings trajectory. Brokers may revise them as new financial results, guidance or macroeconomic data emerge.
Warburg Research (broker update)
Warburg Research raises its HENSOLDT price target from €86 to €91 and upgrades the stock from Hold to Buy. Analyst Christian Cohrs cites what he described as a more attractive entry point after a share price setback. The note references expectations for a solid 2025 year-end result and continued order momentum as key assumptions behind the revised target (MarketScreener, 16 February 2026).
Simply Wall St (consensus snapshot)
Simply Wall St states that analysts have a consensus HENSOLDT price target of about €96.18, with individual estimates ranging from €70 to €120. The service notes that the spread reflects differing assumptions about future earnings growth, profit margins and project risk as defence investment and programme execution evolve (Simply Wall St, 18 February 2026).
Bazaartrend (technical projection levels)
Bazaartrend publishes HAG stock forecast grid outlining upside levels at approximately €83.48, €85.60, €87.73 and €91.16, alongside downside reference levels from about €77.42 to €69.74. The site clarifies that these are technical projection points derived from recent price action and support-resistance analysis, rather than fundamental analyst price targets (Bazaartrend, 4 February 2026).
Fintel (consensus overview)
Fintel shows an average one-year HENSOLDT price target of about €92.14, based on multiple analyst forecasts. It adds that this aggregate figure updates as new broker research becomes available and represents the level at which analysts collectively assess the shares over a 12-month horizon (Fintel, 25 February 2026).
Predictions and third-party forecasts are inherently uncertain, as they cannot fully account for unexpected market developments. Past performance is not a reliable indicator of future results.
HAG stock price: Technical overview
The HAG stock price trades around €78.52 as of 1:49pm (UTC) on 25 February 2026, below its main simple moving average cluster, with the 20-, 50-, 100- and 200-day SMAs grouped near approximately €81, €81, €85 and €89 respectively. The 14-day relative strength index (RSI) sits close to 43, in the lower-neutral band, while the average directional index (ADX) near 16 indicates a relatively weak directional trend rather than a sustained uptrend or downtrend.
On the topside, the nearest classic resistance appears around the R1 area near €95.4, with R2 around €107.2 coming into view only if price records a decisive daily close above that first pivot zone. On pullbacks, the classic pivot near €84.9 marks an initial reference point, with the 100-day SMA around €84.8 forming an adjacent moving-average level. A sustained move below this zone could bring the S1 area near €73.1 into focus as a subsequent downside reference (TradingView, 25 February 2026).
This technical analysis is for informational purposes only and does not constitute financial advice or a recommendation to buy or sell any instrument.
HENSOLDT share price history (2024–2026)
HAG’s stock price has undergone a marked re-rating over the past two years, moving from the low €30s in early 2024 to the high €70s by late February 2026. The stock traded around €33-€40 through much of spring 2024, then advanced into the second half of the year. It closed near €61.75 on 31 March 2025 before continuing higher into the €90-€110 range during the autumn.
After peaking above €110 in early October 2025, HAG retraced towards the mid €60s by early December. It then rebounded into year-end and early 2026, closing at €73.53 on 30 December 2025 and climbing into the mid €80s in January. As of 25 February 2026, HENSOLDT ended the session at €79.58, leaving it significantly above its 2024 levels but below the highs recorded in the final quarter of 2025.
Past performance is not a reliable indicator of future results. Share prices are indicative and may differ from live market prices.
HENSOLDT (HAG): Capital.com analyst view
HENSOLDT’s share price has moved from the low €30s in early 2024 to the high €70s by late February 2026, reflecting increased investor attention on European defence spending trends and the company’s expanding order pipeline. Periods of upward momentum around contract announcements and earnings releases have alternated with consolidation phases as valuations and broader market conditions adjusted.
At the same time, the price history shows that HAG has experienced sharp reversals. The decline from above €110 in October 2025 to the mid €60s by early December illustrates how quickly sentiment can shift when expectations change or risk appetite moderates. Factors such as procurement timelines, budget allocations, competitive dynamics and execution risks could influence future performance.
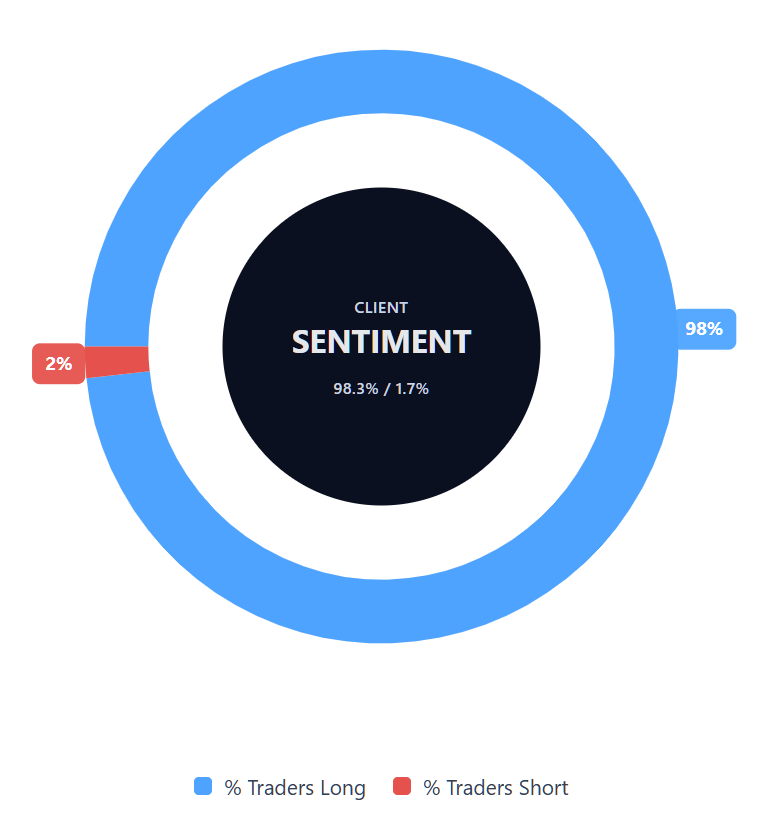
Capital.com’s client sentiment for HENSOLDT CFDs
As of 25 February 2026, Capital.com client positioning in HENSOLDT CFDs remains skewed towards long positions, with 98.3% of open positions on the buy side and 1.7% on the sell side, leaving buyers ahead by approximately 96.6 percentage points. This snapshot reflects open CFD positions on Capital.com at the time of writing and may change as traders respond to news flow, price movements and wider market developments.
Summary – HENSOLDT 2026
- As of 1:49pm (UTC) on 25 February 2026, HENSOLDT traded near €78.52, above early 2024 levels but below the €110+ highs recorded in October 2025.
- Technical indicators show price trading below its 20-, 50-, 100- and 200-day moving averages, with RSI near 43 and ADX indicating a relatively weak directional trend.
- Key drivers include European defence spending trends, HENSOLDT’s radar and sensor order pipeline, and shifts in broader market risk appetite, which have coincided with both pronounced rallies and notable corrections.
- Recent news flow has centred on reported 2025 order and revenue growth, the extension of the CEO’s contract to 2031, and ongoing defence-related partnerships and radar contracts in Europe.
Past performance is not a reliable indicator of future results.
FAQ
Who owns the most HENSOLDT stock?
HENSOLDT’s shareholder base usually comprises a mix of strategic investors, institutional asset managers and free-float shareholders. Large stakes have historically been held by cornerstone or government-linked investors, alongside international funds. Ownership levels may change over time due to placements, index rebalancing or strategic transactions. Investors should refer to the company’s latest annual report or regulatory filings for the most up-to-date breakdown of major shareholdings.
What is the five-year HENSOLDT share price forecast?
There is no single, reliable five-year HAG stock forecast. Most published analyst targets focus on a 12-month horizon, with estimates reflecting assumptions about defence spending, order intake, margins and execution. Longer-term projections carry additional uncertainty, including potential changes in budgets, geopolitical priorities and competitive dynamics. Any multi-year forecast should therefore be viewed as indicative rather than predictive, and analysts may revise it as conditions evolve.
Is HENSOLDT a good stock to buy?
Whether HENSOLDT is considered ‘good’ depends on an individual’s objectives, risk tolerance and time horizon. The company operates in the defence and sensor technology sector, which can benefit from increased government spending, but it also faces programme, regulatory and budget risks. Share price volatility in recent years highlights both potential opportunity and downside risk. This information is for general purposes only and does not constitute investment advice.
Could HENSOLDT stock go up or down?
Like any listed share, HENSOLDT’s stock price can move in either direction. It may respond to earnings releases, contract announcements, changes in defence budgets, geopolitical developments and broader equity market conditions. Technical factors and investor positioning can also influence shorter-term price movements. Past performance does not guarantee future results, and volatility means both gains and losses are possible.
Should I invest in HENSOLDT stock?
Deciding whether to invest in HENSOLDT requires careful consideration of your financial situation, objectives and risk appetite. Shares in defence-related companies can be sensitive to political, fiscal and project-specific developments. You may wish to conduct your own research and, where appropriate, seek independent financial advice. This article provides general market information and does not represent a recommendation to buy or sell HENSOLDT shares.
Can I trade HENSOLDT CFDs on Capital.com?
Yes, you can trade HENSOLDT CFDs on Capital.com. Trading share CFDs lets you speculate on price movements without owning the underlying asset and to take long or short positions. However, contracts for difference (CFDs) are traded on margin, and leverage amplifies both profits and losses. You should ensure you understand how CFD trading works, assess your risk tolerance, and recognise that losses can occur quickly.