Eni stock forecast: Ex-dividend date, buyback update
Eni S.p.A. is an Italian energy group whose share price is being shaped by its 24 March 2026 ex-dividend date and the recent Capital Markets Update announcing a €1.5 billion buyback. Past performance is not a reliable indicator of future results. Explore third-party ENI price targets and technicals.
Eni S.p.A. (ENI) is trading at €22.77 in European afternoon trading at 1:35pm UTC on 24 March 2026, within an intraday range of €22.40–€23.22,. Past performance is not a reliable indicator of future results.
Several factors are shaping price movement. Eni's ex-dividend date (24 March 2026) is exerting mechanical downward pressure on the share price, as usually happens when a stock adjusts for a declared distribution (Eni, 25 February 2026). In parallel, Brent crude, a key driver of Eni's upstream earnings, traded near $98–$100 per barrel on 24 March 2026 after pulling back from multi-day highs above $115, amid reports that the US stepped back from direct threats against Iran (CNN, 20 March 2026). The broader backdrop also includes Eni's 19 March 2026 Capital Markets Update, at which the company announced a €1.5 billion share buyback programme, a proposed 2026 dividend of €1.10 per share (up approximately 5%), and targeted annual cash flow growth per share of 14% . These details had supported the share price in the days prior to today's session (MarketScreener, 19 March 2026).
Eni stock forecast 2026–2030: Third-party price targets
As of 24 March 2026, third-party Eni stock predictions follow the company's Q4 2025 earnings beat and its 19 March 2026 Capital Markets Update.
Berenberg (Hold, target lifted)
Berenberg analyst Henry Tarr reiterates a Neutral (Hold) rating on Eni while lifting the price target, citing expected earnings upside from elevated commodity prices as the basis for the revision. The bank stops short of an upgrade, noting that the prevailing share price already reflects much of the positive operational newsflow (The Globe and Mail, 7 March 2026).
RBC Capital Markets (Sector Perform, target raised to €24)
RBC Capital Markets analyst Biraj Borkhataria raises its 12-month price ENI stock forecast to €24 from €20, maintaining a Sector Perform rating following Eni's Capital Markets Update. The bank acknowledges continued upstream momentum and disciplined capital expenditure, while noting that the current valuation has absorbed a significant portion of the recent positive newsflow (MarketScreener, 20 March 2026).
Goldman Sachs (Buy, target raised to €25)
Goldman Sachs analyst Michele della Vigna raises the 12-month price target on Eni to €25 from €24, reiterating a Buy rating. The revision follows the Capital Markets Update, with the bank highlighting volume growth and disciplined capital expenditure as factors supporting cash generation at prevailing Brent crude levels (MarketScreener, 20 March 2026).
MarketBeat (Moderate Buy consensus, NYSE-listed shares)
MarketBeat aggregates ratings from 12 analysts covering the NYSE-listed shares (NYSE: E) and reports an average 12-month price target of $34.60, alongside a Moderate Buy consensus drawn from one Strong Buy, four Buy, and seven Hold ratings. The service notes that this consensus sits materially below the prevailing share price, reflecting a lag in individual target revisions relative to the stock's sharp year-to-date appreciation amid elevated oil prices and post-earnings momentum (MarketBeat, 16 March 2026).
Jefferies (Buy, target reiterated)
Jefferies analyst Mark Wilson reiterates a Buy rating on Eni, maintaining the most constructive stance among the brokers summarised here. The bank points to Eni's upstream production trajectory and ongoing portfolio simplification, including satellite model asset sales, as underpinning a premium valuation relative to European integrated peers (The Globe and Mail, 21 March 2026).
Predictions and third-party forecasts are inherently uncertain, as they cannot fully account for unexpected market developments. Past performance is not a reliable indicator of future results.
ENI stock price: Technical overview
The ENI stock price is trading at €22.77 at 1:35pm UTC on 24 March 2026, sitting above a broadly aligned moving-average stack where the 20/50/100/200-day simple moving averages run at roughly €21.40 / €19.06 / €17.57 / €16.13, with each registering buy signals against the current price. The 10-day simple moving average at €22.71 is the sole exception, flashing a mild sell signal, while the Hull moving average (9) at €23.24 similarly prints a sell, suggesting some near-term overextension relative to the very short-term trend.
Momentum supports the broader picture: the 14-day relative strength index reads 66.8, sitting in firm territory without yet reaching stretched levels, and the average directional index at 63.0 suggests a well-established trend. The MACD (12, 26) level at 1.255 adds a corroborating buy signal, consistent with ongoing upward price pressure in the medium term.
To the topside, the first reference to watch is the classic R1 pivot at €20.77, which the price has already cleared. The R2 level at €21.88 also sits comfortably below the current price, leaving the R3 zone near €25.02 as the next meaningful pivot resistance. A sustained daily close toward that area would be required to keep the upward structure intact.
On pullbacks, the classic pivot at €18.74 offers initial chart support, followed by the 100-day simple moving average shelf at €17.57. Should price slip towards the S1 level at €17.63 and lose the 100-day moving average, that would raise the risk of a deeper retracement towards the 200-day simple moving average near €16.13 (TradingView, 24 March 2026).
This is technical analysis for informational purposes only and does not constitute financial advice or a recommendation to buy or sell any instrument.
Eni share price history (2024–2026)
ENI’s stock price closed at €14.57 on 25 March 2024, the earliest data point in the two-year window, trading in a narrow range through much of mid-2024 before drifting lower into the mid-€13s by year-end . It closed 2024 at €13.10.
2025 started steadily in the low €13s, but the stock came under sharp pressure in April, touching an intraday low of €11.04 on 9 April 2025 amid broad market volatility, before recovering through the summer. ENI gradually reclaimed the €14–€15 range across the second half of the year and closed 2025 at €16.18, up roughly 19.9% on the year.
The move into 2026 has been more decisive. ENI opened the year at €16.44 and accelerated sharply through February and March, reaching an intraday high of €24.05 on 19 March 2026, its highest level in the two-year window, before pulling back slightly around the ex-dividend date.
ENI closed at €22.84 on 24 March 2026, which is approximately 38.9% up year to date and 61.9% up year on year.
Past performance is not a reliable indicator of future results. Share prices are indicative and may differ from live market prices.
Eni (ENI): Capital.com analyst view
Eni's share price has staged a notable recovery over the past 12 months, gaining around 62% year on year to trade near €22.77 as of 24 March 2026. The move has been supported by elevated Brent crude prices, a strong Q4 2025 earnings beat, and a well-received Capital Markets Update in March 2026 outlining a €1.5 billion buyback and a proposed dividend increase. That said, the same oil-price sensitivity that has lifted the stock cuts both ways. Any sustained softening in Brent, whether from demand weakness or easing geopolitical tensions, could erode the earnings uplift that has underpinned much of the re-rating.
Eni's ongoing portfolio simplification and satellite model asset sales offer a potential source of value that is less correlated to the commodity cycle, though execution risk and deal timing remain genuine variables. Analyst targets published in March 2026 span a wide range, from €17.50 to €27, reflecting genuine disagreement on how much of the positive newsflow is already priced in. That breadth of opinion is itself a reminder that outcomes remain uncertain.
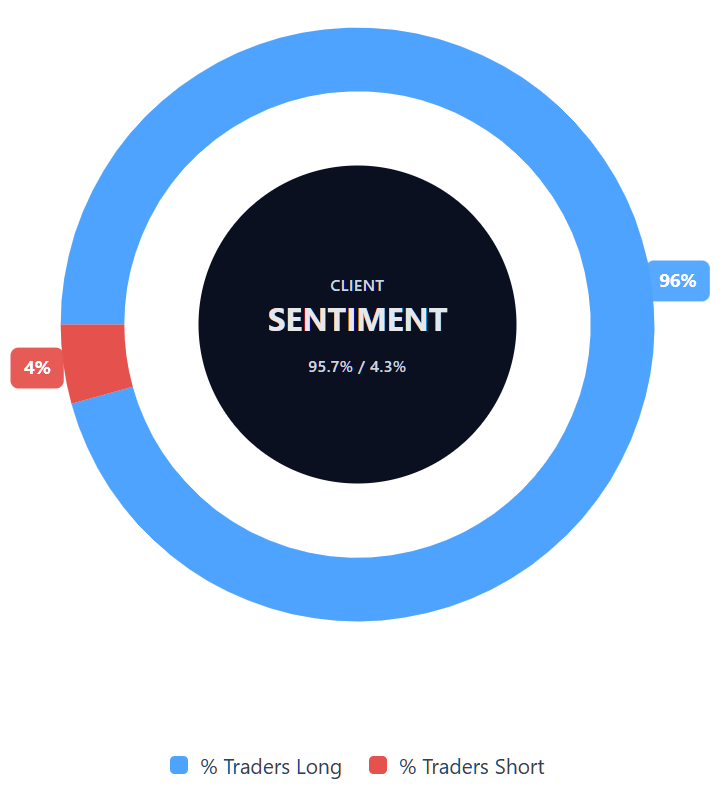
Capital.com’s client sentiment for Eni CFDs
As of 24 March 2026, Capital.com client positioning in Eni CFDs shows 95.7% long and 4.4% short, putting buyers ahead by 91.3 percentage points and placing sentiment firmly in one-sided, long-heavy territory. This snapshot reflects open positions on Capital.com and can change rapidly as market conditions evolve.
Summary – Eni 2026
- As of 1:35pm UTC on 24 March 2026, Eni S.p.A. (ENI) was trading at €22.77, up sharply from two-year lows near €11.04 reached in April 2025.
- Technical indicators are broadly constructive: the 14-day relative strength index sits at 66.8, all major moving averages from the 20-day through to the 200-day signal buy, and the average directional index at 63.0 suggests an established trend.
- The Hull moving average (9) and 10-day simple moving average both flag mild short-term sell signals, suggesting some near-term overextension relative to the very recent trend.
- Key price drivers include elevated Brent crude near $98–$100 per barrel, Eni's Q4 2025 earnings beat, and a March 2026 Capital Markets Update that outlined a €1.5 billion buyback and a proposed approximately 5% dividend increase.
- ENI went ex-dividend today (24 March 2026) on an interim payment of €0.52 per share, which is applying typical mechanical downward pressure on the share price in this session.
Past performance is not a reliable indicator of future results.
FAQ
Who owns the most Eni S.p.A. stock?
What is the 5 year Eni S.p.A. share price forecast?
Is Eni S.p.A. a good stock to buy?
Could Eni S.p.A. stock go up or down?
Should I invest in Eni S.p.A. stock?
Can I trade Eni S.p.A. CFDs on Capital.com?
Yes, you can trade Eni CFDs on Capital.com. Trading share CFDs lets you speculate on price movements without owning the underlying asset and to take long or short positions. However, contracts for difference (CFDs) are traded on margin, and leverage amplifies both profits and losses. You should ensure you understand how CFD trading works, assess your risk tolerance, and recognise that losses can occur quickly.